Financial
Strategies
of Japanese
Electric Utilities
Teruhiro Tomita
1. Introduction
In recent years, there have been widespread moves to liberalize, restructure and privatize the
electric power industry across the world. But the industry differes in many important aspects, for
example, technology and fuel choice, ownership, and degree of vertical integration. The dominant
ownership forms in the industry are privately franchised oligopolies, regulated by rate of return
criteria, and 100% state- or municipally-owned monopolies. Technology and fuel choice are hydro,
thermal (oil, coal, gas), nuclear and/or their mix. As for the degree of vertical integration, OECD
classifies into three structural forms. Firstly, systems operated by vertically integrated utilities
protected from competition e.g., France, the.USA and Japan. Secondly, systems characterized by
vertical separation and limited competition e.g. Germany, Spain and Netherlands. And finally,
systems which have both vertical separation and horizontal competition e.g. UK and Norway.
Since the oil crises, the Japanese electric utilities are undergoing a structural change of the
electricity demand and supply, and are required to reduce the supply cost and secure a stable supply
of electricity (Fig.1).
Hence it is an important task for the management to rationalize the plant and equipment investment and strengthen the financial structure. In particular, the electric utilities experienced financial deterioration due to direct effects of the escalation of oil prices, radical changes in the rate of exchange, and inflation, and revised electricity rates several times ( Fig. 2).
To cope with the financial difficulties due to such exogenous conditions, the electric utilities have been energetically promoting the diversification of power sources and cost reduction. As a result, the financial problem is now departing from the past pattern of fluctuating fuel expense. The burden of capital costs for the electric source diversification is becoming the largest straining factor for the management, and its reduction is a task of increasing importance. In other words, in response to the age of low economic growth wherein the electricity demand and revenue do not grow much, it is necessary to search for measures for securing long-term stability of electricity rates while balancing the revenue, expenditure, plant and equipment investment, financing and the like.
This paper aims to analyze strategies of capital investment and financing of Japanese electric utilities considering the interaction of energy security, energy cost and environment under regulation. For that purpose, a complex econometric model : INFINITE( Investment and Financing by Iterative Model) was developed, and we review past financial behavior of utilities and simulate future investment and its financing of the industry with the model.l>
2. Structure of INFINITE Model
2.1 Outline of the INFINITE Model
The INFINITE model is ,a financial simulation model designed for specifically analyzing the mechanism of interaction between the plant and equipment investment and its financing of the electric utilities .2 The model consists of six blocks of plant and equipment investment, electricity demand and supply, expenditures, capital financing, revenues, and balance sheet. Each block has interdependent relationships with other blocks. The model is outlined in Fig. 3.
The present model has three features. First, four balances of electricity demand and supply,
sources and uses of funds, revenue and expenditure, and assets and liabilities are determined
simultaneously. The electricity demand and supply are balanced with each other in the electricity
demand block. The balance of funds is determined by the block of plant and equipment investment
and the block of capital
The revenue and expenditure balance is detenrnined by the expense block and the revenue block.
The accounting balance is determined by the assets side and the liabilities side of the balance sheet
block.
The second feature is the linkage between the power plant and equipment investment on the
starting basis and that on the completion basis. It normally takes several to nearly ten years to
complete an electric power plant from the start to the completion ( commercial operation ). In the
model, by indicating a standard cash flow pattern of construction costs for each kind of power
source, the amount of the completed plant is appropriated to the respective years of the construction
period. Such amounts are put together for the respective power sources to estimate the amount of
investment on the starting basis.
The third feature is the division of thermal power plant into three groups of oil-burning,
coal-burning, and LNG-burning to specifically analyze the effects of the investment for power source
diversification. With this arrangement, it has become possible to quantitatively determine the
effects of the development of power sources alternative to oil, which has been positively promoted
by the electric utilities since the oil crises, on the management of the electric utilities . Further, it has
become possible for the -availability factor of the oil-burning thermal power plant to adjust the
balance between electricity demand and supply in a short run.
2.2 Criterion of Investment
The electric utilities have been striving to rationalize the plant and equipment investment and raise its efficiency. What is the criterion of investment? We will consider two strategies:
(1) To minimize the amount of investment, (2) To achieve the desired supply capacity factor.
The strategy (1) is to minimize the disbursement of funds for investment in plant and equipment . When the capacity is excessive, this strategy surely lowers the supply cost in a short run . In a longer perspective, however, the consumer will eventually have to pay higher electricity rates since the supply cost will rise due to increased fuel costs and capacity shortage.
In contrast to the strategy (1), the strategy (2) aims at reducing the average supply cost in a long run by setting a rational supply capacity factor or ratio of the power capacity to the maximum power demand as a target. The desired level of supply capacity factor of the electric utilities seems to be about 1.3 when the capability margin, summer repair, and loss factor of plant-home use are taken into consideration( Fig. 4).
By the way, in the "Prospect of the long-term electricity demand and supply" of CRIER (1986) , the supply capacity factor is assumed to be 1.3 for the year 2000 . The present level of the supply capacity factor of the electric utilities is about 1.4. This rather high value is considered to be temporal due to the present active investment for power source diversification.
According to the target of electric power development set by the demand and supply subcommittee of the Electric Utilities Council, the supply capacity factor for the year 1990 is 1.38, 1.35 for the year 1995, and 1.30 for the year 2000. Thus the power development plan is designed to bring the supply capacity factor to the target. The present model adopts the investment criterion which aims at the target supply capacity factor in view of restraint of supply cost and stable supply .
2.3 Block Configuration of the INFINITE Model
(1) Plant and Equipment Investment Block
The electric power development plan is exogenous to the present financial model. Hence the
power plant on the material quantity basis is treated as given in time series by power source. The
power plant on the completion basis is determined by multiplying the plant (material quantity) by
the unit cost of construction work.
For instance, we have the following equation for LNG-buming thermal powers
ISL = DQSL x PSL
(1)
where
ISL: the amount of LNG-burning power plant completed,
DQSL: the increment of LNG-burning power plant,
PSL: unit cost of construction work of LNG-burning power plant.
each year. As shown by the equation (1), the amount of plant completed of each year, even that of a
future plan, is given in time series. This completed amount must be linked to the amount of work
started (work basis). Each power plant will take several years to complete from the commencement
of the construction project. In the model, a standard construction period and a standard cash flow
pattern of construction costs are assumed by power source.
For example, the case of the LNG-burning thermal power is expressed by
ISL= INVSLt_3
+ INVSLt_2
+ INVSLt_,+ INVSLt
(2)
where
INVSLt = the amount paid for LNG-burning thermal power plant in the time period t.
As shown above, the construction period of the LNG-burning thermal power plant and that of the
oil-burning thermal power plant are assumed to be four years. Eight years for nuclear power, seven
years for hydropower (both conventional and pumping-up plants), and six years for coal-burning
thermal power.
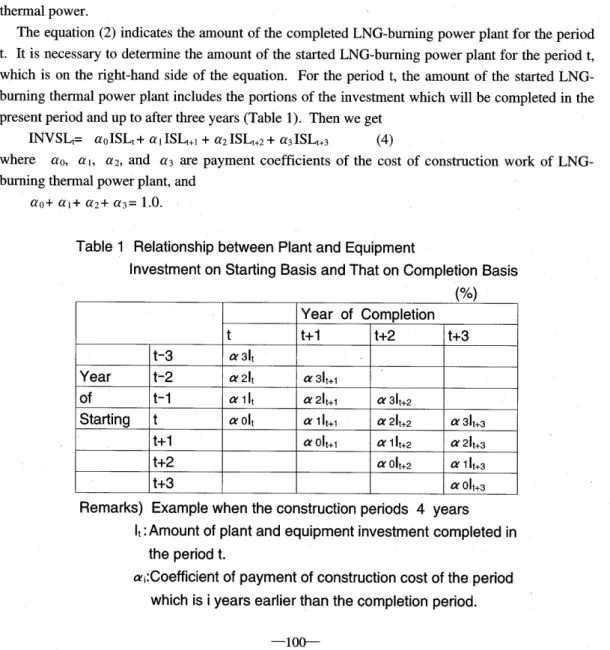
The equation (2) indicates the amount of the completed LNG-burning power plant for the period
t. It is necessary to determine the amount of the started LNG-burning power plant for the period t ,
which is on the right-hand side of the equation. For the period t, the amount of the started
LNG-burning thermal power plant includes the portions of the investment which will be completed in the
present period and up to after three years (Table 1). Then we get
INVSLt= a o ISLt + a 1
ISLt+1
+ a2 ISLt+2
+ a3 ISLt+3
(4)
where ao, a,, a2, and a3 are payment coefficients of the cost of construction work of
LNG-burning thermal power plant, and
ao+ al+ a2+ a3= 1.0.
Table 1
Relationship between Plant and Equipment
Investment on Starting Basis and That on Completion Basis
(%)
Year of Completion
t t+1 t+2 t+3
t-3 a 31t
Year t-2 a 2It a31t+1
of t-1 alit a 2It+1 a 31t+2
Starting t aOlt a 1 It+i a 21t+2 a 31t+3
t+1 a olt+i a 1 It+2 a 21t+3
t+2 a Olt+2 a 1 It+3
t+3 a Olt+3
Remarks) Example when the construction periods 4 years
It: Amount of plant and equipment investment completed in
the period t.
a;:Coefficient of payment of construction cost of the period
which is i years earlier than the completion period.
Equations for other thermal, nuclear and hydraulic power sources can be given in the same way as the equation (4). The total amount of the power plant started is thus the sum of the investment started of the respective power sources. Some of the transmission facilities take several years to construct. However, we assume, for simplicity, that all of the transmission facilities started in the present period will be completed in the following period. The amount of the transportation facilities investment started in the period t is expressed as a function of the electricity demand (kWh) .
The plant and equipment investment on the starting- basis includes the funds for expansion work (power plant and transmission facilities), and funds for improvement work and nuclear fuel funds. As for the funds for improvement work, those for oil-to-LNG or oil-to-coal fuel conversion works and those related to environment including pollution control have been increasing in recent years .
The estimated functions are those of power plant and the ratio of plant and equipment modernization. The ratio of plant and equipment modernization is the weighted average of the ratios
of the new investment for the last three years of the power plant and the distribution facilities.
(2) Capital Financing Block
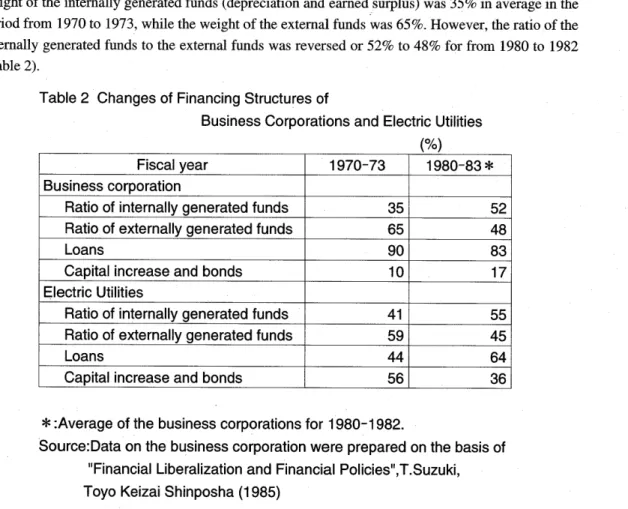
One general feature of the corporate financing in recent years is the rising weight of the
internally generated funds to the required funds. For the business corporations as a whole, the
weight of the internally generated funds (depreciation and earned surplus) was 35% in average in the
period from 1970 to 1973, while the weight of the external funds was 65%. However, the ratio of the
internally generated funds to the external funds was reversed or 52% to 48% for from 1980 to 1982
(Table 2).
Table 2 Changes of Financing Structures of
Business Corporations and Electric Utilities
N
Fiscal year 1970-73 1980-83 *
Business corporation
Ratio of internally generated funds 35 52
Ratio of externally generated funds 65 48
Loans 90 83
Capital increase and bonds 10 17
Electric Utilities
Ratio of internally generated funds 41 55
Ratio of externally generated funds 59 45
Loans 44 64
Capital increase and bonds 56 36
*:Average of the business corporations for 1980-1982.
Source:Data on the business corporation were prepared on the basis of
"Financial Liberalization and Financial Policies"
,T.Suzuki,
Another feature of the corporate finance is a conspicuous diversification of the means of external financing. The loan on the yen basis, which accounted for 83% of the total in the period from 1970 to 1974, dropped down to 48% in the period from 1981 to 1983. In place of the loan on the yen basis, the weights of the impact loans from the overseas, equity financing in the domestic and international markets and issuance of bonds (in particular , foreign bonds) have been increasing in recent years. We will examine the transition of the actual records of the capital financing by the electric utilities. In the 1970s, the ratio of the internally generated funds to the total funds was about 40% in average and lower than that of the external funds . It was attributed to the shift of depreciation from the fixed percentage method to the fixed installment method due to the financial deterioration of the electric utilities, resulting from the inflation and the escalation of fuel prices after the oil crises, and to the reduction of the internal reserve.
However, the financial performance was improved in and after 1982 . As the electric utilities strove to accumulate the internal reserve, the ratio of internal funds reached 60% the position of the external funds was reversed.
This change was attributed mainly to the adoption of the 100% fixed percentage method in place of the fixed installment method, and to the increased weight of the reserve for nuclear fuel reprocessing and the depletion of the nuclear fuel in the internal reserve .
In formulating the capital financing block, we will examine the principles of corporate financing: the minimization of fund cost, and the higher ratio of net worth . In practice, the financing behavior of the electric utilities gave priority to the fund cost minimization , and the ratio of net worth was maintained at the minimum level within the issue limit of bonds .
Thus it steadily dropped from 30% in the 1960s to 15% in 1980s (Table 3) . The Commercial
Table 3 Transition of Net Worth Ratio and Factor of Bonds Issued
Fiscal year 1960 1965 1970 1975 1980 1981 1982 1983
Net worth ratio(%)
33.3 31.4 27.1 18.5 14 14.3 15.3 15.2Factor of bonds issued 0.6 0.9 1.4 1.8 2.8 2.7 2.7 2.6
Code prescribes the issue limit of bonds within the sum total of the equity capital and capital reserves. However, according to the Exception Law for the electric utilities enacted in 1976 , which was in force for ten years, the limit was raised to four times. Further, as a result of a revision made in 1985, the issue limit has been raised to six times for the time being . At the end of the fiscal 1983, the bonds issued reached 7,314 billion yen. The factor of bonds issued was 2.6 times in average for the nine electric power companies. The highest factor was 3.1 times. Therefore, there is an ample margin for bond issue.
In issuing bonds, the electric utilities have been striving to diversify the financing sources and make it more efficient by, for example, issuing Euro bonds in the Euro-currency market of which rates are low, and issuing 6-year, 10-year, 12-year and 15-year redemption bonds .
flotation of bonds in the foreign markets by the electric utilities will be increased more and more. The foreign currency loans, however, may invite exchange risks. The electric utilities should pursue the diversification of sources to lower the cost of financing while taking a variety of measures to avoid exchange risks, such as dollar-linked bonds and swap bonds.
The required funds not covered by the internally generated funds are procured as external funds (they are all treated on the net increment basis in the present block). First, bonds of the lowest rate will be issued. Equity capital is determined together with the bond flotation since the former is related to the bonds limit. Borrowed money is assumed to eventually make up the capital shortage as a balancing item.
In the past, the electric utilities made capital increase by 20 or 30 percents once every two or three years, considering the financial situation and the issue limit of the bonds. However, as the increasing burden of the dividend resulting from capital increase is expected to strain the financial situation in the future, there will be a limit to the continuation of the capital increase with the past interval. When we consider the borrowed money as the balancing item of the financing, we assume that funds required by the electric utilities can be procured eventually: by loan from the open market. However, Banking Law provides that the total loans to any single corporation be kept within a given percentage of the sum total of the lending bank's equity capital and reserves. Accordingly the electric utilities have been pursuing diversification of borrowings from Norin-Chukin Bank Ltd., National Federation of Credit Associations, and pension trusts, in addition to usual loans from city banks and life insurance companies.
(3) Expenditure Block
The expense of the electric utilities is divided into seven items: personnel expenses, fuel expenses,
repairing expenses, interest payment, depreciation expenses, power purchase, and other expenses.
These expense items plus net income are called the total costs herein.
When we examine the percentage distribution of the total costs, some features can be recognized.
The personnel expenses continued to decrease from 20% of the year 1958, dropped below 10% in
1980 and havebeen leveling off at about 8% ever since. During this period, the total number of
employees of the nine electric power companies has been constant at about 130,000 to 140,000
persons. In the same period, the employment has been increased significantly in the manufacturing
industry. The electric utilities have been restraining the increase in the employment through
rationalization and commissioning of business, which resulted in a drop of the weight of the
personnel expenses.
The fuel expenses, which have the largest weight in the total cost configuration, have increased
radically due to the two oil crises. In particular, they accounted for 38% in the fiscal 1974 or year
just after the first oil crisis. hey dropped down to 30% in the fiscal 1983 due to the increased share
of nuclear power generation and the decline of fuel prices.
Next, we consider the depreciation expense which is related to the capital cost. After the oil
crises, it dropped below 10% since the depreciation method was changed from the fixed percentage
method to the fixed installment one due to the effects of the increased fuel prices. However, the
promotion of the investment to develop alternative energy sources and the escalation of construction cost required a huge amount of capital expenditure. The fixed percentage method was partially applied in and after 1980. In 1983, the whole system of depreciation returned to the fixed percentage method. As a result, the weight of the depreciation returned to the level of 10%. The interest payment has been maintaining the level of 10 to 12% almost constantly. This is due to the heavy dependence on the external financing. The repairing expenses have been in the range from 7 to 10% , but they have a tendency to fluctuate in response to the financial condition of the utilities .
Other expenses include various taxes such as fixed assets tax, business tax and electric power development promotion tax, consignment expenses, research expenses, rents, accident insurance premiums, and reserve for reprocessing of spent fuel. These expenses account for about 20%. In recent years, they have been increasing gradually because of the increased rate of the electric power development promotion tax, and the increase of the reserve for reprocessing due to the increasing nuclear power generation.
Next, the formulation of the expenditure block will be explained. As wages and salaries account for most of the personnel expenses, the, latter is defined as a function of the average wage per employee and the number of employees. .
The fuel expenses are composed of thermal power fuel expenses and the nuclear fuel depletion .. The total fuel expense is obtained by multiplying the respective consumption of coal , oil, and LNG thermal power plants by the respective unit prices of fuel and adding up all of the products. The consumption of each fuel is calculated from the power generated. Each fuel price is treated as exogenous. The nuclear fuel depletion cost is determined from the nuclear power generation .
The depreciation and the repairing expenses are defined to be basically determined by the electric utilities fixed assets. The repairing expenses are considered to increase with the increase of the age of plant, the ratio of plant modernization was added as an index of the vintage of the capital.
Interest charges are defined as a function of the bonds and the long-term loans. Interest charges herein are the gross interest charges including the interest during construction. The interest during construction is a cost of the fixed assets, and is not included in the expenses of the fiscal year . Accordingly, the interest during construction is subtracted from other expenses for convenience . As other expenses include various taxes and miscellaneous expense items , they are defined as a function of the net income and the initial total assets.
The net income before tax is defined as a function of the equity capital, since it is considered to be retained as a profit required for the payment of the dividend and corporation tax.
(4) Balance Sheet Block
The balance sheet block is composed of the assets and the liabilities and equity capital. The assets
are classified into fixed assets of electric utilities (excluding land), land, construction work in
progress, other fixed assets (such as non-operating fixed assets, nuclear fuel, and investment),
current assets and deferred charges. The liabilities are classified into fixed liabilities and current
liabilities. The fixed liabilities are composed of bonds, long-term loans, and reserves for employee's
retirement allowance, etc. (including reserve for reprocessing of spent fuel). From the viewpoint of
accounting, any fixed liabilities payable within one year are classified as current liabilities. In our treatment, however, they are included in the bonds and long-term loans of the fixed assets under the necessity of calculating the interest charges. Hence fixed liabilities payable within one year are not included in the current liabilities. The shareholder's equity is composed of common stock, legal reserve, and retained earnings.
The above-mentioned classification provided the basis for the formulation of the balance sheet block. As each item of the balance sheet is a stock variable, the formulas basically take the form of accounting identical equation.
(Balance at the end of period) = -(Balance at the initial of period) + (Change during period) However, some variables are expressed by functions for the convenience in making the model. They are construction work in progress, other fixed assets and current assets. The balance at the end of period of suspense account of fixed assets is defined as a function of initial balance of construction work in progress, amount of plant and equipment investment started, and amount of plant and equipment investment completed. Other fixed assets and current assets are defined as functions of total assets.
The assets and the liabilities of the balance sheet must be balanced with each other. Adding up the items of the assets and those of the liabilities and equity capital, respectively, does not guarantee that they tally with each other. To make them balance, current liabilities are used as a balancing item. Fig. 5 illustrates the relationship between the plant and equipment investment and the capital financing in relation with the balance sheet.
Balance of funds
F=1 Balance
item
Fig.5 Relation between Investment in Plant and Equipment, and Raising of Funds
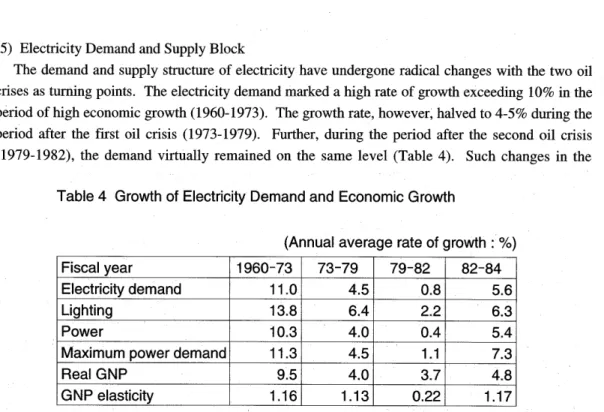
(5) Electricity Demand and Supply Block
The demand and supply structure of electricity have undergone radical changes with the two oil crises as turning points. The electricity demand marked a high rate of growth exceeding 10% in the period of high economic growth (1960-1973). The growth rate, however, halved to 4-5% during the period after the first oil crisis (1973-1979). Further, during the period after the second oil crisis (1979-1982), the demand virtually remained on the same level (Table 4). Such changes in the
Table 4 Growth of Electricity Demand and Economic Growth
(Annual average rate of growth : %)
Fiscal year 1960-73 73-79 79-82 82-84
Electricity demand 11.0 4.5 0.8 5.6
Lighting 13.8 6.4 2.2 6.3
Power 10.3 4.0 0.4 5.4
Maximum power demand 11.3 4.5 1.1 7.3
Real GNP 9.5 4.0 3.7 4.8
GNP elasticity 1.16 1.13 0.22 1.17
demand structure reflected the transition of the economy to low growth, the change in the industrial structure from a heavy power consuming one to a less power consuming one, and the spread of energy saving measures. Since 1983, the growth rate of demand has been exceeding 5% due to the recovery of the economy, effects of the atmospheric temperature, etc., the basic trend, however, is considered to be low growth in the future. The maximum demand has shown a growth similar to that of the electricity consumption, but its growth rate exceeded that of the electricity consumption in 1983 and 1984 due to the effects of fierce heat of the summer.
The electricity supply structure was seriously effected by the oil crises due to the vulnerability of the energy supply and the escalation of the oil prices. Since then, the electric utilities have been promoting the development of power sources alternative to oil power to secure stable supply of electricity and restrain the supply cost. In 1975 or immediately after the oil crisis, the oil-burning thermal power accounted for 63% of the power generated. Because of the positive promotion of diversification of power sources, it dropped down to 36% in 1983. The nuclear power increased from 6% of 1975 to 20% of 1983.
The above-mentioned conditions were considered in formulating the demand and supply block. As for demands, the lighting consumption function uses the personal consumer spending .(real term) and the electric lighting charge (real term). The power consumption function uses IIP and the electric power charge (real term).
Then maximum demand is considered composed of the base demand and the demand for cooler. The base demand is explained by private enterprise capital stock (real term). The demand for cooler uses the diffusion rate of domestic air conditioners as a substitute variable.
(M) by the availability factor. The power loss is determined by multiplying the power generated
plus the power purchased from others by a certain loss factor The hydraulic power generated and the
power purchased from others are considered exogenous. With this arrangement, the identical
equation of the power balance is as follows:
(Power consumption) _= (power generated) -(power loss) + (power purchased from others).
To establish this balance equation, the oil-burning thermal power generated is used as the
balancing item. The power generated is adjusted to balance the power demand and supply by
varying the availability factor of the oil-burning thermal power.
(6) Revenue Block
The electric utilities made rate revisions three times after the first oil crisis. The factors which
necessitated the rate revisions were as follows: The sudden rise of the fuel expense due to the
escalation of the oil prices, the alternative power source development investment, the increase in the
distribution facilities investment due to remoter siting of power sources, and the increase in capital
cost due to the inflationary escalation of construction costs all pushed up the cost, but the demand
was slowed down, resulting in a financial deterioration.
The transition of the ratio of investment to revenue (the electric power plant and equipment
investment / the lighting and power service revenue) is shown in Fig. 6 and Table 5, the ratio
fluctuated greatly within a range from 30% to 60% on the year basis.
0.8 0.6 0.4 0.2 0 58 60 62 64 64 66 68 70 72 74 76 78 80 82 84 Fig.6 Ratio of Investment to Revenue
Table 5 Transition of Electric Utilities' Investment to Revenue
Fiscal year 1960-73 73-79 79-82 82-84
Growth rate of electricity demand 11.0 4.5 0.8 5.4
Growth rate of utilities' revenue 13.1 19.0 17.8 6.0
Growth rate of plant/equipment 12.3 12.9 6.7 -0 .3
We divided the period into four sections according to the changes in the demand and supply structure. In the period of high economic growth (1960-1973), the investment kept the pace with the increase in electricity demand attending the economic growth. The ratio of investment to revenue was 36% in average (Table 5). After the first oil crisis, the ratio of investment to revenue rose to
39% in average due to the diversification of power sources, remoter siting of distribution facilities, and the escalation of the unit price of construction. After the second oil crisis, the demand leveled off and the increase in revenue could not be expected while the capital cost continued to rise gradually. Therefore, the plant and equipment investment has been slowed down; it has been leveling off since.1980.
When setting a model for the revenue block, it should be noted that the electricity rates are determined according to the cost principle. There are several cost principles. The basic philosophy
of the total cost principle is that the estimated cost, which is all of the costs required to supply electricity plus the fair return for business, should match the estimated revenue from the electricity rates. In the present model, the total cost is divided into fixed cost and variable cost. The lighting service revenue and the power service revenue are determined according to an idea that the fixed cost is recovered from the demand charge and the power charge, and the variable cost is recovered from the energy charge.
In balancing the revenue and expense, the profit or the revenue minus the cost normally plays the role of the balancing item. In our model, however, the "other revenue" other than the sales revenue is used as the balancing item since the net profit is treated as a profit required for the payment of dividend according to the total cost approach.
3. Forecast of Capital Financing to the Year 2000
On the basis of the results of the interpolation (Tomita[9]), the model was . extrapolated according to the principle that the average supply cost (real) be maintained at the level of 1980.1) Fig. 7
shows the outline of forecast with the financial model.
Policy variables Generating capacity mix Supply capacity factor Unit cost of construction of power generating plant Rate of capital increase Initial conditions Inputs Data variables GNP Wholesale prices Energy prices INFINITE Model Outputs Management indices Average supply cost Amount of plant and equipment investment Ratio of investment to revenue Ratio of own funds to investment Net worth ratio Factor of bonds issued Yes Examine alternatives? No Stop
The economic growth and generating capacity mix indicated by the long-term projection up to
the year 2000 prepared by CRIEPI were used. The setting of the primary exogenous variables were
as follows: The total generating capacity mix of the nine electric power companies in the year 2000
was assumed to be as shown in Table 6, nuclear power generation capacity of 53,000 MW, coal
power generation capacity of 12,500 MW, oil capacity of 42,000 MW, LNG capacity of 43,500
MW, hydropower capacity of 28,000,MW, totaling 179,000 MW.
Table 6 Generating Capacity Mix of Electric Utilities
(1000MW)
Nuclear Coal LNG Oil Hydro Pump Hydro Total
1984 18.9 5.7 20.1 53.1 10.6 12.1 120.5
(%)
(15.7)
(4.7)
(16.7)
(44.1)
(8.8)
(10.0)
(100.0)
2000 53 12.5 43.5 42 15 13 179
(%)
(29.6)
(7.0)
(24.3)
(23.5)
(8.4)
(7.3)
(100.0)
As for the rates of increase in commodity prices (annual rates of increase up to the year 2000), the wholesale price index was assumed to rise by 0.9%, and the unit cost of construction work by 1.9%. The interest rates were assumed to maintain the standard rates of 1984. Interest rates were assumed to be 7.2% (borrowing from Japan Development Bank), 8.0% (borrowing from other organizations), and 7.94% (bonds). The rate of capital increase was assumed to be 3.0%. Because of extrapolation on the basis of the above mentioned setting of the exogenous variables, the investment in plants and 'equipment in the year 2000 was found to be 5,624 billion yen. Its breakdown was 1,995 billion yen (35.5%) for power plant and equipment, 1,833 billion yen (32.6%) for transmission, 734 billion yen (13.1%) for improvement work, and 1,062 billion yen (18.9%) for nuclear fuel (Table 7).
Table 7 Investments in Power and Equipment in 2000
(billion yen,%)
1980 1984 2000
(actual)
(actual)
(forecast)
Power source
1,096(34.5)
1,152(38.5)
1,995(35.5)
Transmission
1,164(36.6)
731(24.4)
1,833(32.6)
Improvement work
678(21.3)
802(26.8)
734(13.1)
Nuclear fuel
240(7.6)
305(10.2)
1,062(18.9)
Total
3,179(100.0)
2,990(100.0)
5,624(100.0)
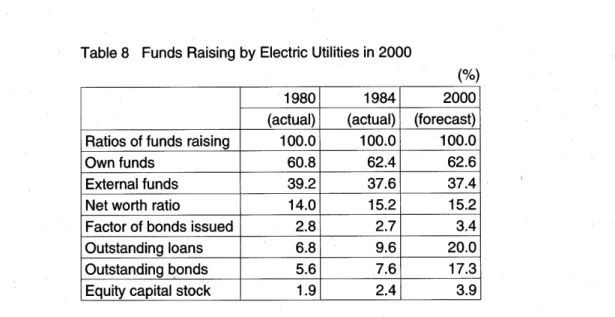
At the time, the ratio of own fund would be 62.6%, the net worth ratio 15.2%, and the factor of bonds issued 3.4 times. The outstanding loans would be 20 trillion yen, and the outstanding bonds 17,300 billion yen (Table 8). The cost structure of the year 2000 would be as shown in Table 9. The cumulative total of the investment in plant and equipment for the period from 1985 to 2000 would be 67 trillion yen. The portion to be covered by self-financing would rise to 67% (59% in
Table 8 Funds Raising by Electric Utilities in 2000
(%)
1980 1984 2000
(actual)
(actual)
(forecast)
Ratios of funds raising 100.0 100.0 100.0
Own funds 60.8 62.4 62.6
External funds 39.2 37.6 37.4
Net worth ratio 14.0 15.2 15.2
Factor of bonds issued 2.8 2.7 3.4
Outstanding loans 6.8 9.6 20.0
Outstanding bonds 5.6 7.6 17.3
Equity capital stock 1.9 2.4 3.9
average for the period from 1980 to 1984), but the net worth ratio, being an index of financial safety, would merely maintain the present level (15%).
Table 9 Cost Structure of Electric utilities in 2000
(billion yen,%)
1980
(%)
1984
(%)
2000
(%)
Personal expenses 816 8.0 1,018 8.3 1,971 9.2 Fuel expenses 3,548 34.8 3,631 29.7 4,940 21.1 Interest charges 961 9.4 1,321 10:8 2,757 12.9 Repairing expenses 770 7.6 1,016 8.3 1,944 9.1 Depreciation expenses 944 9.3 1,427 11.7 2,795 13.1 Other expenses 1,442 14.2 1,901 15.6 4,272 20.0Expenditure purchased power 769 7.5 972 8.0 1,610 7.5
Pretax profits 937 9.2 924 7.6 1,075 5.0
Total 10,190 100 12,210 100 219364 100
Table 9 shows that the weight of the fuel expenses in the supply cost would drop from the present
30% to 21% in the year 2000. In contrast, the capital cost (the sum of the interest charges and the
depreciation costs) would rise from 22.5% to 26% to become the largest cost item. This means that
in the past the fuel expenses (a variable cost) was the largest expense item, but the huge investment
in power plant and equipment would increase the capital cost ( a fixed cost). The first and the
second oil crises resulted in a drop in the capital cost ratio and an increase in the fuel expense ratio.
However, with the increase in the weight of nuclear power generation, the capital cost has been
increasing again, and its burden is judged to continue to increase ahead.
As for the capital cost, the interest charges would increase from 10% to 13%, and with this
change, the fluctuation of the interest rates would have greater effects. In view of the increased risk
of the interest rates, the improvement in the net worth ratio would gain more significance to the
stability of the management.
As for the extrapolative simulations, we examined cases in which the capital increase rate was
changed (3% of the standard case was changed to 5% and 1%, respectively), cases in which the
interest rates were changed (fluctuation of ± 2% relative to the setting of the standard case), and a
case in which the breakdown of the liabilities was changed (all of the borrowing from Japan
Development Bank was substituted by bonds) to identify interrelationships. The results are shown
in Table 10. The lowest supply cost would result from the case in which the level of interest rate
dropped by 2%.
Table 10 Summary Results of Simulation cases (1985-2000)
Standard CaseCasel.1 Casel.2 Case2.1 Case2.2 Case 3
Plant and Equipment Investment (billion yen)
66,737 66,737 66,737 66,737 66,737 66,737Ratio of Investment to Revenue 25.2% 24.9% 25.3% 25.9% 24.4% 24.9%
Ratio of Own Fund 66.6% 67.0% 64.8% 66.6% 66.6% 66.6%
Net worth ratio (in 2000)
15.2% 18.0% 13.2% 15.2% 15.2% 15.2%Factor of Bonds issued (in 2000)
3.4 2.5 4.4 3.4 3.4 4.4Ratio of Profit to Net worth (in 2000)
13.5% 14.6% 12.3% 13.5% 13.5% 13.5%Ratio of Profit to Total Liabililties (in 2000)
7.3% 7.7% 7.0% 60.% 8.6% 7.9%The second lowest supply cost would result from the case in which the rate of capital increase was 1%. As for the results of the case of the drop in the interest rate level, it may be pointed out as follows; As the outstanding loans are determined by subtracting the funds covered by self-financing from the amount of investment in plants and equipment, the substitution effect from self-financing to borrowing is not admitted even in the case of a drop in the interest rate level.
Accordingly, the simulation measured the pure effects of a drop in the interest rate level. From the viewpoint of aiming at lowering the burden of interest payment, this assumption seems to be appropriate. About the results of the ratio of capital increase of 1%, the simulation assumed that the capital increase had the highest cost of financing. Accordingly, the lower the rate of capital increase, the lower the cost of funds.
4. Conclusion
The results of the simulation with the model indicate that the burden of the capital cost would increase for the electric utilities in the future. In particular, the increase of the ratio of the interest payment burden means that the interest rate fluctuation will give larger effects on the financial conditions of the electric utilities.
Japanese corporations and utilities will be confronted with wider ranges of fluctuations in interest rates and exchange rates due to financial liberalization and internationalization, widening financial gaps due to bonds rating, and increased options of capital financing.
In the bonds market, which is one important capital financing market for the electric utilities , the tendencies of laying stress on the American-way of bonds rating are expected to increase with the adoption of more flexible rules of the issue. Therefore, enterprises with good financial status and high financial efficiency may become more advantageous in issuing bonds .
Electric utilities must shift their financial policy from the capital financing with the highest priority given to the quantitative assurance of funds, such as one seen in the high economic growth period, to one which gives stress on the qualitative aspect or reducing the cost of funds by selecting the most advantageous means of financing. In other words, the electric utilities would be required to make flexible and mobile capital financing in and out of Japan, seeking favorable conditions.
One more thing must be said about planning process. Any planning process requires making assumptions about the future. These assumptions are fuel prices, load curve, generation capacity and its mix, general economic conditions and so on. It is necessary to recognize within the planning process that assumptions are frequently incorrect. As a consequence, it is necessary to reflect uncertainty and alternative sets of assumptions in the planning process .4) But we can simulate easily with software like Crystal Ball.') electric power industry was one of the most stable industries before the oil crises, but since then, it is a very risky and challenging industry by financial risk , energy security, global warming, nuclear accident, and competition among utilities . Therefore risk analysis of electric utilities is essential.
Notes
*
This paper is a revised version of my unpublished draft "Simulation of Investment and
Financing of Electric Utilities". Interpolation analysis of electric utilities was examined in
Tomita[9].
I INFINITE is an abbreviation of the Investment and Financing by Iterative Model. It is an
econometric model of about 100 simultaneous equations and most of variables are, interacted and
determined simultaneously, all values of variables in t-th period are converged by iteration
method and those of t-th period are transmitted to t+ I -th period. The INFINITE model is
programmed by TSP.
2 There are many financial planning models in previous studies, e.g. Lee[5], and as for the electric
utilities models, Joskow-Baughman model[l] and Elfin model[2] are an economic-engineering
approach, and the former is one of representative models of U.S. electric utilities in early 80s, and
the latter is an environment oriented model which is composed of three submodel: generation
model, financial model and capacity expansion model. Kwoka[4] and Pollitt[7] are econometric
models of the interactive analysis for ownership, integration and competition in the electricity
industry.
and Tester-Wood-Feffari[8]. 4 See Pechman[6] chapter 8.
5 Crystal Ball Software is developed by Decisioneering, Inc.
References