www.impactjournals.com/oncotarget/ Oncotarget, Vol. 7, No. 13
Tumor-promoting function and prognostic significance of the
RNA-binding protein T-cell intracellular antigen-1 in esophageal
squamous cell carcinoma
Junichi Hamada1,2,*, Katsutoshi Shoda1,2,*, Kiyoshi Masuda1,*, Yuji Fujita1,2, Takuya
Naruto1, Tomohiro Kohmoto1,3, Yuko Miyakami1,3, Miki Watanabe1,3, Yasusei Kudo4,
Hitoshi Fujiwara2, Daisuke Ichikawa2, Eigo Otsuji2, Issei Imoto1
1 Department of Human Genetics, Institute of Biomedical Sciences, Tokushima University Graduate School, Tokushima,
770-8503, Japan
2 Division of Digestive Surgery, Department of Surgery, Kyoto Prefectural University of Medicine, Kyoto, 602-8566, Japan 3 Student Lab, Tokushima University Faculty of Medicine, Tokushima, 770-8503, Japan
4Department of Oral Molecular Pathology, Institute of Biomedical Sciences, Tokushima University Graduate School,
Tokushima, 770-8503, Japan
*These authors contributed equally to this work
Correspondence to: Issei Imoto, e-mail: [email protected]
Keywords: T-cell intracellular antigen-1, isoform, oncogene, RNA-binding protein, esophageal squamous cell carcinoma
Received: October 01, 2015 Accepted: February 05, 2016 Published: March 06, 2016
ABSTRACT
T-cell intracellular antigen-1 (TIA1) is an RNA-binding protein involved in many regulatory aspects of mRNA metabolism. Here, we report previously unknown tumor-promoting activity of TIA1, which seems to be associated with its isoform-specific molecular distribution and regulation of a set of cancer-related transcripts, in esophageal squamous cell carcinoma (ESCC). Immunohistochemical overexpression of TIA1 ectopically localized in the cytoplasm of tumor cells was an independent prognosticator for worse overall survival in a cohort of 143 ESCC patients. Knockdown of TIA1 inhibited proliferation of ESCC cells. By exogenously introducing each of two major isoforms, TIA1a and TIA1b, only TIA1a, which was localized to both the nucleus and cytoplasm, promoted anchorage-dependent and anchorage-independent ESCC cell proliferation. Ribonucleoprotein immunoprecipitation, followed by microarray analysis or massive-parallel sequencing, identified a set of TIA1-binding mRNAs, including SKP2 and CCNA2. TIA1 increased SKP2 and CCNA2 protein levels through the suppression of mRNA decay and translational induction, respectively. Our findings uncover a novel oncogenic function of TIA1 in esophageal tumorigenesis, and implicate its use as a marker for prognostic evaluation and as a therapeutic target in ESCC.
INTRODUCTION
Esophageal cancer is the eighth most common cancer worldwide, and the sixth most common cause of death from cancer [1]. Despite the advances in multimodal therapies, the outcome of this disease remains poor [2]. In Asian countries, including Japan, esophageal squamous cell carcinoma (ESCC) lacking accessible genomic characteristics accounts for > 90% of esophageal cancers [3]. The identification of deregulated molecules that lead to unrestrained cell growth and/or cell death evasion during carcinogenesis is needed for the establishment of
novel prognostic markers and therapeutic targets to guide individualized treatment of ESCC.
RNA-binding proteins (RBPs) coordinate the lives of mRNAs by contributing to various post-transcriptional modification processes under both physiological and pathological conditions [4, 5]. Given the central role of RBPs in the regulation of gene expression, malfunction of RBP or mutations in the RNA elements they recognize can lead to cancer development and progression. Indeed, several RBPs have been reported to be involved in carcinogenesis by increasing or decreasing expression of various genes [6–8].
In addition, a global comparison of the transcriptional profiles in the Cancer Genome Atlas Pan-Cancer Dataset revealed that a significant change in RBP expression occurs and contributes to the dysregulated transcription of a set of oncogenes and tumor-suppressor genes across most cancer types [9]. However, the significance of RBPs in carcinogenesis remains primarily unknown.
The T-cell intracellular antigen-1 gene (TIA1) encodes TIA1 protein, a cytotoxic granule-associated RBP that possesses nucleolytic activity against cytotoxic lymphocyte (CTL) target cells [10]. TIA1 also acts as a stress-induced inhibitor of translation by localizing to stress granules (SGs) with polyA RNA and contributes to the induction of apoptosis in CTL targets [11–13]. The two alternative splice transcripts, TIA1 variant 1 (TIA1-v1, NM_022173.2) and variant 2 (TIA1-v2, NM_022037.2), which lack and include exon 5, respectively, encode two different isoforms, TIA1b (or TIA1 isoform 2, NP_071505.2) and TIA1a (or TIA1 isoform 1, NP_071320.2), respectively [14]. Although several reports refer to the relationship between TIA1 and epithelial carcinogenesis [14], the significance of TIA1 and/ or its isoforms in ESCC remains unclear.
In this study, we first report the importance of TIA1, particularly the TIA1a isoform, as a molecule exerting oncogenic activity by ectopically localizing to the cytoplasm and increasing/decreasing the expression of a set of cancer-related genes, including SKP2 and CCNA2, in the malignant progression of ESCC.
RESULTS
TIA1 protein expression and its association with the clinicopathological characteristics in ESCC
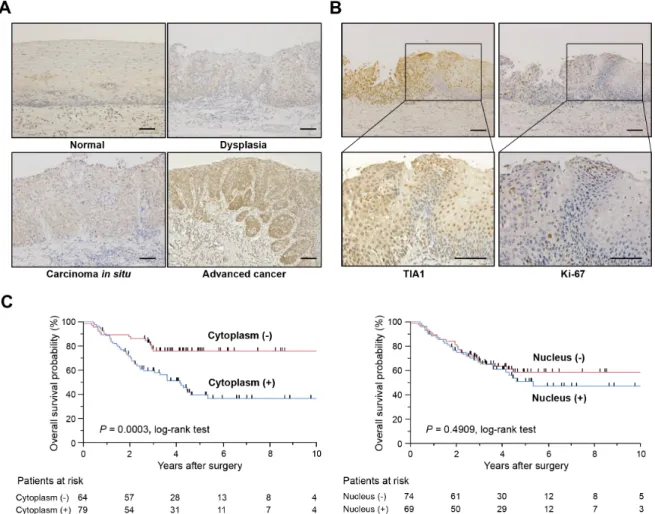
To determine the clinical significance of TIA1 in esophageal carcinogenesis, immunohistochemical staining (IHC) was performed in surgically resected tissues (Figure 1A). TIA1 immunoreactivity was observed primarily in the nucleus of normal esophageal epithelia and in dysplasic lesions, which displayed higher TIA1 immunoreactivity than the normal mucosa. In carcinoma in situ and advanced cancers, TIA1 staining was observed in both the cytoplasm and the nucleus, and cytoplasmic TIA1 immunoreactivity was higher in advanced cancers than in carcinoma in situ. Notably, higher immunoreactivity toward Ki-67, a cell proliferation marker, was observed preferentially in tumor cells with higher cytoplasmic TIA1 immunoreactivity (Figure 1B), suggesting that cytoplasmic TIA1 promotes the proliferation of ESCC cells [15, 16]. A similar pattern of TIA1 immunoreactivity was observed in squamous cell carcinomas of other tissues (Supplementary Figure S1A).
We then examined the clinicopathological significance of TIA1 expression in primary ESCC tumors based on the IHC staining pattern (Supplementary Figure S1B). Among 143 cases, positive cytoplasmic and nuclear TIA1 immunoreactivities were observed in 79 (55.2%) and 69
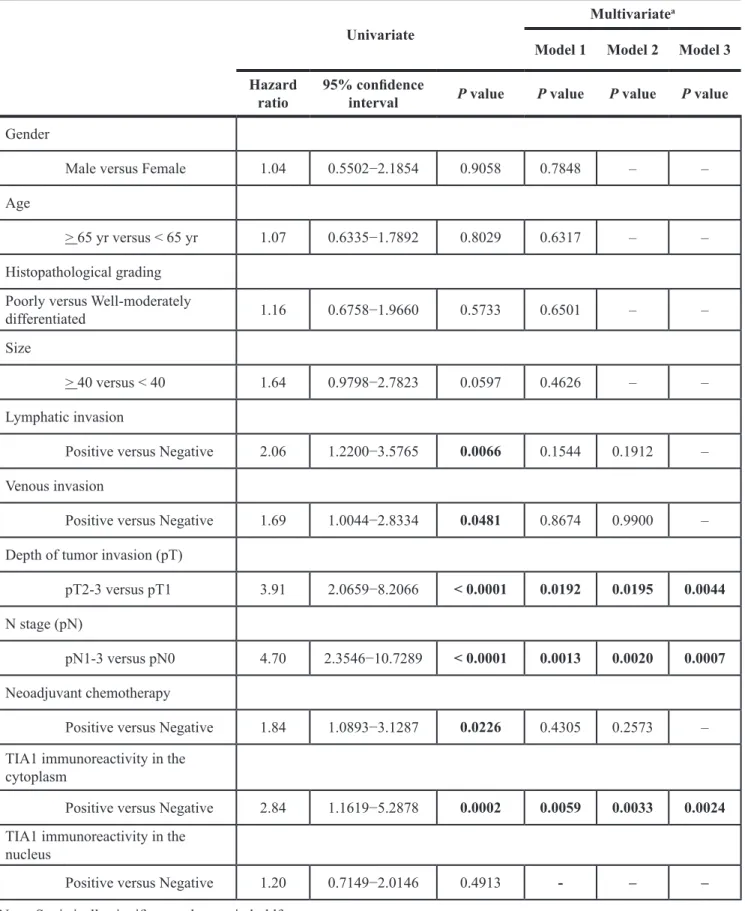
(48.3%) patients, respectively, based on their intensity scores (Table 1). Because positive cytoplasmic and nuclear TIA1 immunoreactivities were detected at the same levels between patients with and without neoadjuvant chemotherapy with 5-fluorouracil plus cisplatin (FP, Supplementary Tables S1 and S2), we combined all patients for further analyses. No significant association was observed between any clinicopathological factors and nuclear or cytoplasmic TIA1 immunoreactivity (Table 1). Kaplan– Meier survival estimates showed that positive cytoplasmic TIA1 immunoreactivity was significantly associated with worse overall survival in all 143 cases (P = 0.0003), but nuclear TIA1 immunoreactivity was not (Figure 1C). No synergistic effect between positive cytoplasmic and nuclear TIA1 immunoreactivities on overall survival was observed even after dividing ESCC cases into four groups according to both cytoplasmic and nuclear TIA1 staining patterns (Supplementary Figure S1C). In the Cox proportional hazards regression model, cytoplasmic TIA1 immunoreactivity, lymphatic invasion, venous invasion, pT and pN categories, and preoperative therapy procedures were statistically significant prognosticators for overall survival by univariate analyses (Table 2). Multivariate analyses showed that cytoplasmic TIA1 immunoreactivity and pT and pN categories were independent predictive factors regardless of the models used (Table 2), suggesting that overexpressed TIA1 is involved in the development and progression of ESCC through cytoplasmic localization.
Expression of TIA1 in ESCC cell lines
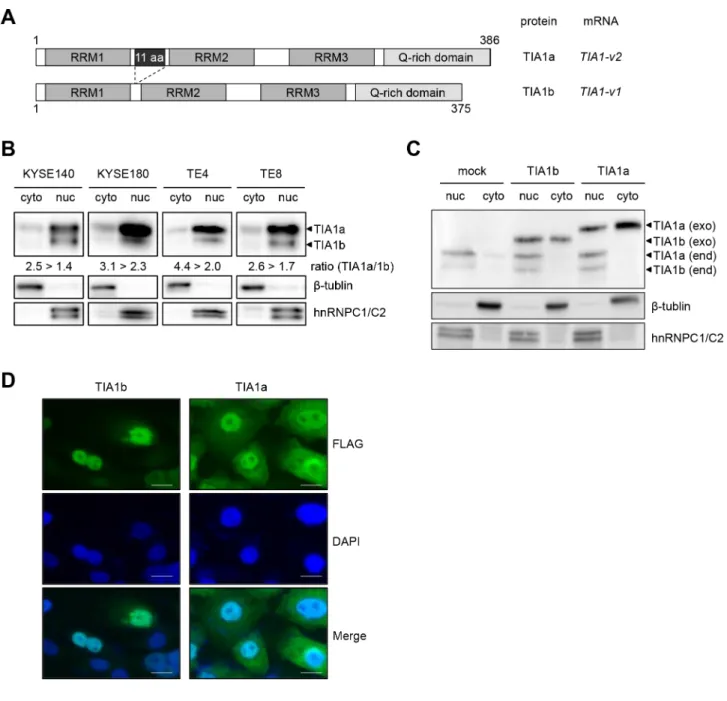
TIA1 mRNA overexpression, compared with the esophagus, was also detected in 30 of 45 ESCC cell lines by quantitative real-time PCR (qPCR, Supplementary Figure S2A). Similarly, TIA1 protein overexpression was observed in most of cancer cells compared with normal mucosa (Supplementary Figure S2B). The human TIA1 gene generates two major variants (v1 and v2) through alternative splicing of exon 5, encoding the shorter TIA1b and longer TIA1a isoforms, respectively (Figure 2A). TIA1 contains three domains with RNA recognition motifs (RRMs), and the 11 amino acids encoded by exon 5 are located between RRM1 and RRM2. Most ESCC cells constitutively express TIA1-v2 mRNA and a small amount of TIA1-v1 mRNA (Supplementary Figure S3A), resulting in the predominant expression of TIA1a protein compared with TIA1b protein (Supplementary Figure S2B). Similarly, both non-tumor and tumor tissues of primary ESCC predominantly expressed TIA1-v2 mRNA, and the TIA1 mRNA expression levels in tumors were higher than in those in paired non-tumor tissues in 3/6 (50%) of ESCC cases whose RNA was available (Supplementary Figure S3B). Western blot analysis using subcellular components obtained by cell fractionation showed that endogenous TIA1b was detected primarily in the nuclear lysate, whereas endogenous TIA1a was detected in both nuclear and cytoplasmic lysates, although most TIA1a was located in the nucleus (Figure 2B). Exogenously
expressed TIA1b protein in KYSE2270 cells with lower endogenous TIA1 expression localized predominantly to the nucleus, while a larger fraction of the exogenously expressed TIA1a protein localized to the cytoplasm compared with TIA1b protein, as demonstrated by western blot analysis (Figure 2C) and by fluorescent immunocytochemical staining (FIC, Figure 2D).
Involvement of TIA1 in ESCC cell proliferation
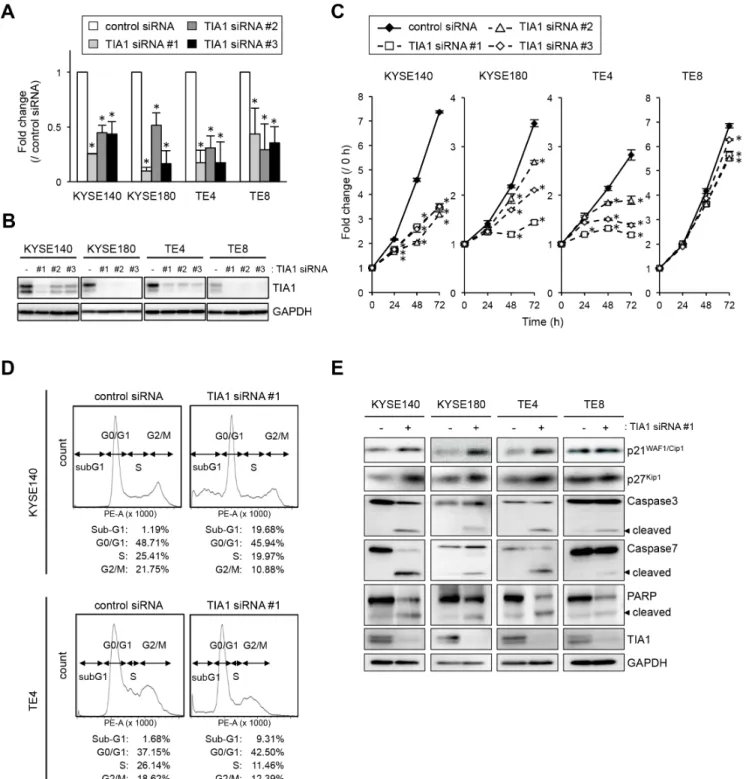
To gain insight into the potential function of TIA1 whose overexpression could be associated with esophageal carcinogenesis, we first tested the effects of small interfering RNA (siRNA) targeting TIA1 on cell proliferation. By silencing endogenous TIA1 using three different siRNAs, cell proliferation was significantly suppressed in KYSE140, KYSE180 and TE4 cells. In TE8 cells, which express lower levels of TIA1, treatment with TIA1-specific siRNAs led to minimal suppression (Figure 3A–3C). FIC demonstrated that Ki-67 expression
correlated with TIA1 expression; cells that retained TIA1 expression tested positive for Ki-67 expression, whereas cells in which TIA1 was effectively knocked down tested negative for Ki-67 expression (Supplementary Figure S4A). Using fluorescence-activated cell sorting (FACS) analysis to examine the mode of action of TIA1 in the cell cycle, an accumulation of cells in G0–G1 phase, with an accompanying increase in sub-G1 phase cells and a decrease in S and G2–M phase cells, was observed in TIA1 siRNA-treated cells compared with control siRNA-treated cells (Figure 3D). Knockdown of endogenous TIA1 significantly increased p21WAF1/Cip1 and p27Kip1 protein
levels, with extensive cleavage of caspase-3, caspase-7 and poly [ADP ribose] polymerase (PARP), which are markers of apoptosis (Figure 3E). These results suggest that TIA1 silencing in ESCC cells contributes to cell cycle arrest at the G1-S checkpoint and the induction of apoptosis.
We next introduced a TIA1[v1]- or TIA1[v2]-expressing retrovirus into KYSE190 and KYSE2270 cells
Figure 1: TIA1 protein overexpression and localization and its association with overall survival in primary ESCC tumors. (A) Representative results of the immunohistochemical detection of TIA1 protein in normal mucosa, dysplasia, carcinoma in situ and advanced squamous cell carcinoma of the esophagus. Scale bars: 40 μm. (B) Representative results of the immunohistochemical detection of TIA1 and Ki-67 in serial sections of primary ESCC tissues. Scale bars: 40 μm. (C) Kaplan–Meier curves for overall survival rates of 143 ESCC patients according to the cytoplasmic (left) and nuclear (right) expression levels of TIA1 protein. The log-rank test was used for statistical analysis. Differences resulting in values of P < 0.05 are considered statistically significant.
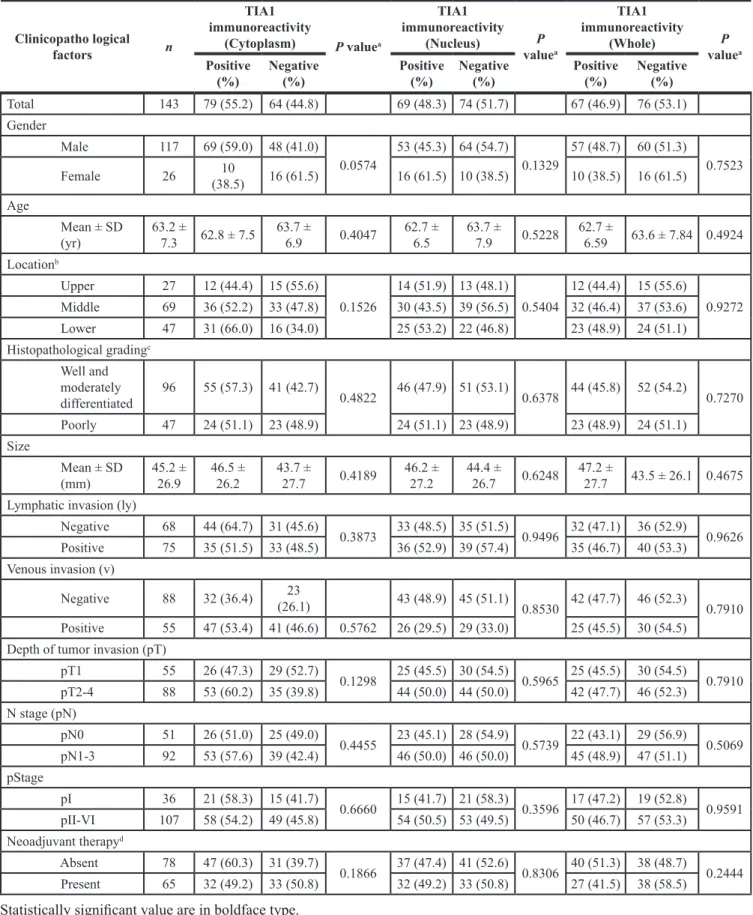
Table 1: Association between clinicopathological characteristics and TIA1 expression
Clinicopatho logical factors n TIA1 immunoreactivity (Cytoplasm) P valuea TIA1 immunoreactivity (Nucleus) P valuea TIA1 immunoreactivity (Whole) P valuea Positive(%) Negative (%) Positive (%) Negative (%) Positive (%) Negative (%)
Total 143 79 (55.2) 64 (44.8) 69 (48.3) 74 (51.7) 67 (46.9) 76 (53.1) Gender Male 117 69 (59.0) 48 (41.0) 0.0574 53 (45.3) 64 (54.7) 0.1329 57 (48.7) 60 (51.3) 0.7523 Female 26 (38.5)10 16 (61.5) 16 (61.5) 10 (38.5) 10 (38.5) 16 (61.5) Age Mean ± SD (yr) 63.2 ± 7.3 62.8 ± 7.5 63.7 ± 6.9 0.4047 62.7 ± 6.5 63.7 ± 7.9 0.5228 62.7 ± 6.59 63.6 ± 7.84 0.4924 Locationb Upper 27 12 (44.4) 15 (55.6) 0.1526 14 (51.9) 13 (48.1) 0.5404 12 (44.4) 15 (55.6) 0.9272 Middle 69 36 (52.2) 33 (47.8) 30 (43.5) 39 (56.5) 32 (46.4) 37 (53.6) Lower 47 31 (66.0) 16 (34.0) 25 (53.2) 22 (46.8) 23 (48.9) 24 (51.1) Histopathological gradingc Well and moderately differentiated 96 55 (57.3) 41 (42.7) 0.4822 46 (47.9) 51 (53.1) 0.6378 44 (45.8) 52 (54.2) 0.7270 Poorly 47 24 (51.1) 23 (48.9) 24 (51.1) 23 (48.9) 23 (48.9) 24 (51.1) Size Mean ± SD (mm) 45.2 ± 26.9 46.5 ± 26.2 43.7 ± 27.7 0.4189 46.2 ± 27.2 44.4 ± 26.7 0.6248 47.2 ± 27.7 43.5 ± 26.1 0.4675 Lymphatic invasion (ly)
Negative 68 44 (64.7) 31 (45.6) 0.3873 33 (48.5) 35 (51.5) 0.9496 32 (47.1) 36 (52.9) 0.9626 Positive 75 35 (51.5) 33 (48.5) 36 (52.9) 39 (57.4) 35 (46.7) 40 (53.3) Venous invasion (v) Negative 88 32 (36.4) (26.1)23 43 (48.9) 45 (51.1) 0.8530 42 (47.7) 46 (52.3) 0.7910 Positive 55 47 (53.4) 41 (46.6) 0.5762 26 (29.5) 29 (33.0) 25 (45.5) 30 (54.5)
Depth of tumor invasion (pT)
pT1 55 26 (47.3) 29 (52.7) 0.1298 25 (45.5) 30 (54.5) 0.5965 25 (45.5) 30 (54.5) 0.7910 pT2-4 88 53 (60.2) 35 (39.8) 44 (50.0) 44 (50.0) 42 (47.7) 46 (52.3) N stage (pN) pN0 51 26 (51.0) 25 (49.0) 0.4455 23 (45.1) 28 (54.9) 0.5739 22 (43.1) 29 (56.9) 0.5069 pN1-3 92 53 (57.6) 39 (42.4) 46 (50.0) 46 (50.0) 45 (48.9) 47 (51.1) pStage pI 36 21 (58.3) 15 (41.7) 0.6660 15 (41.7) 21 (58.3) 0.3596 17 (47.2) 19 (52.8) 0.9591 pII-VI 107 58 (54.2) 49 (45.8) 54 (50.5) 53 (49.5) 50 (46.7) 57 (53.3) Neoadjuvant therapyd Absent 78 47 (60.3) 31 (39.7) 0.1866 37 (47.4) 41 (52.6) 0.8306 40 (51.3) 38 (48.7) 0.2444 Present 65 32 (49.2) 33 (50.8) 32 (49.2) 33 (50.8) 27 (41.5) 38 (58.5)
Statistically significant value are in boldface type.
aP value are from χ2 or Fisher’s exact test and were statistically significant at < 0.05.
bUpper, cervical + upper thoracic esophagus; Middle, mid-thoracic esophagus; Lower, lower thoracic + abdominal esophagus. cWell, well differentiated SCC; Moderate, moderate differentiated SCC; Poorly, poorly differentiated SCC.
Table 2: Cox proportional hazard regression analysis for overall survival
UnivariateMultivariatea
Model 1 Model 2 Model 3 Hazard
ratio 95% confidence interval P value P value P value P value Gender
Male versus Female 1.04 0.5502−2.1854 0.9058 0.7848 – –
Age
> 65 yr versus < 65 yr 1.07 0.6335−1.7892 0.8029 0.6317 – –
Histopathological grading Poorly versus Well-moderately
differentiated 1.16 0.6758−1.9660 0.5733 0.6501 – –
Size
> 40 versus < 40 1.64 0.9798−2.7823 0.0597 0.4626 – –
Lymphatic invasion
Positive versus Negative 2.06 1.2200−3.5765 0.0066 0.1544 0.1912 –
Venous invasion
Positive versus Negative 1.69 1.0044−2.8334 0.0481 0.8674 0.9900 –
Depth of tumor invasion (pT)
pT2-3 versus pT1 3.91 2.0659−8.2066 < 0.0001 0.0192 0.0195 0.0044
N stage (pN)
pN1-3 versus pN0 4.70 2.3546−10.7289 < 0.0001 0.0013 0.0020 0.0007
Neoadjuvant chemotherapy
Positive versus Negative 1.84 1.0893−3.1287 0.0226 0.4305 0.2573 –
TIA1 immunoreactivity in the cytoplasm
Positive versus Negative 2.84 1.1619−5.2878 0.0002 0.0059 0.0033 0.0024
TIA1 immunoreactivity in the nucleus
Positive versus Negative 1.20 0.7149−2.0146 0.4913 - – –
Note: Statistically significant value are in boldface type.
aModel 1, all factors excluding TIA1 immunoreactivity in the nucleus model were included; Model 2, factors whose p-value < 0.05 in the univariate analysis were included;
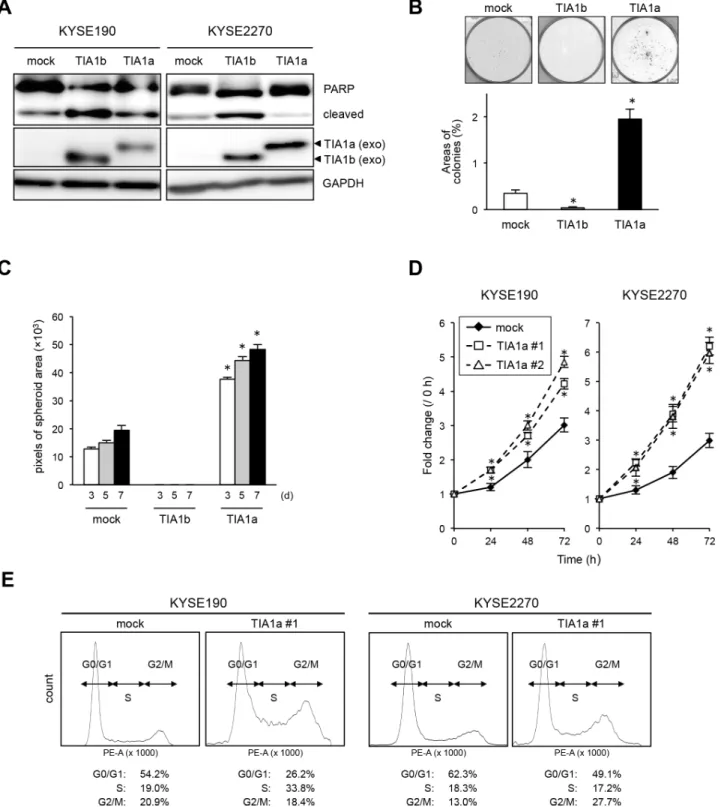
expressing relatively lower levels of endogenous TIA1 to determine the effects of exogenously expressed TIA1 isoforms. Notably, PARP cleavage was pronounced only in TIA1b-overexpressing cells (Figure 4A). Colony formation assays revealed that TIA1a-expressing cells formed more colonies than control and TIA1b-expressing cells (Figure 4B). Anchorage-independent in vitro 3D cell culture showed that exogenously expressed TIA1a accelerated spheroid formation, while exogenously expressed TIA1b inhibited spheroid formation (Figure 4C). Furthermore, higher Ki-67 expression was observed in cells exogenously expressing TIA1a, compared with cells lacking exogenous TIA1a expression (Supplementary Figure S4B). These results indicate the distinct functions of TIA1a and TIA1b in ESCC cells: TIA1a promotes dependent and anchorage-independent cell proliferation, while TIA1b does not. These distinct functions of two isoforms were partially supported by knockdown experiments using isoform-specific siRNAs even though these siRNAs showed limited specificity and efficiency (Supplementary Figure S5A). In comparison with depletion of TIA1b, anchorage-dependent cell proliferation was more effectively suppressed by depletion of TIA1a with an increased p21WAF1/Cip1 protein level and extensive cleavage
of PARP (Supplementary Figure S5A, S5B).
To determine the chronic effects of each TIA1 isoform on ESCC cell proliferation in vitro, we established stable transfectants expressing FLAG-tagged TIA1a or TIA1b protein using KYSE190 and KYSE2270 cells. Stable expression of TIA1a increased cell proliferation compared with control cells (Figure 4D). Consistent with the observations in the transient transfection experiments, stable expression of TIA1b facilitated cell death in most cell lines during isolation and subculture after transfection of the construct. FACS analysis indicated an accumulation of cells in S and G2–M phase and a decrease in G0–G1 phase cells in TIA1a-expressing cells compared with control cells (Figure 4E). Taken together, these results suggest that TIA1a contributes to the anchorage-dependent and anchorage-inanchorage-dependent growth of ESCC cells in vitro.
Identification of putative target mRNAs for cytoplasmic TIA1
We further investigated the molecular mechanisms of cytoplasmic TIA1-promoted ESCC cell growth. Cytoplasmic TIA1 was shown to bind to transcripts through their 5′ and/or 3′ untranslated regions (UTRs) and to alter their localization, stability and/or translation [11, 16–21]. Therefore, we screened putative TIA1-binding mRNAs using ribonucleoprotein immunoprecipitation (RIP), which was conducted using lysates prepared from the cytoplasm and anti-TIA1 antibody, followed by microarray analysis chip) or massive-parallel sequencing (RIP-seq) in KYSE180 cells. We identified 2,679 mRNAs
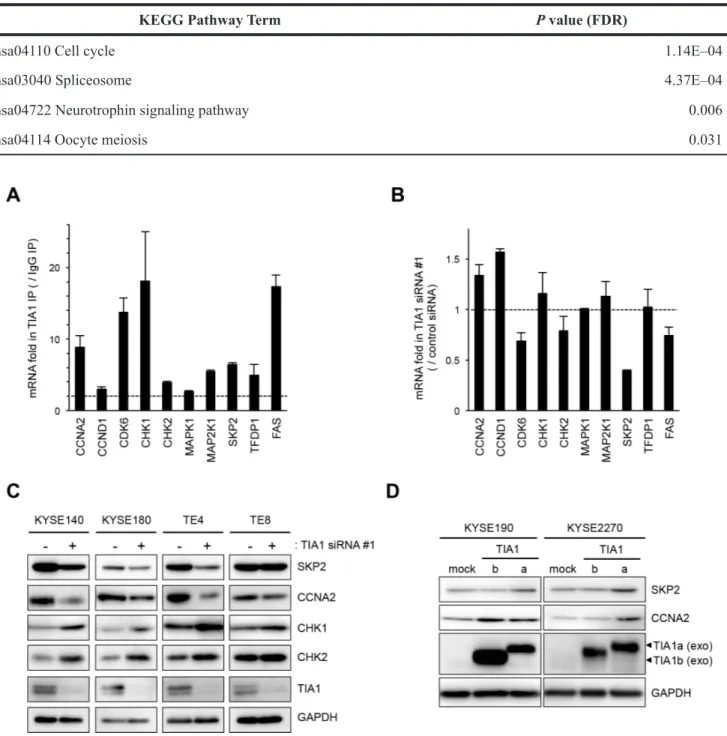
whose enrichment in TIA1 immunoprecipitates differed by > 2.5-fold compared with that of GAPDH mRNA in both RIP-chip and RIP-seq (Supplementary Table S3). Gene Ontology (GO) analysis using these 2,679 mRNAs ranked ‘mitotic cell cycle’ (P = 6.04E–14) and ‘cell cycle’ (P = 4.23E–11) as the two top biological processes (Supplementary Table S4). Pathway analysis using the Kyoto Encyclopedia of Genes and Genomes (KEGG) database with 2,679 mRNAs also ranked ‘cell cycle’ (P = 1.14E–14) as the most significant functional pathway (Table 3). Of the top 207 transcripts annotated as ‘cell cycle’ by GO analysis (Supplementary Table S5), we focused on nine well-known cell cycle regulators (CCNA2, CCND1, CDK6, CHK1, CHK2, MAPK1, MAP2K1, SKP2, and TFDP1) for further analyses, due to their known functions in cancers. The binding of these genes with TIA1 protein was successfully validated by RIP followed by qPCR; their affinities were similar to the known TIA1-binding transcript FAS mRNA (Figure 5A and Supplementary Figure S6A) [22]. The binding of each TIA1 isoform to these candidate targets was assessed using exogenously expressed each FLAG-tagged TIA1 isoform in HEK293 cells (Supplementary Figure S7A). TIA1a showed more potent binding to each mRNA than TIA1b, although both isoforms bound to all of the mRNAs we analyzed (Supplementary Figure S7B).
To investigate the consequences of the binding between TIA1 and these nine genes in ESCC cells, the effects of TIA1 knockdown on the levels of these mRNAs and FAS mRNA were examined. TIA1 knockdown did not significantly influence the levels of most of these mRNAs, although SKP2 mRNA levels decreased moderately (Figure 5B and Supplementary Figure S6B). In those nine genes, the effects of TIA1 knockdown on the levels of the proteins encoded by the SKP2, CCNA2, CHK1 and CHK2 mRNAs were assessed. Compared with control siRNA-treated cells, TIA1 siRNA-treated KYSE140, KYSE180 and TE4 cells showed lower levels of SKP2 and CCNA2 proteins and higher levels of CHK1 and CHK2 proteins (Figure 5C). Since SKP2 and CCNA2 are known to be implicated in the pathogenesis of various cancers as oncogenes (23–27), the effects of each TIA1 protein isoform on the SKP2 and CCNA2 protein levels were investigated using cells transiently expressing each isoform via retroviral infection. Cells exogenously expressing TIA1a showed higher levels of SKP2 and CCNA2 protein compared with control cells. In contrast, cells exogenously expressing TIA1b did not show any increase in SKP2 protein, although KYSE190 cells expressing TIA1b showed higher levels of CCNA2 protein (Figure 5D). The increased SKP2 mRNA level was observed in cells exogenously expressing TIA1a but not in cells exogenously expressing TIA1b, whereas the CCNA2 mRNA level was not changed in either cells exogenously expressing TIA1a or TIA1b (Supplementary Figure S6C).
Binding and functional association between TIA1 and cancer-associated mRNAs
The binding between TIA1 protein and SKP2 and CCNA2 mRNAs was further analyzed by pulldown assays using biotinylated partial SKP2 and CCNA2 mRNA
fragments spanning the 5′ UTR, open reading frame (ORF), or 3′ UTR in cytoplasmic lysates prepared from KYSE180 cells (Figure 6A). SKP2 mRNA bound to TIA1 through its ORF and 3′ UTR, while CCNA2 mRNA bound to TIA1 through its 5′ UTR and ORF. Previous studies showed that the binding of RBPs with the 5′ UTRs of mRNAs alters their
Figure 2: Subcellular distribution of the TIA1 isoforms. (A) Schematic structures of the TIA1a and TIA1b protein isoforms with and without 11 amino acids, translated from the TIA1-v2 and TIA1-v1 transcripts, respectively. Both isoforms include three RNA recognition motifs (RRM) and a carboxyl-terminal glutamine-rich domain (Q-rich domain). Numbers indicate amino acid residues corresponding to each TIA1 isoform. (B) Subcellular distribution of endogenous TIA1 in ESCC cells. Cytoplasmic and nuclear fractions were prepared from KYSE140, KYSE180, TE4 and TE8 cells. Amounts of TIA1, β-tubulin (cytoplasmic marker) and hnRNPC1/C2 (nuclear marker) were measured by western blot. The intensities of specific bands corresponding to the TIA1 isoforms were measured with a densitometer and are presented as ratios in the inset. (C) The subcellular distribution of exogenously expressed TIA1 isoforms. Cytoplasmic and nuclear fractions were prepared from KYSE2270 cells stably transfected with mock-, TIA1a- or TIA1b-expressing constructs. Amounts of exogenous (exo) and endogenous (end) TIA1 isoforms (arrowheads), β-tubulin (cytoplasmic marker) and hnRNPC1/C2 (nuclear marker) were measured by western blot analysis. (D) Representative images of exogenously expressed FLAG-tagged TIA1 isoforms in KYSE2270 cells detected by FIC using anti-FLAG antibody (green). Nuclei were counterstained with DAPI (blue). Scale bars: 20 μm.
Figure 3: Effects of TIA1 knockdown on cell proliferation. (A) KYSE140, KYSE180, TE4 or TE8 cells were transfected with each 10 nM TIA1-specific or control siRNA for 48 h, and the TIA1 mRNA expression levels were evaluated by qPCR using GAPDH mRNA as an endogenous control. The values are expressed as fold changes (mean ± SD, n = 3) compared with the respective values in control siRNA-transfected cells. *significantly different from the control value by Student’s t test (P < 0.05). (B) Effectiveness of siRNA transfection. KYSE140, KYSE180, TE4 or TE8 cells were treated as described in (A), and the expression levels of TIA1 protein were evaluated by western blot analysis using GAPDH as a loading control. (C) KYSE140, KYSE180, TE4 or TE8 cells were transfected with each 10 nM TIA1-specific or control siRNA for 24 h, and cellular proliferation was measured using a WST assay at the indicated times. The values are expressed as fold changes (mean ± SD, n = 4) compared with the respective values in control cells (0 h). *significantly different from the control value by Student’s t test (P < 0.05). (D) Representative results of cell cycle analysis. After KYSE140 or TE4 cells were treated with 10 nM TIA1-specific or control siRNA for 48 h, then the cells were stained with PI and subjected to FACS analysis. Raw data were quantified for cell cycle analysis by FACSVerse software. (E) KYSE140, KYSE180, TE4 and TE8 cells were transfected with 10 nM TIA1-specific or control (-) siRNA for 48 h. Levels of caspase-3, caspase-7, PARP, p21WAF1/Cip1, p27Kip1 and TIA1 proteins were measured by western blot analysis using GAPDH as a loading control.
Figure 4: TIA1a promotes cell proliferation in ESCC cells. (A) KYSE190 and KYSE2270 cells were transiently infected with a mock, TIA1a-, or 1b-expressing retroviruses, and the levels of PARP and exogenous TIA1 (exo) isoforms were measured by western blot analysis using GAPDH as a loading control. (B) KYSE190 cells transiently infected with either a mock-, pTIA1[v1]-FLAG- or pTIA1[v2]-FLAG-expressing retrovirus (1,000 cells/well) were plated in six-well plates and treated with 0.5 mg/mL G418 for two weeks. The colonies in each well were stained with crystal violet, and the colony areas were calculated using ImageJ software. *significantly different from the control value by Student’s t test (P < 0.05). (C) For spheroid formation assay, KYSE190 cells transiently transfected with mock or each TIA1 isoform were seeded in ultra-low attachment 96-well round bottom plates and incubated at 37°C for the indicated times (d, days). The areas of spheroids were determined as described in the Materials and Methods section (mean ± SD, n = 8). *significantly different from the control value by Student’s t test (P < 0.05). (D) The number of viable cells of each stable transfectant was assessed using a WST assay for the indicated times. The values are expressed as fold changes (mean ± SD, n = 4) compared with the respective control values (0 h). *, significantly different from the control value by Student’s t test (P < 0.05). (E) Representative results of FACS analysis using stable transfectants. The raw data were quantified for cell cycle analysis using FACSVerse software.
translation, while their binding with the 3′ UTRs of mRNAs changes the stability of these transcripts [16, 17]. In an mRNA decay assay using KYSE180 cells, TIA1 knockdown decreased the stability of SKP2 mRNA but did not alter that of CCNA2 mRNA (Figure 6B). Stable overexpression of TIA1a increased the stability of SKP2 mRNA in KYSE190 and KYSE2270 cells (Supplementary Figure S8A). In an mRNA decay assay using KYSE140 and KYSE180 cells transfected with reporter constructs containing the coding sequence (CDS) of the firefly luciferase gene (Luc2) with the 3′ UTR of SKP2 or Luc2 alone, TIA1 knockdown decreased the Luc2 mRNA expression level (Figure 6C and Supplementary Figure S8B). In an mRNA decay assay using cells transfected with the expression construct containing FLAG-tagged SKP2 CDS, on the other hand, TIA1 knockdown did not change the FLAG-tagged SKP2 mRNA expression level (Supplementary Figure S8C). Those results suggest that TIA1 increases the SKP2 mRNA stability through binding to its 3′ UTR. In ESCC cells, TIA1 depletion did not affect the change of exogenously expressed FLAG-tagged CCNA2 protein level after addition of cycloheximide (Supplementary Figure S9A). In the polysome profiling assay using KYSE180 cells, TIA1 depletion caused a shift in CCNA2 mRNA from heavy to light polysomal fractions (Figure 6D and Supplementary Figure S9B). Those results suggest that TIA1 reduction induced decreased translation initiation of CCNA2 mRNA without the stability of CCNA2 protein, although binding site of TIA1 to CCNA2 mRNA necessary for this translation promoting effect remains undetermined.
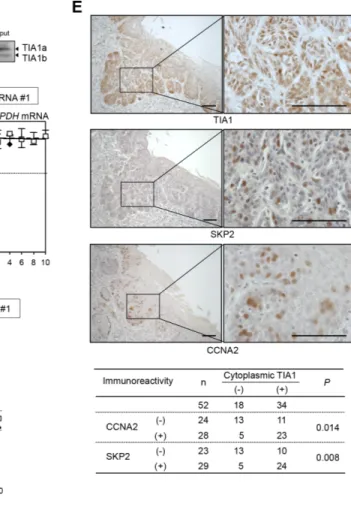
The correlation between the TIA1 and SKP2/CCNA2 protein levels was tested in ESCC tumors. In 52 tumors for which serial sections were available, IHC revealed that the expression levels of SKP2 and CCNA2 proteins in tumor cells correlated positively with the cytoplasmic TIA1 expression level (Figure 6E) and tended to be associated with worse overall survival (Supplementary Figure S10A and S10B), although CCNA2 immunoreactivity did not reach a statistically significant level. In addition silencing of either SKP2 or CCNA2 in stable TIA1a-transfectants inhibited anchorage-dependent and anchorage-independent cell proliferations (Supplementary Figure S11). These results suggest that overexpressed cytoplasmic TIA1 promotes ESCC tumorigenesis at least partly through its binding with SKP2 and CCNA2 mRNAs and induction of SKP2 and CCNA2 protein overexpression.
DISCUSSION
To our knowledge, this study is the first to demonstrate the clinical and functional significance of the TIA1 protein in ESCC tumorigenesis. Previously, a few reports described the expression of TIA1 in human carcinomas. The overexpression of TIA1 transcript has been reported in hepatocellular carcinoma tissues compared with paired adjacent non-tumor tissues using multiple samples [13]. In contrast, Izquierdo and his colleague
showed the downregulation of the TIA1 protein in a subset of epithelial tumors, relative to normal tissues [14, 28]. Using a larger set of human ESCC cases, we demonstrated that TIA1 is overexpressed and ectopically localized to the cytoplasm, and that cytoplasmic TIA1 immunoreactivity is an independent prognosticator of overall survival. In addition, we demonstrated the oncogenic activity of TIA1, particularly TIA1a, and its molecular mechanisms, at least in part, using a series of experiments in ESCC cells. Our results suggest that TIA1 works as an ESCC oncogene and is likely to be a marker of malignant potential as well as a possible therapeutic target for this tumor type.
Most RBPs, including TIA1, Hu-antigen R (HuR) and AUF1, are expressed predominantly in the nucleus and shuttle between the nucleus and cytoplasm. Their cytoplasmic abundance is substantively linked to their effects on target mRNAs, and dysfunction in their subcellular distribution may have pathological consequences [29]. Indeed, cytoplasmic HuR expression has been shown to be associated with malignant clinicopathological features and poor prognosis in ESCC, indicating that ectopically localized HuR is involved in cancer-promoting RNA metabolism and contributes to the progression of ESCC [30]. In contrast, the cytoplasmic localization of TIA1 protein in epithelial tumor cells has not been well analyzed, although the nucleo-cytoplasmic shuttling of TIA1 under stress conditions has been described in some cells [31]. Because TIA1 overexpression and cytoplasmic localization are commonly observed in various squamous cell carcinomas, cancer-promoting effects of TIA1 through cytoplasmic localization might be cell lineage-specific.
Until now, each TIA1 isoform was considered to have equivalent RNA binding properties and subcellular distribution because these isoforms share most known motifs. Thus, most previous studies used the shorter TIA1b isoform to analyze TIA1 function by exogenously introducing recombinant constructs [11, 28]. In this study, we found that TIA1a and TIA1b exert distinct effects on ESCC cell proliferation: TIA1a promotes anchorage-dependent and anchorage-inanchorage-dependent cell proliferation, whereas TIA1b tends to inhibit cell proliferation and/or induces cell death. Therefore, the oncogenic activities of TIA1 we found are not inconsistent with previous reports demonstrating that TIA1 works as a tumor suppressor [12, 14, 28]. Because a larger fraction of TIA1a localizes to the cytoplasm, compared with TIA1b, and because exogenously introduced each isoform shows different mRNA binding affinities, TIA1a may function as an oncogene in ESCC through localizing to the cytoplasm and contributing to specific aspects of RNA metabolism. Although how transcription of those isoforms were regulated differentially in normal and tumor cells and how the 11 amino acid residues contribute to them remains unclear, the functional modification of the TIA1a isoform by focusing on the 11 amino acid residues is a potential therapeutic target for ESCC. This hypothesis is supported, in part, by recent reports showing that the expression
Table 3: Functional pathways of TIA1 target genes
KEGG Pathway Term P value (FDR)
hsa04110 Cell cycle 1.14E–04
hsa03040 Spliceosome 4.37E–04
hsa04722 Neurotrophin signaling pathway 0.006
hsa04114 Oocyte meiosis 0.031
Figure 5: Binding of TIA1 with mRNAs of putative target mRNAs and its effect on protein levels in ESCC cells. (A) Bindings between TIA1 and the nine putative target transcripts encoding cell cycle regulatory proteins identified through RIP-chip and RIP-seq (Supplementary Table S5) using anti-TIA1 antibody, as well as the known target, FAS mRNA, were validated by qPCR after RIP using KYSE180 cells. TIA1-mRNA bindings were measured by RIP followed by qPCR amplification and expressed as the enrichment of individual mRNAs in the TIA1 IP relative to an IgG IP. The data were normalized to the levels of GAPDH mRNA, an abundant mRNA that is not a target of TIA1 and that is present as a low-level co-precipitated contaminant in all IP samples. Representative results (mean ± SD, n = 3) of four independent experiments are shown. (B) Effects of TIA1 silencing on the expression of putative target mRNAs in ESCC cells. KYSE180 cells were transfected with 10 nM TIA1-specific or control siRNA for 48 h. The amounts of the 10 target mRNAs were measured by qPCR using GAPDH mRNA as an endogenous control. The values are expressed as fold changes (mean ± SD, n = 3) compared with the respective values in control siRNA-transfected cells. (C) Effects of TIA1 silencing on the expression of proteins encoded by the putative target genes in ESCC cells. KYSE140, KYSE180, TE4, or TE8 cells were transfected with 10 nM TIA1-specific or control (−) siRNA for 48 h. The levels of SKP2, CCNA2, CHK1, CHK2 and TIA1 proteins were measured by western blot analysis using GAPDH as a loading control. (D) Effects of exogenous overexpression of each TIA1 isoform on the expression of proteins encoded by putative target genes in ESCC cells. Lysates were prepared from KYSE190 or KYSE2270 cells overexpressing TIA1. The levels of SKP2, CCNA2 and exogenous TIA1 proteins were measured by western blot analysis using GAPDH as a loading control.
Figure 6: Differing effects of TIA1 on the SKP2 and CCNA2 genes in ESCC cells. (A) Biotinylated transcripts from the SKP2 5′ UTR, the SKP2 ORF, the SKP2 3′ UTR, the CCNA2 5′ UTR, the CCNA2 ORF and the CCNA2 3′ UTR, as well as a biotinylated fragment of the GAPDH 3′ UTR (negative control), were prepared. Bindings between TIA1 and each fragment were tested by biotin pulldown assays using cell lysates extracted from KYSE180 cells. The amounts of TIA1 in pulldown samples were determined by western blot analysis using an anti-TIA1 antibody. Similar results were obtained in three independent experiments. (B) Effects of TIA1silencing on the stability of SKP2 and CCNA2 mRNA were determined in KYSE180 cells transfected with control siRNA or TIA1 siRNA. After treatment with 2 µg/mL actinomycin D, the amounts of SKP2 (left), CCNA2 (middle) and GAPDH (right) mRNAs in cells were measured by qPCR and normalized to 18S rRNA levels. The data (mean ± SD, n = 3) are expressed as percentages of SKP2, CCNA2 or GAPDH mRNA levels before exposure to actinomycin D (time 0). *significantly different from the control value by Student’s t test (P < 0.05). (C) TIA1 increases the stability of SKP2 mRNA through its 3′ UTR. The pmirGLO-SKP2 plasmid expressing the chimeric reporter transcript bearing the Luc2 CDS linked to the SKP2 3′ UTR or control plasmid (pmirGLO) was co-transfected with control siRNA or TIA1 siRNA into KYSE180 cells for 48 h. After treatment with 2 µg/mL actinomycin D, the amounts of Luc2 mRNA was measured by qPCR and normalized to 18S rRNA levels. Data (mean ± SD, n = 3) are expressed as percentages of luciferase mRNA level before exposure to actinomycin D (time 0). *significantly different from the control value by Student’s t test (P < 0.05). (D) Relative polyribosome distribution of the CCNA2 mRNA (left) and the housekeeping GAPDH mRNA (right) in TIA1 knockdown cells and control KYSE180 cells was analyzed by sucrose gradient fractionation. From left to right, percentages of the total mRNA in fractions lacking ribosomes or ribosome subunits (fractions 1 and 2), fractions containing ribosome subunits or single ribosomes (fractions 3 to 7), and fractions spanning polysomes of increasing molecular weights (fractions 8 to 16) were shown (see Supplementary Figure S9C). Representative data are from three independent experiments. (E) IHC detection of TIA1, SKP2 and CCNA2 in primary ESCC tissues. Serial sections of ESCC were subjected to immunohistochemistry with goat anti-TIA1 (top), rabbit anti-SKP2 (middle) or mouse monoclonal anti-CCNA2 (lower) antibodies. Scale bars: 40 μm.
pattern of each TIA1 isoform is defined by tissue type and that TIA1b has greater splicing stimulatory activity than TIA1a [11]. Isoform-specific subcellular localization and influences on the mRNA binding affinities of AUF1, which has four isoforms, have also been reported [32–35].
RBPs coordinate a set of multiple functionally related genes by orchestrating their splicing, export, stability, localization and translation in cellular processes [36]. In ESCC cells, over-representation of specific pathways in the TIA1-associated gene set revealed that TIA1 coordinates the expression of a gene cluster encoding cell cycle regulators. This in silico prediction corresponded with the results of our in vitro functional experiments and with the clinicopathological significance of TIA1 immunoreactivity in ESCC cases, supporting our hypothesis that TIA1 is a possible therapeutic target for simultaneously and efficiently manipulating various target genes/pathways contributing to esophageal carcinogenesis.
Most of the specific cis elements that affect mRNA decay and/or translation of a subset of transcripts are found in the 5′ and 3′ UTRs, and the most well-known of these motifs are the adenine-uridine-rich element sequences (AREs) [37–39]. TIA1 was reported to be a negative posttranscriptional modulator through its bindings with AREs by stimulating assembly of the translational silencer complex that was routed to discrete cytoplasmic SGs [40]. Because some RBPs can act as both positive and negative posttranscriptional regulators [41–44], the finding that the expression levels of SKP2 and CCNA2 proteins increased through bindings between TIA1 protein and their transcripts was not surprising. Our results suggested that TIA1 binds to the 3′ UTR of SKP2 mRNA, resulting in the attenuation of mRNA decay, while TIA1 binds to the 5′ UTR and/or ORF of CCNA2 mRNA, resulting in the increased translation initiation without acquisition of mRNA. Because previous studies predicted the presence of TIA1 binding motifs in the 3′ UTR of SKP2 and 5′ UTR of CCNA2 mRNAs [18], TIA1 might be a suppressor of mRNA decay and translational inducer of SKP2 and CCNA2, respectively. Further elucidation of the precise mechanisms by which TIA1 increases/decreases the expression of a set of genes will reveal novel physiological and pathophysiological functions of TIA1.
MATERIALS AND METHODS
Cell lines and primary tissue samples
In total, 45 ESCC cell lines were used, 34 of which belonged to the KYSE series established from surgically resected tumors [45] obtained from Dr. Yutaka Shimada or provided by the Japanese Collection of Research Bioresources (JCRB, Ibaraki, Japan). Ten were from the TE series provided by the Cell Bank, RIKEN BioResource Center (Tsukuba, Japan), and the T.T cell line was provided by JCRB.
ESCC tumor samples were obtained from 143 patients with histologically proven primary ESCC who underwent esophagectomy (potentially curative R0 resection) at the Kyoto Prefectural University of Medicine Hospital (Kyoto, Japan) between 1998 and 2011. The samples were fixed with formalin for 24 h and then embedded in paraffin. Among the patients, 65 received preoperative neoadjuvant therapy with FP (Table 1, Supplementary Table S1), and 39 received postoperative adjuvant chemotherapy with low-dose FP [5-fluorouracil (250–500 mg/body/day) plus cisplatin (10 mg/body/day)] and oral fluoropyrimidine [5-fluorouracil (150–200 mg/ body/day) or UFT (300–400 mg/body/day)] for three years [46]. None had synchronous or metachronous multiple cancers in other organs. Relevant clinical and survival data were available for all patients. In this series, all M1 tumors had distant lymph node metastases but no organ metastasis. Disease stage was defined in accordance with the International Union Against Cancer tumor-lymph node-metastases (TNM) classification [47]. The median follow-up period for the surviving patients was 40.5 months (range, 0.16 to 156.9 months). Additional tissue samples, including normal and precancerous regions of the esophagus and non-esophageal SCC, were also obtained from patients treated at Tokushima University. Formal written consent was obtained from all patients after approval of all aspects of these studies by the local ethics committee (Kyoto Prefectural University of Medicine and Tokushima University).
Antibodies
The antibodies used in this study are listed in Supplementary Table S6.
Immunohistochemical staining and scoring
Paraffin-embedded sections (4-µm thick) were subjected to IHC staining for each protein using the avidin–biotin-peroxidase method. Briefly, antigen retrieval was performed by heating dewaxed and dehydrated sections in Dako Real Target Retrieval Solution (DAKO, Glostrup, Denmark) at 98°C for 30 min. Then, the sections were treated with 0.3% H2O2 for 30 min to quench the endogenous peroxidase and treated with protein blocker. Next, the sections were incubated with primary antibodies at 4°C overnight. After incubation with secondary antibodies, an R.T.U. VECTASTAIN Universal Quick Kit (Vector Laboratories; Burlingame, CA, USA) and a Universal LSAB™+ Kit/HRP (DAKO) were used for colour development with diaminobenzidine tetrahydrochloride. The sections were counterstained with Mayer’s hematoxylin, dehydrated in ascending grades of ethanol and mounted.
Tumor tissues were compared with paired non-tumor tissues. The percentage of the total cell population expressing the target protein and the overall staining intensity in tumor cells were evaluated for each case at
200× magnification. Expression of a target protein was considered positive when over 10% of the tumor cells showed strong or diffuse staining. The nuclear TIA1 staining intensity was considered positive (+) when the cell showed staining that was stronger than that seen in non-tumor esophageal epithelial cells in the parabasal layer, whereas the intensity of cytoplasmic TIA1 staining was considered positive (+) when the cells more or less showed staining. All stained slides were blindly and independently evaluated by two investigators without knowledge of the clinicopathological data, and any discordant result was settled by using a conference microscope.
Quantitative real-time PCR
One microgram of total RNA was reverse-transcribed using the PrimeScript RT reagent kit (TaKaRa, Otsu, Japan). Transcript levels were quantified using the specific primer sets (Supplementary Table S7) and SYBR Green Master Mix (Applied Biosystems, Waltham, MA, USA), as described elsewhere [48]. GAPDH mRNA and 18S rRNA levels were also measured and used as internal controls for normalization.
Western blot analysis
Whole-cell lysate preparation and western blot analysis were performed as previously described [49]. Subcellular components were isolated using a NE-PER Nuclear Protein Extraction Kit (Thermo Fisher Scientific, Waltham, MA, USA) according to the manufacturer’s instructions.
Fluorescent immunocytochemical staining
Cells were cultured on chamber slides, fixed in 4% paraformaldehyde for 30 min at room temperature, permeabilised with 0.1% Triton X-100 in phosphate-buffered saline (PBS) for 1 min and treated with blocking reagent (1% BSA) for 30 min. After the cells were incubated with primary antibodies for 1 h at room temperature, the bound antibody was visualized using fluorescence-labelled secondary antibodies. After mounting using ProLong Gold Antifade Reagent with 4′, 6-diamidino-2-phenylindole (DAPI), the cells were observed under a fluorescence microscope (LSM510; Carl Zeiss, Oberkochen, Germany).
Plasmid construction
The full coding sequences of human TIA1 variant 1 (NM_022037), TIA1 variant 2 (NM_022173), SKP2 (NM_005983), and CCNA2 (NM_001237) were amplified by PCR (Supplementary Table S7) using cDNA prepared from KYSE140 cells. These coding sequences were cloned into the mammalian expression vector pCMV-3Tag1A (Stratagene, La Jolla, CA, USA) to append the FLAG
epitope to their NH2 termini. FLAG-tagged TIA1 variants were amplified by PCR (Supplementary Table S7) and cloned into the retroviral vector pMXs-Neo (Cell Biolabs, San Diego, CA, USA). The 3′ UTR of SKP2 were amplified by PCR (Supplementary Table S7) using cDNA prepared from KYSE140 cells, and ligated into the pmirGLO vector (Promega, Madison, WI, USA) to generate the plasmid expressing a chimeric RNA that contains the Luc2 CDS linked to the SKP2 3′ UTR (pmirGLO-SKP2).
Stable transfection experiments
To establish ESCC cell lines stably overexpressing each TIA1 isoform, cells were infected with each TIA1 variant-expressing retroviruses and selected by treatment with 0.5 mg/mL G418 for four weeks. Control cells were obtained using retroviruses obtained from the empty pMXs-Neo vector that were packaged in PLAT-A cells. Clones were subsequently isolated, subcultured and tested for TIA1 overexpression by western blot and FIC.
Transient transfection experiments
Various siRNAs targeting mRNAs of TIA1 (#1-3), each TIA1 isoform, SKP2, and CCNA2, as well as control siRNAs (Supplementary Table S8), were transfected separately into ESCC cells at a final concentration of 10 nM using Lipofectamine RNAiMax reagent (Invitrogen, Carlsbad, CA, USA). A control plasmid (pCMV-3Tag1A), a pCMV-3Tag1A-containing FLAG-tagged TIA1 variant 1 (pTIA1[v1]-FLAG), a pCMV-3Tag1A-containing FLAG-tagged TIA1 variant 2 (pTIA1[v2]-FLAG), and pmirGLO-containing SKP2 3′ UTR (pmirGLO-SKP2) were transfected separately into ESCC cell lines or HEK293 cells using Lipofectamine-2000 reagent (Invitrogen).
Cell proliferation and cell cycle analyses
Cell growth was assessed at the indicated time after cell seeding (5 × 10³ cells/96-well plate) using a
water-soluble tetrazolium (WST) salt assay (Cell Counting Kit-8; Dojindo, Mashikimachi, Japan) according to the manufacturer’s instructions. The results are expressed as the mean absolute absorbance at the indicated time divided by the mean absolute absorbance of each sample cultured for 24 h after seeding.
For colony formation assays, cells infected with either mock-, pTIA1[v1]-FLAG- or pTIA1[v2]-FLAG-expressing retroviruses (1,000 cells/well) were plated in six-well plates and treated with 0.5 mg/mL G418 for two weeks. The colonies in each well were stained with crystal violet, and the areas of colonies formed were determined using ImageJ software (http://imagej.nih.gov/ij/).
For spheroid formation assays, 100 μL/well of cell suspensions at optimized densities (10,000 cells/mL) were dispensed into PrimeSurface 96-well round-bottomed plates (Sumitomo Bakelite, Tokyo, Japan). Plates were
centrifuged for 5 min at 1,000 rpm and incubated at 37°C in an atmosphere of 5% CO2. The areas of the spheroids formed were determined using ImageJ software.
Cell cycles were evaluated by FACS as described elsewhere [50]. Cell counting was performed using a FACSVerse flow cytometer (Becton Dickinson, Mountain View, CA, USA).
Ribonucleoprotein immunoprecipitation assay
Immunoprecipitation of ribonucleoprotein complexes was performed using the RiboCluster Profiler RIP-Assay kit (Medical & Biological Laboratories, Nagoya, Japan) according to the manufacturer’s protocol. Briefly, cytoplasmic lysates (500 μg protein) prepared from ESCC cells were incubated for 1 h at 4°C with 80 µL of a 50% (v/v) suspension of protein A agarose beads precoated with 15 µg of rabbit IgG1 (Medical & Biological Laboratories)
or rabbit anti-TIA1 antibody (Supplementary Table S6). After the quality and quantity of RNAs in the input lysates and the IP materials were assessed using an Agilent 2100 Bioanalyzer (Agilent Technologies, Santa Clara, CA, USA), total transcripts and immunoprecipitated transcripts were analyzed using microarray and/or RNA sequencing (RNA-seq).
Microarray data were obtained using a whole human genome microarray (8 × 60 k, Agilent Technologies), as described previously [50], and analyzed using GeneSpring 13.0 software (Agilent Technologies). All microarray data are available at the Gene Expression Omnibus (GSE71342).
To prepare the template for RNA-Seq, first- and second-strand cDNA synthesis was performed using 100 ng of RNA. This was followed by single-primer isothermal amplification using an NEBNext Ultra RNA Library Prep Kit for Illumina (New England Biolabs, Ipswich, MA, USA) according to the manufacturer’s protocol. These steps amplified polyA- and non-polyA-tailed RNAs and removed ribosomal RNA. The cDNA library was sequenced using an Illumina MiSeq instrument (Illumina). The quality of the bases was checked using the FASTQC program. Called bases were aligned to the human hg19 genome using the Tophat program, the Bowtie algorithm and Ensembl hg19 (v62) as gene model annotations, followed by genomic mapping. The aligned reads were assembled into transcripts (both known and novel) using the Cufflinks program with Ensembl hg19 (v62) transcripts as a guide. FPKM (fragments per kilobase of exon model per million mapped reads) values were calculated after fragment bias correction and normalization to total hits. The data were visualized in the UCSC genome browser. All RNA-seq data are available at the DNA Data Bank of Japan (PRJDB4086).
After mRNA expression was normalized to constitutive mRNA expression levels determined by microarray, the association of mRNAs with TIA1 was assessed by estimating the enrichment of mRNAs in TIA1 IP samples, compared with those of GAPDH mRNA, an abundant mRNA that is not a target of TIA1.
The enrichment analyses of the set of TIA1 target genes and functional pathways related to this gene set were performed using GO enrichment analysis and KEGG pathway analysis, respectively. Over-representation of specific GO and KEGG pathways in a gene set was statistically analyzed by DAVID Bioinformatics Resources 6.7 software (http://david.abcc.ncifcrf.gov/home.jsp) [51, 52]. The enrichment P-value calculation, i.e. number of genes in the list that hit a given biology class as compared to pure random chance, was performed with Benjamini and Hochberg multiple testing correction.
Biotin pulldown analysis
cDNA corresponding to each gene fragment was used as a template for the in vitro synthesis of biotinylated transcripts. The T7 RNA polymerase promoter sequence was added to the 5′ ends of all of the fragments using PCR (Supplementary Table S7). The biotinylated GAPDH 3′ UTR was prepared as previously described [49]. Biotinylated RNAs were synthesized using the MaxiScript T7 kit (Ambion, Austin, TX, USA). Whole-cell lysates (40 µg for each sample) were incubated with one of the purified biotinylated fragments (4 µg) for 1 h at room temperature. Complexes were isolated with paramagnetic streptavidin-conjugated beads (Dynabeads M280 Streptavidin; Invitrogen), and bound proteins in the pulldown materials were assayed by western blot analysis using anti-TIA1 antibody as described above.
mRNA decay assay
To measure relative mRNA stabilities in cells with normal TIA1 or reduced TIA1 levels, cultures were treated with 2 μg/mL transcriptional inhibitor, actinomycin D (Merck Millipore, Darmstadt, Germany), for the indicated times. At subsequent times, mRNA levels were measured by qPCR and normalized to 18S rRNA levels. The data are expressed as percentages of each mRNA level before exposure to actinomycin D (time zero).
Protein decay assay
To measure relative protein stabilities in cells with normal TIA1 or reduced TIA1 levels, cultures were treated with 0.1 mg/mL translational inhibitor, cycloheximide (Sigma-Aldrich, St Louis, MO, USA), for the indicated times. At subsequent times, protein levels were assayed by western blot analysis.
Sucrose gradient polyribosome fractionation
KYSE180 cells at < 80% confluence were incubated for 5 min in 0.1 mg/mL cycloheximide and then lifted in 1mL PEB lysis buffer (0.3 M NaCl, 15 mM MgCl2, 15 mM Tris-HCl, pH 7.6, 1% Triton X-100, and 0.1 mg/mL
cycloheximide) by scraping and lysed on ice for 10 min. The lysates were centrifuged at 14,000 rpm at 4°C for 10 min. The supernatant (1 mg protein) was layered onto liner 10–50% sucrose gradient. After centrifuging at 4°C for 90 min at 39,000 rpm, 500 μL fractions were collected. RNA for qPCR in each fraction was extracted with TRIzol-LS Reagent (Thermo Fisher Scientific) according to the manufacturer’s instructions.
Luciferase reporter assay
PmirGLO-SKP2 or control plasmid (pmirGLO) was transfected into ESCC cells in which endogenous TIA1 was silenced by siRNA. After 48 h, cultures were treated with 2 μg/mL actinomycin D (Merck Millipore) for the indicated times. At subsequent times, Luc2 mRNA levels were measured by qPCR and normalized to 18S rRNA levels. The data are expressed as percentages of each mRNA level before exposure to actinomycin D (time zero).
Statistical analysis
The clinicopathological variables pertaining to the corresponding patients were analyzed by using the χ2 test
or Fisher’s exact test. For survival analysis, Kaplan– Meier survival curves were constructed for groups based on univariate predictors, and differences between the groups were tested using the log-rank test. Univariate and multivariate survival analyses were performed using the likelihood ratio test of the stratified Cox proportional hazards model. Differences between subgroups were evaluated using Student’s t-test. Differences were assessed with a two-sided test and considered significant at the P < 0.05 level.
ACKNOWLEDGMENTS
We thank Hideaki Horikawa (Support Center for Advanced Medical Sciences, Institute of Biomedical Sciences, Tokushima University Graduate School, Tokushima, Japan) and Dr. Keisuke Izumi (Tokushima Bunri University) for their technical assistance.
FUNDING
This study was supported, in part, by JSPS KAKENHI Grant Numbers 24590943 (K.M) and 26293304 (I.I.), by grants from the Gastrointestinal Cancer Project funded by Nakayama Cancer Research Institute (K.M), and a collaboration with Taiho Pharmaceutical, Inc (K.M).
CONFLICTS OF INTEREST
The authors declare no conflicts of interest.
REFERENCES
1. Ferlay J, Soerjomataram I, Dikshit R, Eser S, Mathers C, Rebelo M, Parkin DM, Forman D, Bray F. Cancer incidence and mortality worldwide: sources, methods and major patterns in GLOBOCAN 2012. Int J Cancer. 2015; 136: E359–386.
2. Rustgi AK, El-Serag HB. Esophageal carcinoma. N Engl J Med. 2014; 371: 2499–2509.
3. Okines A, Cunningham D, Chau I. Targeting the human EGFR family in esophagogastric cancer. Nat Rev Clin Oncol. 2011; 8:492–503.
4. Cooper TA, Wan L, Dreyfuss G. RNA and disease. Cell. 2009; 136:777–793.
5. Wurth L, Gebauer F. RNA-binding proteins, multifaceted translational regulators in cancer. Biochim Biophys Acta. 2015; 1849:881–886.
6. Darnell RB. RNA regulation in neurologic disease and cancer. Cancer Res Treat. 2010; 42:125–129.
7. Kechavarzi B, Janga SC. Dissecting the expression landscape of RNA-binding proteins in human cancers. Genome Biol. 2014; 15:R14.
8. Audic Y, Hartley RS. Post-transcriptional regulation in cancer. Biol Cell. 2004; 96:479–498.
9. Wang J, Liu Q, Shyr Y. Dysregulated transcription across diverse cancer types reveals the importance of RNA-binding protein in carcinogenesis. BMC Genomics. 2015; 16:S5. 10. Tian Q, Streuli M, Saito H, Schlossman SF, Anderson P.
A polyadenylate binding protein localized to the granules of cytolytic lymphocytes induces DNA fragmentation in target cells. Cell. 1991; 67:629–639.
11. Izquierdo JM, Valcárcel J. Two isoforms of the T-cell intracellular antigen 1 (TIA-1) splicing factor display distinct splicing regulation activities. Control of TIA-1 isoform ratio by TIA-1-related protein. J Biol Chem. 2007; 282:19410–19417.
12. Reyes R, Alcalde J, Izquierdo JM. Depletion of T-cell intracellular antigen proteins promotes cell proliferation. Genome Biol. 2009; 10:R87.
13. Subramaniam K, Ooi LL, Hui KM. Transcriptional down-regulation of IGFBP-3 in human hepatocellular carcinoma cells is mediated by the binding of TIA-1 to its AT-rich element in the 3′-untranslated region. Cancer Lett. 2010; 297:259–268.
14. Izquierdo JM, Alcalde J, Carrascoso I, Reyes R, Ludeña MD. Knockdown of T-cell intracellular antigens triggers cell proliferation, invasion and tumour growth. Biochem J. 2011; 435:337–344.
15. Zhang T, Delestienne N, Huez G, Kruys V, Gueydan C. Identification of the sequence determinants mediating the nucleo-cytoplasmic shuttling of TIAR and TIA-1 RNA-binding proteins. J Cell Sci. 2005; 118:5453–5463.
16. Piecyk M, Wax S, Beck ARP, Kedersha N, Gupta M, Maritim B, Chen S, Gueydan C, Kruys V, Streuli M, Anderson P. TIA-1 is a translational silencer that selectively regulates the expression of TNF-alpha. Embo Journal. 2000; 19:4154–4163.
17. Wang Z, Kayikci M, Briese M, Zarnack K, Luscombe NM, Rot G, Zupan B, Curk T, Ule J. iCLIP predicts the dual splicing effects of TIA-RNA interactions. PLoS Biol. 2010; 8:e1000530.
18. López de Silanes I, Galbán S, Martindale JL, Yang X, Mazan-Mamczarz K, Indig FE, Falco G, Zhan M, Gorospe M. Identification and functional outcome of mRNAs associated with RNA-binding protein TIA-1. Mol Cell Biol. 2005; 25:9520–9531.
19. Yamasaki S, Stoecklin G, Kedersha N, Simarro M, Anderson P. T-cell intracellular antigen-1 (TIA-1)-induced translational silencing promotes the decay of selected mRNAs. J Biol Chem. 2007; 282:30070–30077.
20. Damgaard CK, Lykke-Andersen J. Translational coregulation of 5′TOP mRNAs by TIA-1 and TIAR. Genes Dev. 2011; 25:2057–2068.
21. Gottschald OR, Malec V, Krasteva G, Hasan D, Kamlah F, Herold S, Rose F, Seeger W, Hänze J. TIAR and TIA-1 mRNA-binding proteins co-aggregate under conditions of rapid oxygen decline and extreme hypoxia and suppress the HIF-1α pathway. J Mol Cell Biol. 2010; 2:345–356. 22. Izquierdo JM, Majós N, Bonnal S, Martínez C, Castelo R,
Guigó R, Bilbao D, Valcárcel J. Regulation of Fas alternative splicing by antagonistic effects of TIA-1 and PTB on exon definition. Mol Cell. 2005; 19:475–484.
23. Mori M, Mimori K, Shiraishi T, Tanaka S, Ueo H, Sugimachi K, Akiyoshi T. p27 expression and gastric carcinoma. Nat Med. 1997; 3:593.
24. Shapira M, Ben-Izhak O, Linn S, Futerman B, Minkov I, Hershko DD. The prognostic impact of the ubiquitin ligase subunits Skp2 and Cks1 in colorectal carcinoma. Cancer. 2005; 103:1336–1346.
25. Tian YF, Chen TJ, Lin CY, Chen LT, Lin LC, Hsing CH, Lee SW, Sheu MJ, Lee HH, Shiue YL, Huang HY, Pan HY, Li CF et al. SKP2 overexpression is associated with a poor prognosis of rectal cancer treated with chemoradiotherapy and represents a therapeutic target with high potential. Tumour Biol. 2013; 34:1107–1117.
26. Hershko DD. Oncogenic properties and prognostic implications of the ubiquitin ligase Skp2 in cancer. Cancer. 2008; 112:1415–1424.
27. Yasmeen A, Berdel WE, Serve H, Muller-Tidow C. E- and A-type cyclins as markers for cancer diagnosis and prognosis. Expert Rev Mol Diagn. 2003; 3:617–633.
28. Sanchez-Jimenez C, Ludena MD, Izquierdo JM. T-cell intracellular antigens function as tumor suppressor genes. Cell Death Dis. 2015; 6:e1669.
29. Shyu AB, Wilkinson MF. The double lives of shuttling mRNA binding proteins. Cell. 2000; 102:135–138.
30. Zhang C, Xue G, Bi J, Geng M, Chu H, Guan Y, Wang J, Wang B. Cytoplasmic expression of the ELAV-like protein HuR as a potential prognostic marker in esophageal squamous cell carcinoma. Tumour Biol. 2014; 35:73–80. 31. Kedersha NL, Gupta M, Li W, Miller I, Anderson P.
RNA-binding proteins TIA-1 and TIAR link the phosphorylation of eIF-2 alpha to the assembly of mammalian stress granules. J Cell Biol. 1999; 147:1431–1442.
32. Wilson GM, Lu J, Sutphen K, Sun Y, Huynh Y, Brewer G. Regulation of A + U-rich element-directed mRNA turnover involving reversible phosphorylation of AUF1. J Biol Chem. 2003; 278:33029–33038.
33. Arao Y, Kuriyama R, Kayama F, Kato S. A nuclear matrix-associated factor, SAF-B, interacts with specific isoforms of AUF1/hnRNP D. Arch Biochem Biophys. 2000; 380:228–236. 34. Inoue A, Arao Y, Omori A, Ichinose S, Nishio K, Yamamoto N,
Kinoshita Y, Mita S. Identification of S1 proteins B2, C1 and D1 as AUF1 isoforms and their major role as heterogeneous nuclear ribonucleoprotein proteins. Biochem J. 2003; 372:775–785.
35. Zucconi BE, Ballin JD, Brewer BY, Ross CR, Huang J, Toth EA, Wilson GM. Alternatively expressed domains of AU-rich element binding protein 1 (AUF1) regulate RNA-binding affinity, RNA-induced protein oligomerization, and the local conformation of bound RNA ligands. J Biol Chem. 2010; 285:39127–39139.
36. Keene JD. RNA regulons: coordination of post-transcriptional events. Nat Rev Genet. 2007; 8:533–543.
37. Ross J. mRNA stability in mammalian cells. Microbiol Rev. 1995; 59:423–450.
38. Eberhardt W, Doller A, Akool el-S, Pfeilschifter J. Modulation of mRNA stability as a novel therapeutic approach. Pharmacol Ther. 2007; 114:56–73.
39. Lopez de Silanes I, Quesada MP and Esteller M. Aberrant regulation of messenger RNA 3′-untranslated region in human cancer. Cell Oncol. 2007; 29:1–17.
40. Anderson P, Kedersha N. Stressful initiations. J Cell Sci. 2002; 115:3227–3234.
41. Brewer G. An A + U-rich element RNA-binding factor regulates c-myc mRNA stability in vitro. Mol Cell Biol. 1991; 11:2460–2466.
42. Kullmann M, Gopfert U, Siewe B, Hengst L. ELAV/Hu proteins inhibit p27 translation via an IRES element in the p27 5′UTR. Genes Dev. 2002; 16:3087–3099.
43. Mazan-Mamczarz K, Galban S, Lopez de Silanes I, Martindale JL, Atasoy U, Keene JD, Gorospe M. RNA-binding protein HuR enhances p53 translation in response to ultraviolet light irradiation. Proc Natl Acad Sci USA. 2003; 100:8354–8359.
44. Xu N, Chen CY, Shyu AB. Versatile Role for hnRNP D Isoforms in the Differential Regulation of Cytoplasmic mRNA Turnover. Mol Cell Biol. 2001; 21:6960–6971. 45. Shimada Y, Imamura M, Wagata T, Yamaguchi N, Tobe T.
cell lines. Cancer. 1992; 69:277–284.
46. Shiozaki A, Yamagishi H, Itoi H, Fujiwara H, Kikuchi S, Okamoto K, Ichikawa D, Fuji N, Ochiai T, Sonoyama T, Ueda Y. Long-term administration of low-dose cisplatin plus 5-fluorouracil prolongs the postoperative survival of patients with esophageal cancer. Oncol Rep. 2005; 13: 667–672.
47. Sobin LH, Gospodarowicz MK, Wittekind C and International Union against Cancer. (2010). TNM classification of malignant tumours. (Chichester, West Sussex, UK; Hoboken, NJ: Wiley-Blackwell).
48. Masuda K, Abdelmohsen K, Kim MM, Srikantan S, Lee EK, Tominaga K, Selimyan R, Martindale JL, Yang X, Lehrmann E, Zhang Y, Becker KG, Wang JY, et al. Global dissociation of HuR-mRNA complexes promotes cell survival after ionizing radiation. EMBO J. 2011; 30:1040–1053.
49. Akaike Y, Masuda K, Kuwano Y, Nishida K, Kajita K, Kurokawa K, Satake Y, Shoda K, Imoto I, Rokutan K. HuR regulates alternative splicing of the TRA2beta gene in human colon cancer cells under oxidative stress. Mol Cell Biol. 2014; 34:2857–2873.
50. Kurokawa K, Akaike Y, Masuda K, Kuwano Y, Nishida K, Yamagishi N, Kajita K, Tanahashi T, Rokutan K. Downregulation of serine/arginine-rich splicing factor 3 induces G1 cell cycle arrest and apoptosis in colon cancer cells. Oncogene. 2014; 33:1407–1417.
51. Huang da W, Sherman BT, Lempicki RA. Systematic and integrative analysis of large gene lists using DAVID bioinformatics resources. Nat Protoc. 2009; 4:44–57. 52. Huang da W, Sherman BT, Lempicki RA. Bioinformatics
enrichment tools: paths toward the comprehensive functional analysis of large gene lists. Nucleic Acids Res. 2009; 37:1–13.