The Price Decline of Rice and its Effects on
the Family Farm : A Case Study of the Tohoku
Region
著者
SASAKI Toru
雑誌名
The science reports of the Tohoku University.
7th series, Geography
巻
56
号
1
ページ
35-48
発行年
2009-03
URL
http://hdl.handle.net/10097/45272
35
The Price Decline of
: A Case
Rice and its
Study of the
Effects on the Family
Tohoku Region
Farm
Toru SASAKI*
Abstract The price of rice has declined rapidly since 1995. The response has been to restructure Japanese agriculture not by increasing the size of farms but by diversifying farming management with labor-intensive crops. The depen-dence on rice to secure agricultural income is still high in the Tohoku region, and thus the price decline for rice has directly decreased agricultural income in the area. The plan for restructuring farm management in the Tohoku region is the same as that on the national scale, that is, converting rice monoculture farms to diversified management. However, much of the Tohoku region grows rice as the main crop of diversification. Further decreases in the price of rice will have a negative impact on these farms.
Key words : price decline of rice, rice monoculture
Tohoku region, Japanese agriculture
farm, diversified farm,
1. Introduction
Since the mid 1990s, The World Trade Organization (WTO)'s globalization has
affected Japanese agriculture. A series of trade liberalization policies rapidly
increases agricultural imports and decreased the price of domestic agricultural
prod-ucts. Thus, the liberalization resulting from the WTO's globalization forcibly reduced Japan's agricultural production.
The decline of Japanese agriculture is obvious ; the gross domestic product (GDP) share of agriculture decreased from 9% in 1960 to 1.6% in 2005. Similarly, both the
number of farm households and the acreage of cultivated farmlands decreased. From
1985 to 2005, the number of farm households decreased 35%, while farmlands decreased
20%. At the same time, agricultural output decreased about 24% from 11,540 billion
yen in 1985, the peak year, to 880 billion yen in 2005.
This declining and restructuring tendency has progressed swiftly because of the
decline in the price of rice. Although rice plays a key role in Japanese agriculture, the share of rice to agricultural output decreased from 32% in 1985 to 23% in 2005. On
Graduate Student, Institute of Geography, Graduate of School of Science, Tohoku University, Sendai 980-8578, Japan
36 Toru SASAKI
the other hand, that of vegetables and livestock increased. Thus, various kinds of
crops other than rice became key crops in Japanese agriculture. After the new Food Law of 1995 became effective to replace the Food Control Law of 1942, the price of rice
began to drop rapidly, decreasing agricultural income and damaging the income of
farm households.
Such a policy shift directs the trend of agricultural reorganization. This phenom-enon becomes interesting because it has been regarded as a serious structural problem
and an objective of policy research. In particular, Hokkaido, Tohoku and Hokuriku
are studied as regions of interest. Those areas are also representative rice production
regions in Japan. The main concern of these regions is clarifying formation or
development factors of competitive large-scale rice farming management.
There-fore, in this context, I believe that the following two problems must be addressed as a part of the significant subject of agricultural reorganization.
First, in the past, scholars were attracted only to the studies of scale expansion as farmers reacted to the price decline of rice. However, scale expansion at the single
management level is not the only possible reaction ; management diversification is
another option. While many Japanese farms depend on a family labor force (Isobe,
2000), farm households tend to diversify their managements with their farm size
increased (Hirabayashi, 2007). Therefore, when analyzing the diversified farm, one
must simultaneously examine both the trend toward large-scale management and the
direction of agricultural reorganization.
Second, in light of the examination of diversified farms as a possible direction of
agricultural reorganization, the conditions for selecting appropriate crops must be
examined. Currently, there are few studies about diversified farms (Yamadera, Arai,
2003). The past research clarifies that farmers have most often tried to choose
profitable crops to advance diversification instead of expanding the scale of rice
farming. However, in the situation of intense market competition with the increase
of agricultural imports, farmers' capacity to choose alternative crops is considerably
narrowed (Higashiyama, 2001). Therefore, to establish marketable crops, it is
neces-sary for an agricultural production area to attain a certain scale of operation and profitability. In the end, I would like to show how scale expansion and management diversification affect the characteristics of Japanese agriculture.
In this paper, I clarify how the price decline of rice has changed farm
manage-ments in the Tohoku region. For this purpose, I analyze forms of farm management
on a national scale. In the second section of the paper, I explore the regional
characteristics of Japanese agriculture, including a look at the trends of agricultural sale, scale enlargement, and the number of days of input labor. Next, I explore the effects of rice price decline in the Tohoku region, which very much depends on rice. For this purpose, I describe the characteristics and changes in Tohoku's agricultural
The Price Decline of Rice and its Effects on the Family Farm 37
regions that have occurred during the last decade.
2. The Rice Price Decl ine and Development of Japan's Agricultural Regions
Figure 1 shows the price trends of main varieties of rice in recent years. The data for 1993, a year of severe cold-weather damage, has been removed from the chart ; the highest prices for all rice brands occurred in 1992. After the Food Control Law was abandoned in 1995, the price of all brands began a downward trend. Even the price of Koshihikari in Niigata decreased about 30% from 25,429 yen in 1992 to 19,176 yen in 2002. This is supposed to be the most expensive rice in Japan. This tendency is seen in every rice brand and affects most severely those regions expecting high prices for rice.
Figure 2 shows the distribution of part-time farms and rice monoculture farms in
Japan in 2005. This figure shows the relational nature between farms dependent on
rice production and part-time farming. First, regarding rice monoculture farms,
while 52.3% is the national average, a higher proportion of these farms is distributed
from Tohoku to Hokuriku. Toyama (91.5%) has the greatest proportion of rice
monoculture farms, followed by Niigata (87.1%). Akita (81.4%) has the greatest
proportion of these farms in the Tohoku region. In contrast, Hokkaido, Tokai,
Y e n 6 0 k g 28, 000 26, 000 24, 000 22, 000 --*—Kirara397 (Hokkaido) (Miyagi) —0—Hi tomebore (Miyagi) —D—Akitakomachi (Aklita) --*—Koshihikari (Nigata) 20, 000 18, 000 16, 000 14, 000 12, 000 1990 1991 1992 1993 1994 1995 1996 1997 1998 1999 2000 Year
Figure 1 The price of major rice varieties through years source : Ministry of Agriculture, Forestry and Fisheries
38 Torn SASAKI
Rice monoculture farm (%) 11175 - 100 (7) E 50 - 75 (18) 25 - 50 (13) n 0 25 (9)
Type of farm
(%)
11)
BM
Full-time
farm
n
Part-time
farm
oso
• : • :( ° • : . . .' : 11:111P
Cr
4rif
N r=s, • •\_41.
i
5 Figure 2 Source 0W+E
150 300 I I I kmThe proportion of part-time farms and rice monoculture farms in Japan in 2005 Agricultural Census
Shikoku, and Kyushu have the lowest proportion of rice monoculture farms.
In terms of part-time farms, the national average is 77.4%, indicating that part-time farms continue to play a central role in Japanese agriculture. However, in the
matter of regional differences, the number of part-time farms in Tohoku and
Hoku-riku is relatively high, while the number in Tokai, Shikoku, and Kyushu is low. The
proportion of part-time farms is the highest in Fukui (90.3%) and the lowest in
Hokkaido (47.8%).
These statistics show that areas tend to have both a high proportion of rice
monoculture farms and a high proportion of part-time farms, which indicates that
mechanization and laborsaving practices for rice production created part-time
farm-ing. On the other hand, under the price decline of rice, many part-time farmers are
still involved in rice farming. They are very likely to be engaged only in rice
monoculture.
The Price Decline of Rice and its Effects on the Family Farm 39
84%, 81.7% (in 2000) to 77.4%, and the proportion of rice monoculture farms also
decreased from 55.2%, 54.2% to 53.2%. This is attributed to the decreasing number
of rice monoculture farms and the increase of elderly full-time farmers. The elderly in the countryside retire from other industries and begin to work full-time on their farms.
The number of farm households decreased to fewer than 2 million households by
2005 as the economic status of rice fell. However, according to Ando (2001), some
farmers have attempted to farm full-time to diversify management while not carrying out the scale enlargement of rice farming.
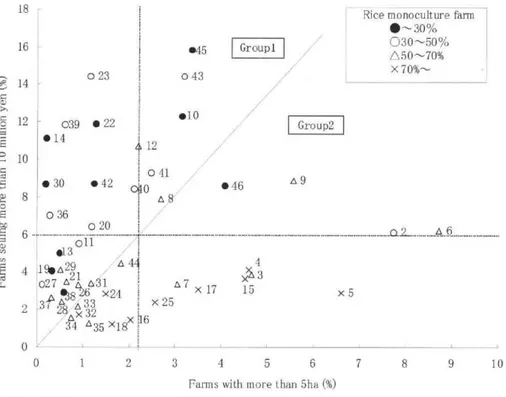
Figure 3 shows the makeup of farms with regard to size and crop. This figure
shows the effect of scale enlargement on agricultural sales. Prefectural dependence
18 Rice monoculture farm
0-30% - 16 •45 Groupl 030 ^50% A50-70% 023 043 x70%- 14 >-.
5 12
039 • 22
•10
Group2
• 14 412 10 0 41 • 30 •42 0a0 • 46 °9 8 A 8, a o 36 020 7,7 A 6 S a ° 011 el3 4 1 9•A21 4 027 A-A 6,31 el3 0 1 1 7 ,„, )<)' 3 4 1 9•A29 027 A 21 ,r / 44 6 7 x) 3 4 •382x 17 1516x24 x 5 2 378.z A32 33 x25 Ax 34 A 35 x18x 16 0 0 1 2 3 4 5 6 7 8 9 10 Farms with more than 5ha (%)Figure 3 Scale enlargement and farm income in 2005 Source: Agricultural Census
2. Aomori 3. Iwate 4. Miyagi 5. Akita 6. Yamagata 7. Fukusima 8. Ibaraki 9. Tochigi 10. Gunma 11. Saitama 12. Chiba 13. Tokyo
14. Kanagawa 15. Nigata 16. Toyama 17. Ishikawa 18. Fukui
19. Yamanashi 20. Nagano 21. Gifu 22. Sizuoka 23. Aichi 24. Mie 25. Shiga 26. Kyoto 27. Osaka 28. Hyogo 29. Nara 30. Wakayama
31. Tottori 32. Sihimane 33. Okayama 34. Hiroshima 35. Yamaguchi
36. Tokushima 37. Kagawa 38. Ehime 39. Kochi 40. Fukuoka 41. Saga 42. Ngasaki 43. Kumamoto 44. Oita 45. Miyazaki 46. Nagasaki
40 Toru SASAKI
on rice is also shown as the attributes of each prefecture except Hokkaido are
indicated, based on the proportion of farms devoted to rice monoculture. The vertical axis shows the proportion of farmers who sell more than 10 million yen in agricultural products ; the horizontal axis shows the proportion of farmers who have more than 5 ha of farmlands. This shows the trend of Ninaite. Ninaite is a Japanese policy term
for a designated competitive farm. These farms are supposed to earn high income as
they increase the economic efficiency with scale enlargement.
Two groups are found in the figure. In Group 1, the proportion of farms with more than 5 ha of farmlands is higher than the national average. In this group, the farmers try to earn agricultural income by growing rice. In Group 2, the proportion of farms with more than 10 million yen in sales is higher than the national average. These farmers tend not to conduct scale enlargement of rice farming and secure their agricultural income from rice sales.
These groups demonstrate the following regional differences. Tohoku,
Hokuri-ku, and Chugoku belong to Group 1. As the proportion of rice monoculture farms is
high, the dominant farms tend to be formed to grow land-intensive crops. Yamagata
(No. 6) and Akita (No. 5), for example, have large-scale rice farms. The Kanto,
Shikoku, and Kyushu regions belong to Group 2. In some parts of these regions, as the proportion of rice monoculture farms is low, the dominant farms tend to be formed to grow crops other than rice ; for example, in Miyazaki (No. 45), Kochi (No. 39), and
Aichi (No. 23), labor-intensive agriculture like greenhouse gardening exists. Thus,
the regional composition of present Japanese agriculture is divided into two different
management types. However, this regional distinction of Japanese agriculture does
not explain the positive relation between scale enlargement and agricultural sale.
Rather, the introduction and expansion of labor-intensive agriculture like greenhouse
gardening has diversified farm management and increased farm incomes. That is,
scale enlargement of land-intensive farming does not necessarily result in high profit.
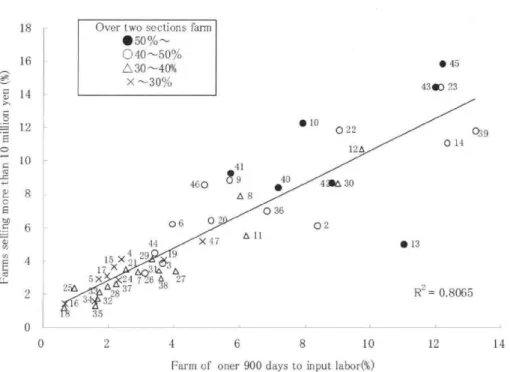
Figure 4 supports the high profitability of introducing labor-intensive crops in
diversified farming. The vertical axis shows the proportion of farmers who sell more than 10 million yen in agricultural products ; the horizontal axis shows the proportion of farmers who have over 900 days of labor input. The attributes of each prefecture are shaded by the proportion of farms in which more than two crop types are managed. As the figure shows, the addition of a crop type, which can increase labor input, leads to increased income. One example is the introduction of horticulture in diversified management.
The area of Group 2 is shown in Figure 3. Miyazaki (No. 45), Kumamoto (No.
43), and Kochi (No. 39) are in the upper right corner, while Iwate (No. 3), Akita (No. 4), Miyagi (No. 5), Niigata (No. 15), Toyama (No. 16), and Fukui (No. 18) are dis-tributed in the lower left part of the figure. The former three and the latter three
The Price Decline of Rice and its Effects on the Family Farm 41 18 16 14 0
8
12 10 22, 8 0 8 6 4 2 0Over two sections farm • 50 040-50% A 30 ---4096 X ----30% 25A 15 X 4 2,9 17 X
5X24,9
32 A28 37 460 06 O24k/S---47
< ,.,9 0 3 31A A 6`18 27 41t9
A 8 A 11 •40 0 36 • 10 022 12,6 43DA 30 0261631,32--
35 6 8 10 oner 900 days to input labor(%)• 13 • 45 436D 23 0 14 R2 = 0.8065 039 0 2 4 Farm of 12 14
Figure 4 Farms with over 900 days of input labor shown according to farm income in 2005
Source : Agricultural Census
belong to Tohoku and Hokuriku regions, respectively.
Unfortunately, the alternative farm development strategy to the scale expansion
of rice farms faces a difficult situation. That is, the selection and concentration of
competitive farms didn't form competitive farm regions, and the number of
competi-tive farms decreased. Farmers with more than 10 million yen in sales decreased from
128,000 in 1995 to 116,000 in 2005, while the proportion of these farmers to the total number of farmers remained almost the same, rising only ca. 1% from 5.0% to 6.1%. The same logic works in terms of large-scale farms. While the number of farms with more than 5 ha increased from 35,000 households to 50,000 households, the proportion
of these farms only increased 1.6% from 1.0% to 2.6%. Thus, the prospect of
diversified farming is not so positive, either. This problem has occurred with labor-intensive crops such as vegetables and flowers ; for example, the competition with imported agricultural products slowed the increase in price. The lack of a dependable workforce in the agricultural sector and the obstacles resulting from repeated planting are also factors.
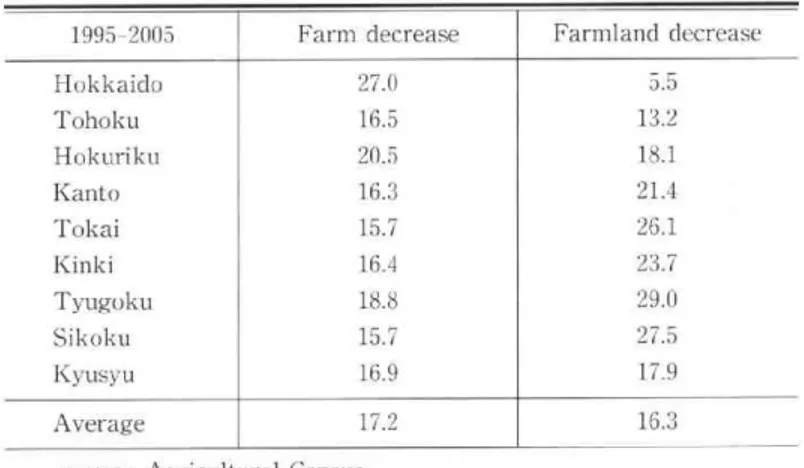
Table 1 shows the reduction rate of farms and cultivated land from 1995 to 2005.
The average national reduction in farms was 17.0%, and that of cultivated land was
42 Toru SASAKI
Table 1 Decreases in agricultural resources in Japan, 1995-2005
1995-2005 Hokkaido Tohoku Hokuriku Kanto Tokai Kinki Tyugoku Sikoku Kyusyu Average Farm decrease 27.0 16.5 20.5 16.3 15.7 16.4 18.8 15.7 16.9 17.2 Farmland decrease 5.5 13.2 18.1 21.4 26.1 23.7 29.0 27.5 17.9 16.3 source : Agricultural Census
the national average in farm reduction. Hokuriku (18.1%), Kanto (21.4%), Tokai
(26.1%), Kinki (23.7%), Chugoku (29.0%), Shikoku (27.5%), and Kyushu (17.9%)
showed a higher pace of decrease in cultivated farmland than the national average.
In the Hokkaido, Tohoku, and Hokuriku regions, the pace of decrease in
culti-vated land was slower than the pace of decrease in farms. While farms and cultivated land decreased, the scale expansion of individual farms was not fast enough to enable the cultivation of depreciated farmland.
In other areas, however, the proportion of cultivated land decreased more than
20%. The reduction is especially remarkable in the Pacific coastal zone. This is
probably because not only the reduction of farms but also the conversion to
non-agricultural land use and the abandonment of cultivated farmland have affected this
area. As a result, while the size of the labor force and the means of production continue to decrease in Japanese agriculture.
3. Changes in the Agricultural Areas of the Tohoku Region
3.1 Changes in the Farm Household Economy in the Tohoku Region
As discussed above, the recent rice price decline did not increase the size of many Japanese farms but it did cause a diversification of management with labor-intensive crops. In this section, I would like to consider how the rice price decline has affected
the Tohoku Region. Tohoku is normally considered to have a high level of rice
dependence.
First of all, in terms of Tohoku's position within Japan, the region's proportion of
the total domestic agricultural production decreased from 18% to 16%. However,
The Price Decline of Rice and its Effects on the Family Farm 43
2005, Tohoku had 26% of the nation's rice growing area and 26% of the national rice
production. Tohoku also produces 70% of domestically produced apples and 80% of
domestic cherries. In terms of feeding heads in livestock, Tohoku's share of beef
cattle is 17% ; that of hogs is 16% ; that of broiler chickens is 22%. However, agricultural output in the Tohoku region decreased 34% from 254 billion yen in 1985 to 138 billion yen in 2005. Particularly, rice output decreased by half from 100 billion yen to 50 billion yen. Thus the declining position of Tohoku in the nation seems to result from the rice price decline and its negative effect on rice output.
While rice mainly characterizes regional agriculture of the Tohoku region, the
Tohoku farmers have changed the nature of the farm household economy in several
ways. Figure 5 shows the basic indexes of the farm household economy from 1965 to
2003. Living expenditure consistently increased to 1998. It increased from 600,000
yen in 1965, 1 million yen in 1969, 2 million yen in 1975, 3 million yen in 1977, 4 million yen in 1980, and 5 million yen in 1991 to 5.6 million yen in 1998. Since then, it has fluctuated from 5 to 6 million yen. In 2003, it was 5.06 million yen. On the other hand,
agricultural gross income was below living expenditures from 1969. The gap
in-creased every year, reaching 1.67 million yen in 2003. Unfortunately, as agricultural expenditures increased even in the 2000s, the ratio of agricultural income to family
8000 7000 6000 5000 0 cg 4000 3000 2000 1000 0 • • - ./.1\
xja,71)
-\ /1 • ^-EL .cr cr 13 El. C. .0 P. - , .o-t r. Er 1:1 • 0. 0 80 70 60 50 40 % 30 20 10 0 1965 1970 1975 1980 1985 1990 1995 2000—0—Agricultural gross income 0 Agricultural expenditure
-- - -Agricultural income —A— Non-agricultural income
- Total income of farm household ^ Living expenditure
-A- Ratio of agricultural income to family expenditure - -U- Dependent ratio on agriculture
Figure 5 Farm household economy in Tohoku
44 Toru SASAKI
expenditure decreased to about 20%. The total income of farm households increased
from 1965 to 1995. It was 77,000 yen in 1965 ; more than 1 million yen in 1967 ; more than 2 million yen in 1973 ; 3 million yen in 1975 ; 4 million yen in 1979 ; 5 million yen in 1985 ; 6 million yen in 1990 ; 6.7 million yen in 1994. However, since 1995, the total income has decreased at an unprecedented pace. Reaching 5.13 million yen in 2003, it decreased to the same level as family expenditure. The decrease of farm income from 1995 is attributed to the rice price decline after the abandonment of the Food Control
Law. Owing to the high dependence on rice in Tohoku's farm household economy, the
direct impact of the rice price decline becomes highly significant. In addition,
non-agricultural income decreased from the peak of 5.29 million yen in 1997. This was
another cause of the decrease in the total income of farm households, because non-agricultural income played a significant role to sustain the total income. In 2003, non-agricultural income decreases to 4 million yen ; this is the same as in 1988.
In the 1990s, non-agricultural income decreased because the dislocation of rural
factories shrank the regional labor market. As a consequence, while the dependence
on agriculture increased slightly, the farm household economy generally continued to
deteriorate.
3.2 Regional Characteristics of Tohoku Agriculture
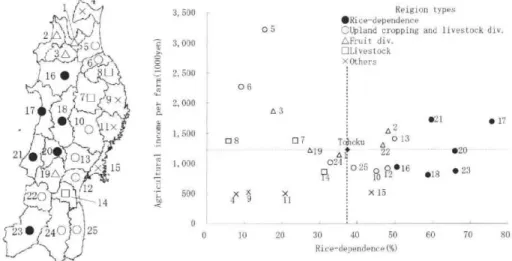
The classification of regions by agricultural sale leads to the analysis of regional characteristics as a way of understanding the characteristics of rice production in the Tohoku region. Figure 6 shows the classification of regions within the Tohoku region.
4 1\2.= ./
2:AI
• 16 • ,;,.. ..,.„58nk 7^ x 17 •100 lx . 2• nitpx 15
0C220k-14
23 • /24010 25 a • a 3, 500 3, 000 2, 500 2, 000 06 1, 500 - 0 8 1, 000 05 03 500 0 — Reigion types •Rice–dependence°Upland cropping and livestock div, L.Fruit div. ^Livestock X Others •21 02 0 7 Tclhoku A 0 13 Aty 6 • 222.. . .. _ .. •20- P024 91 025 0p•16 to 12 118 • 23 X1 X 15 0 20 • 17 30 40 50 60 70 80 Rice–dependence (%)
Figure 6 Rice-dependence and agricultural income in Tohoku (2005)
The Price Decline of Rice and its Effects on the Family Farm 45
The vertical axis represents agricultural income per farm ; the horizontal axis repre-sents the share of rice to agricultural output (the value of rice-dependence in this study). These regions are historically organized according to their regional economic
centers. Furthermore, based on the makeup of agricultural output, these regions are
grouped into five types. The first type is a rice-dependence region, because rice
consists of more than 50% of agricultural output in this region. This region type is shown with a black circle.
The second type is a region with diversified agriculture with upland cropping and livestock. In this type of region, rice consists of less than 50% of the agricultural output, while the rate of upland cropping and livestock is more than the average of the Tohoku region. This region type is shown with a white circle. The third type is a region with diversified agriculture with fruit. In this type of region, rice consists of less than 50% of the region's agricultural output, while the ratio of fruit to agricultural output is more than the average of the Tohoku region. This region type is shown in a triangle in the figure. The fourth type is a livestock region, in which livestock accounts for more than 50% of the agricultural output. This region type is shown in
a rectangular. The other regions are shown in a crosshair. These are not
significantly grouped like the other region types.
Usami (1985) points out that these regional characteristics emerge because of the
unique historical experience of agriculture in Tohoku. That is, No. 5 to 8 were
regarded as an area with upland crops and horse-raising in the Meiji period. No. 3 and No. 19 were regarded as an area with rice farming and sericulture in the Meiji period. After WWII, this type of region produced fruit instead of silkworms. No. 2, No. 13, No. 18, No. 21, and No. 23 established a region with powerful landlords before the war. After the war, this type of region became a region with rice monoculture.
With the current rice price decline, the characteristics of the Tohoku region reflect the history of each region. The characteristics express two directions, as exemplified by Group 1 and Group 2. In Group 1, agricultural income increases as rice-dependence increases ; for example, No. 17 and No. 21 have the greatest income in the group.
They are a representative region of large-scale rice production, and their success
indicates that rice production can allow a region to secure agricultural income even under a rice price decline.
On the other hand, in Group 2, agricultural income increases as rice-dependence
decreases. No. 5 and No. 6 are the most successful examples in this group. These
are large producers of vegetable such as garlic and Chinese yams. No. 3 is a large
producer of apples. These regions show a successful way to secure income by
establishing the production of vegetables and fruits. They diversify farm
manage-ment with crops other than rice.
46 Toru SASAKI
importance of rice remains. The share of rice to agricultural output in Tohoku is
38%, that is, 15% higher than 23%, the national average. However, as shown in
Figure. 6, the fact is that regions have higher agricultural income if they have crops other than rice as their main crops.
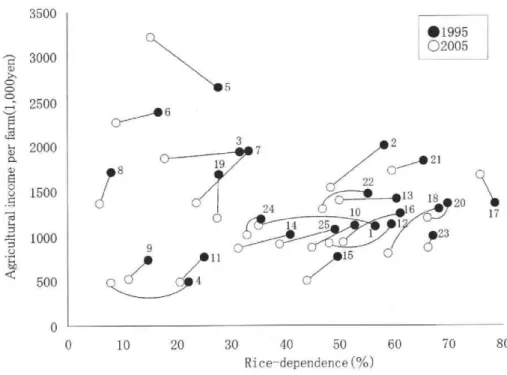
The impact of the rice price decline is considered in Figure 7, where a comparison between 1995 and 2005 shows the change in each region. All regions but No. 5 and No.
17 show a decreased agricultural income. Moreover, all regions except No. 17 show
both a decreased degree of rice-dependence and decreased agricultural income. The
rice price decline can directly decrease agricultural income. This tendency was more significant in regions with 50% to 60% rice dependence in 1995. These regions show the importance of rice in the Tohoku region.
Each type of region reacts differently to the decreases in rice-dependence and
agricultural income. The rice-dependent regions have decreased their dependence by
about 8%, while the decreasing rate of agricultural income is more than 18% in these regions. That is, regions highly affected by the rice price decrease cannot easily stop
depending on the rice monoculture. Regions with diversified agriculture with upland
cropping and livestock have decreased their dependence on rice by about 10%. The share of rice there is 37% of the agricultural output. These regions have softened the
a) CD CD a:3 4. a) a) 0 0 0 c.) s-, 3500 3000 2500 2000 1500 1000 500 0 19 5
78
3 7 oI 24 22((0 •
10 9 25c()D/11
/15
•1995 02005 2 21 0 --Of320(1,23
17 0 10 20 30 40 50 60 70 Rice—dependence(%)Figure 7 Changes of agricultural regions under rice price decline Source: Annul Agricultural income products Census
The Price Decline of Rice and its Effects on the Family Farm 47
impact of the rice price decline as they changed crops from rice or diversified their
management. In regions with diversified agriculture with fruit and in livestock
regions, although the rate of rice-dependence has decreased to 41%, the agricultural
income has decreased 28%. Fruit and livestock, the main products of these regions,
made the difference. Also, the competition with other domestic production regions
has become more intense. In these regions, the dynamics of non-rice products can
negatively affect farm management. In this way, the rice price decline has affected the agricultural regions in Tohoku in a variety of ways.
Currently, the Tohoku region faces a big problem. Not only does it have a low selection of crop varieties from which to choose, but the conditions for rice production are eroding. As a result, the region cannot change crop types. They only face the
rapid decline of rice price. The problem becomes more immediate to restructure
regional agriculture. The region needs to break away from rice monoculture
part-time farming, while the conversion of management becomes indispensable for farm
households to survive under the ongoing rice price decline.
4. Conclusion
In this study I examined the directions of farmers under an ongoing rice price decline in Japan. As a result, the following points become clear.
1) The price of rice has declined rapidly since 1995. While some agricultural regions have both a high proportion of rice monoculture farms and a high proportion
of part-time farms, both part-time farms and rice monoculture farms are decreasing
in proportion and number on the national scale. In this situation, the direction to restructure Japanese agriculture and farmers is not to increase the size of farms but
to diversify farm management with labor-intensive crops. In the regions with
depen-dence on rice production, the effects of enlargement of farm size were limited. A
decline in the price of rice does not necessarily increase agricultural sales and farm
income when regions increase farm size. In the meantime, growing crops other than
rice is difficult because the number of farmers with more than 1,000,000 yen in
agricultural sales has decreased.
2) The dependence on rice is still high in the Tohoku region. Rice production continues to be important to assure agricultural income. Thus, the rice price decline
has directly decreased agricultural income in an obvious way. Furthermore, since
1995, the rate of farm income decrease has been more acute than ever. Agricultural
management costs and living expenditures have also increased. At the same time,
non-agricultural income has decreased, while this income is needed to sustain the farm
income. The direction of farm management restructuring in the Tohoku region is the
48 Toru SASAKI
to diversified management. However, many farmers in the Tohoku region already have rice as the main crop of diversification, so a further rice price decline may decrease the number of farms. While this provides the opportunity to increase farm size, the possibility is thin at the current price of rice.
Acknowledgements
My deepest appreciation goes to Prof. M. Hino, whose suggestions were of inestimable value for
my study. I am indebted to Prof. T. Koganezawa, whose comments contributed enormously to my
work. I wish to express my gratitude also to my friend, Mr. Yoshitaka Miyake, who edited the
English.
References (* in Japanese, ** in Japanese with English abstract)
Ando, M. (2001) : rAtarashii jyousounou _i to inasaku seisannryoku kouzou*. Nougyo mondai kenkyu 50, 9-20.
Higashiyama, K. (2006) : Touhoku-chiiki ni okeru fukugougata-syuraku-einou no kai*, Hirano, N : Higashi-nihon no kyousei nougyo shisutemu. Nourin-toukei-kyoukai,
45-81.
Hirabayashi, M. (2007) : Daikibo-kazoku-keiei no tennkai-kouzou to sono youin Touhoku suiden-saku chitai yamagata, syounai* : Kajii, I : Nougyo kouzou-kaikaku no
kai. Nihon nougyo nenpou 53.
Hirano, N. (2006) : Kokusou-chitai toshiteno Touhoku • Hokuriku*, Hirano, N : Higashi -nilum no kyousei nougyo shisutemu. Nourin-toukei-kyoukai, 1-16.
Isobe, H. (2000) : Commune no sisou.* Nihonkeizai-hyouronsya, Tokyo.
Nakamura, K. (2006): Tohoku-Syounai nioru chiiki-nougyo-saihen no tokusitu to kyousei kouzou*. Hirano, N : Tohoku- nihon-kokusou-chitai no kyousei nougyo system.
in-toukei-kyokai, 82-117.
Nakamura, K. (2006) : Jirituteki- chiiki-nougyo-saihen no kouzo— tayou na chiiki *whit soshiki no governance—*. Nousei-tyousa-iinnkai.
Usami, S. (1985): Michinoku karano Nougyo Saikousei. Niho-keizai-hyouronsya, Tokyo. Usami, S. (2005) : Nougyo-seisanryoku-tenkai to Chitaikousei*. Tsukuba-syobou, Tokyo. Yamadera, S. and Arai, S. (2003) : Kome seisaku tenkanki niokeru Niigata-ken chu-jyousou
nouka no keiei senryaku, kita-kanbara-gun nakajou-machi wo jirei ni. chiri-kagaku 58, 22-45.