Effect of vehicle display information and switch type
on usability
―Comparison between young and older adults―
Wang Shuguang and Atsuo MURATA
Graduate School of Natural Science and Technology, Okayama University
3-1-1, Tsushimanaka, Okayama-shi, Japan
email:[email protected]
[email protected]
Abstract— Recently, in-vehicle highly intelligent
information devices are rapidly widespread. Under such circumstances, the accurate evaluation of the effect of display information and switch type on driving performance is important in order to develop in-vehicle information devices that do not menace the safety. In this article, we present a basic idea to estimate properly the effect of the vehicles display information and the switch system on driving performance. We compared the index such as mean task completion time, subjective rating on usability, tracking error, and NASA-TLX workload between young and older adults. The results suggest that young will be better than older adults at both abilities on processing displayed information and operating the switch. We were found that there was a significant interaction between the switch types and installation location. On the other hand, the displayed information did not affect the performance.
1. INTRODUCTION
Recently, the development of information technology has led to the rapid spread of sophisticated in vehicle information system such as car navigation devices(1). It’s considered that driving will becoming more and more complex with the growth of intelligent transportation system. As much of the information provided contains texts and images, drivers are apt to become distracted and inattentive. Driving a car placed a characteristically heavy workload on visual perception, cognitive information processing and manual responses (2). Under such circumstance, the accurate evaluation of the effect
of display information and switch type on driving
performance is important in order to develop in-vehicle information devices that do not menace the safety.
Previous research in the area of controls for secondary devices in automobiles is notable for the lack of reported work on switch type. Dukic et al (3)has been discussed the effect of push button location and auditory feedback on visual time off road and safety perception when driving. Their study suggested the time off road increased significantly as the angle increased between the normal line of sight and button location of the five buttons placed on center stack. They also have been discussed about the results for the button located close to the gear stack, which produced a short time off road. However, the experiment took into account the location of controls but not on the function of buttons. Therefore, such as a multi-control that already implemented in some vehicles (e.g. BMW5 series with iDrive) to be needed to tested, as well as the relationship between switch type and its location. On the other hand, increasingly used steering switch should be taking into account for the factor of button location.
Murata et al (4)has examined how the number of steering wheel mounted switches and their arrangement interactively affected a driver’s performance. Moriwaka et al (5) has discussed the spatial relationship between the steering switch and the display. Murata et al (6)has discussed the effects of display direction, arrangement of switches and number of layers on performance to the design of display and control system. But there is a still lack of examining with multi-functional switch, especially of the case located around gear.
As to the display used in vehicle, the menu structure, character size and background color had studied by Moriwaka
et al(7). In other way, the volume of content of display is an
important factor to deciding the usability and visibility of display. Takahashi et al (8) selected the display information that was calculated from number of links as experimental factor in a study on web design, was found display
Fourth International Workshop on Computational Intelligence & Applications
information contributed to increase of the web navigation time. As considering the displays used in vehicle provide similar information to computer display, it is worth while to check out the effect of display information on performance in driving. After all, in a study of display design, the information of display should be considered.
Murata et al(7)also has discussed the effects of driver age on driving performance since there are many reports suggesting that older adults exhibit deficits in various cognitive-motor tasks. So it is questionable whether the display information affects the performance as the cognitive-motor functions are clearly different between young and older populations.
The aim of the present experiment was to study the effect of switch type and its location, display information and age on driving performance, and we tried to provide a general evaluation of in-automobile display and control system, as well as to investigate whether these factors interactively affect performance. Therefore, we defined the display information with chosen probability and conducted an experiment using two age groups in which the effectiveness of push button switch and rotary integrated switch was evaluated.
2. METHOD
Drivers in the experiments performed a simulated driving task. The secondary tasks included the control of an air conditioner, the operation of a radio, and the operation of a CD/MD. The control was conducted using two types of switches with two locations respectively. The display was arranged on the appropriate panel in front of the participant. Participants were required to perform the secondary task while performing the primary task.
2.1. Participants
Twenty participants took part in the experiment. Ten were male adults aged from 65 to 73 years. All had held a driver’s license for 30 to 40 years. Ten were male students aged from 20 to 25 years who were in their undergraduate or graduate academic course and licensed to drive from 1 to 5 years. Stature of participants ranged from 160 to 178 cm. all participants were out of orthopedic or neurological diseases and were found normal vision with or without corrections.
subject Steering switch 350cm 210cm 110cm TFT LCD color display SONY SDM-N50 Rotary Encoder OMRON E6F-AB3C Power source Digital I/O Board Interface PCI-2131AL Personal Computer COMPAQ Evo D310 Analog Circuit Personal Computer SOTEC e-note H370TDX4
Digital I/O Card Interface PIO-24W(PM) Projector PLUS V-1000 Screen subject Steering switch 350cm 210cm 110cm TFT LCD color display SONY SDM-N50 Rotary Encoder OMRON E6F-AB3C Power source Digital I/O Board Interface PCI-2131AL Personal Computer COMPAQ Evo D310 Analog Circuit Personal Computer SOTEC e-note H370TDX4
Digital I/O Card Interface PIO-24W(PM) Projector
PLUS V-1000
Screen
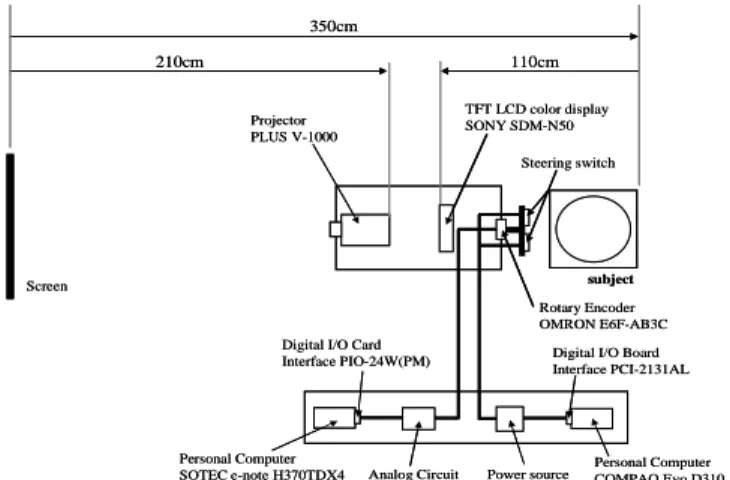
Figure 1. Outline of the experimental system and layout.
Tracking system, personal computer for displaying
information on meters (speedometer and tachometer) and operation, personal computer equipped with an I/O card used to operate switches.
Figure 2. Switch system used in this experiment.
2.2. Apparatus
The experimental system is illustrated in Figure 1. The main components were (i) a pursuit tracking system (a personal computer with an I/O board, rotary encoder, and steering wheel). This PC was connected to a projector to display a tracking task in front of the participant, (ii) a personal computer equipped with an I/O card and used to enable the participant to operate switches. The TFT display was placed in front of the participant. In Figure 1, the display location is shown as the visual angle from the eye-point of the participant. A 15-inch TFT display was in front of the participant.
The switches used in this study are shown in Figure 2. The pushing switches included numerals from 1 to 5 and arrows (up, down, right and left arrows plus enter switch). The push
switches placed on the left panel or on the steering wheel. It must be noted that the switches were ‘touch’ switches.
Another type of switch which integrated two functions (rotation operation and push operation) was placed on the left panel or close to the gear stick.
The integrated switch included rotary dial function and pushing function to select the required item. Turn around function was used to move cursor and push button function was used to determine a selection. Also in the subcategory section, turn around function was used to move the cursor over the subcategory section and push button was used for selecting. After determined, ‘Back’ function was used to return to the category section and ‘Finish’ function was designed to indicate the completion of task.
2.3 Display
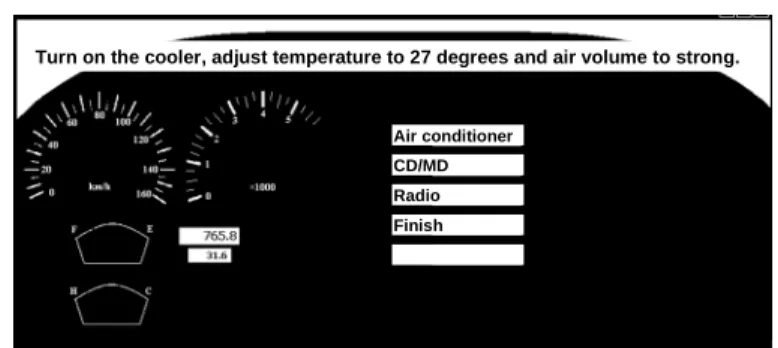
In this study, the display information was an experimental factor. Examples of display are shown in Figure 3. The information of displays was calculated by the equation (1)(9), where H(x) is the information of certain display which contain x number of item for operate, and p(x) is the probability of selecting of each item on that display. So the information of display that contain x number of item, would be calculated.
)]
(
[
log
)
(
)
(
x
p
x
2p
x
H
x
(1)In low information condition, display informed the participant of the current state as the task was performed. In this condition (composed of layer (a) and layer (b)), the information of each layer was 2.0bit and 4.7bit. In high information condition, display did not change until the task was completed. The information of this display was 6.2bit. On the displays, the related icons were also shown on the lower left. An icon related to an air conditioner was shown on the left. An icon related to a CD/MD and an AM/FM radio was shown on the right. The icons were for cooling (air conditioning), heating, CD, MD, repeat functions of CD or MD, and AM and FM radio. When these functions were selected, the corresponding icon appeared.
2.4. Task
There were three types of secondary tasks: (i) control of an
Turn on the cooler, adjust temperature to 27 degrees and air volume to strong.
Air conditioner CD/MD Radio Finish
Turn on the cooler, adjust temperature to 27 degrees and air volume to strong.
Air conditioner CD/MD Radio Finish
(a) Display with low information (first layer, 2.0bit).
Turn on the cooler, adjust temperature to 27 degrees and air volume to strong.
Air conditioner CD/MD Radio Finish
Temperature
Fan low med high
Flow
Mode cool
auto
heat
Turn on the cooler, adjust temperature to 27 degrees and air volume to strong.
Air conditioner CD/MD Radio Finish
Temperature
Fan low med high
Flow
Mode cool
auto
heat
(b) Display with low information (second layer, 4.7bit).
Turn on the cooler, adjust temperature to 27 degrees and air volume to strong.
Air conditioner
CD/MD
Radio
Finish
Temperature
Fan low med high
Flow Mode cool auto heat Back CD track1 Volume repeat audio Back Back Volume Radio AM
Turn on the cooler, adjust temperature to 27 degrees and air volume to strong.
Air conditioner
CD/MD
Radio
Finish
Temperature
Fan low med high
Flow Mode cool auto heat Back CD track1 Volume repeat audio Back Back Volume Radio AM
(c) Display with high information (6.1bit).
Figure 3. Example of displays.
air conditioner (temperature, air flow, direction of air flow, and A/C); (ii) MD/CD operation (selection of music, volume, set up of the repeat function, and switching between MD and CD) and (iii) radio operation (selection of radio station, volume, auto-tuning function, and switching between AM and FM).
A sample task was presented as follows: "Please turn on the air conditioner and adjust the temperature to 27 ℃". Conducting such a task required operating a switch a minimum number of times. The participant, however, did not always complete the pre-specified task with the minimum
number of switch operating. It is possible to perform the task with more switching than the minimum required. The participant must first operate switch and select 1, the air-conditioner control. Second, the participant selects A/C from the menu, which allows switching from heating to
air-conditioning. Next, the information on the current
temperature was shown on the second display (status display) in Figure 3. The participant was adjusted the temperature to 27 ℃ by operating the switches. When the participant determined the final state, the "finish" was selected. The task was not completed until the participant did not press on the "finish". Once the task was completed, a new task was shown on the task window to be performed by the participant.
The tracking task was one-dimensional with the horizontal position of a target line changing pseudo-randomly. The participant was required to follow the movement of a target line with the shorter vertical line controlled by a steering wheel. The target signals were produced by summing a number of harmonically related sinusoids of different phases (fundamental frequency 0.007Hz). This allowed several pseudo-random signals that were non-periodic within the duration of the tracking task. The signal bandwidth was set to 0.2 Hz (±0.1 Hz). In such a way, the position of the vertical target line was generated. The position of the vertical target line changed every 1.5 s. The position of the shorter vertical line controlled by the steering wheel was sampled every 0.1s. This means that the tracking task was one of step input types, rather than continuous. The tracking dynamics were first order in which the cursor responded proportionally to the time integral of the steering wheel (control) position. These dynamics simulate the yawing response of a motor vehicle and hence approximate the visual information processing demands of driving. The error of the vertical cursor from the target line was measured during the tracking duration. The root mean square of the error values was calculated and automatically written to the computer data file.
2.5. Design
The experimental factors were participant age (young and older adults), information of display, type (kind and location) of switches. ‘Age’ was a between-subject factor; others were all within-subject factors. The order of performance of the 16
combinations of three between-subject factors was
randomized across the participants; this random order was different for each subject. Each condition contained a total of 10 trials (tasks). The difficulty of each task was nearly the same. The tracking task was continued until the participant was completed 10 secondary tasks.
2.6. Procedure
The participant was asked to adjust his seat so that the task could be comfortably performed and the left-side console switches could be pressed by reaching his hand naturally (see Figure 1). Before the experimental tasks, the contents of primary and secondary tasks were explained to each participant. Participants were allowed to practice before performing experimental tasks. When the experimenter judged that the participant clearly understood how to perform a task, the experiment was started. The participant was instructed to keep his left hand on the steering wheel when not performing a secondary task.
The order of tracking and secondary (switch operating) tasks were counterbalanced across the participants. The secondary task was consisted of 10 switches operating trials. The duration of the tracking task differed among the participants, because the total completion time of the secondary tasks differed among participants. The participants were required to keep the primary task stable and also to perform the secondary task as fast and accurately as possible.
2.7. Experimental measures
The experimental measures of performance were (i) mean RMS tracking error between a moving target and a controlled vertical cursor, (ii) mean completion time of 10 secondary tasks, (iii) mean percentage correct performance of the secondary task, (iv) NASA-TLX evaluation, (v) questionnaire about switch usability, (vi) questionnaire about display visibility. Here a correct trial was defined as one in which the task was completed correctly, not necessarily with the minimum number of switching actions.
3. RESULT
3.1. Tracking error
Tracking error data were analyzed with a three-way (age by switch type by display information) ANOVA. Here we
consider different location of one kind of switch as different type. So we obtained four types of switches (push switch on the steering, push switch on the left panel, integrated switch on the left panel and integration switch close to gear). Results showed only a significant main effect of age (F (1, 9) =9.267,
p<0.05).
In order to study the characteristic of each age group, a two-way (switch type by display information) repeated measure ANOVA was conducted on the tracking error data apart from young and older group. A significant main effect of switch type was detected for young adult’s tracking error data (F (3, 27) =4.729, p<0.01) while there was no significant main effect of switch type for older adult’s data (Figure 4). As to young adult’s data, a post hoc test revealed the following significant pairs: push switch on the left panel and push switch on the steering (p<0.05), push switch on the left panel and integrated switch on the left panel (p<0.01), push switch on the left panel and integrated switch close to gear (p<0.01).
3.2. Completion time of secondary tasks
A three-way (age by switch type by display information) ANOVA conducted on the completion time of secondary tasks data detected a significant main effect of age (F (1, 9) =31.486, p<0.001). The result could not statistically confirmed main effects of switch type (F (3, 27) =2.669,
p=0.0677) and display information (F (1, 9) =0.075, p=0.6855).
A two-way (switch type by display information) repeated measure ANOVA was also conducted on the completion time of secondary tasks data apart from young and older groups. A significant main effect of switch type was detected for young adult’s completion time of secondary tasks data (F (3, 9) =8.516, p<0.001) while there was no significant main effect of switch type for older adult’s data (see Figure 5). As Figure 5 shows, a post hoc test revealed the following significant pairs: push switch on the steering and push switch on the left panel (p<0.001), push switch on the steering and integrated switch on the left panel (p<0.001), push switch on the steering and integrated switch close to gear (p<0.001).
As for the result of percentage correct secondary task responses, NASA-TLX workload and questionnaire about switch usability and display visibility, the statistical analyses did not indicate any significant main effects or interactions.
0 2 4 6 8 10 12 14 16 pushing switch (on the left panel)
pushing switch (on the steering)
integrated switch (on the left panel)
integrated switch (close to gear) m ea n tr ac k in g er ro r d eg re e (d eg .)
young adults older adults
p=0.0337 p=0.0077 p=0.0015 0 2 4 6 8 10 12 14 16 pushing switch (on the left panel)
pushing switch (on the steering)
integrated switch (on the left panel)
integrated switch (close to gear) m ea n tr ac k in g er ro r d eg re e (d eg .)
young adults older adults
p=0.0337
p=0.0077
p=0.0015
Figure 4. Mean tracking error as a function of age and switch type. 0 5 10 15 20 25 30 35 40 45 pushing switch (on the left panel)
pushing switch (on the steering)
integrated switch (on the left panel)
integrated switch (close to gear) m ea n ta sk co m p le ti o n ti m e (s )
young adults older adults
p=0.0002 p=0.0004 p=0.0004 0 5 10 15 20 25 30 35 40 45 pushing switch (on the left panel)
pushing switch (on the steering)
integrated switch (on the left panel)
integrated switch (close to gear) m ea n ta sk co m p le ti o n ti m e (s )
young adults older adults
p=0.0002 p=0.0004
p=0.0004
Figure 5. Completion time of secondary tasks on young and old adults.
The pushing switch on the left panel was tended to be evaluated lower and pushing switch on the steering was tended to be evaluated higher. The above observation was observed for both young and older group data.
4. DISCUSSION
Expected result about the effect of age on task performance, was similar to previous researches (Moriwaka(6) and Murata(7)). Older participants had longer completion time of secondary task, larger tracking error and less percentage correct answer than young participants. Considering the observations on integrated switch used in the present experiment, those aspects could be due to the different cognitive-motor function between young and older adults (Murata(7)).
The absence of the effect of amount of information on performance could be explained by the following reasons: That the amount of information for two conditions was the same.
Previous research suggested that switch location had a significant effect on visual time off road (Dukic, et al(3), (10)) and completion time of secondary task (Moriwaka, et al(5)). It should be noted that their studies used a push switch. Although, in the present experiment, the result of push switch agreed with that of the researches above, the present experiment suggested that the integrated switch was not affected by such a factor like location. According to Dukic, et
al(3), the more likely explanation might be that participants were very quick in developing a skill level in performing hand movement needed to operate switch located close to the gear box.
In Moriwaka et al(11), the participants were allowed to use both hands. In this experiment, subjects have to complete a task using one hand except operating the steering switch. That might be the reason why performance of steering switch was better than that of other switches.
To operate a push switch on the left panel, subjects were required to find and choose a correct button among five vertically mounted numeral buttons and arrow marked buttons which are placed close together. Using function of number marked button and arrow marked button is more vulnerable to confusion. This kind of trouble might be avoided by using an integrated switch.
Further research is needed to develop integrated switch that could be properly mounted on the steering wheel and more easily operated.
References
(1) Yuji Uchiyama, Shinichi Kojima, Takero Hongo, Ryuta Terashima, Toshihiro Wakita, “Voice information system that adapt to drivers mental workload”, R&D review of Toyota CRDL Vol.39, No.1, (2004).
(2) Wickens, C.D., Sandry, D.L., & Vidulich, M., “Compatibility and resource competition between modalities of input, central processing, and output”, Human Factors, Vol.25, No.2, 1983.
(3) Dukic, T., Hanson, L., Holmqvist, K. and Wartenberg, C., “Effect of button location on driver's visual behaviour and safety perception”, Ergonomics, Vol.48, No.4, (2005).
(4) Atsuo Murata and Makoto Moriwaka, “Ergonomics of steering wheel mounted switch–how number and arrangement of steering wheel mounted switches interactively affects performance”, International Journal of Industrial Ergonomics, 35, (2005).
(5) Makoto Moriwaka and Atsuo Murata, “Effectiveness of steering switch based on the relationship between display and control locations”, The Japanese Journal of Ergonomics, Vol.40, No.1, (2004), In Japanese. (6) Makoto Moriwaka, Atsuo Murata and Masao Kawamura, “Display design in the light of age, task difficulty, character size and background color”, The Japanese Journal of Ergonomics, Vol.42, No.2, (2006), In Japanese. (7) Atsuo Murata and Makoto Moriwaka, “Effects of Number of Layer in Automotive Display Menu Structure on Performance of Primary Driving and Secondary Task - Comparison between Young and Older Adults –”, IEEE SMC, Okayama University, Japan, 3rd International Workshop on Computational Intelligence & Applications Dec-18, 2007.
(8) Rina Takahashi, Atsuo Murata, Yoshiomi Munesawa, “Basic study on web design that is friendly for older adults ―effects of perceptual, cognitive and motor functions and display information on web navigation time―”, Vol.44, No.1, (2008), In Japanese.
(9) Hidetosi Yokoo: “Introduction to information theory”, Kyoritsu Shuppan, (2004), In Japanese.
(10) Dukic, T., Hanson, L. and Falkmer, T. ‘Effect of drivers’ age and push button locations on visual time off road, steering wheel deviation and safety perception’, Ergonomics, Vol.49,No.1, (2006).
(11) Makoto Moriwaka and Atsuo Murata, “Ergonomics of steering switches - Determination of proper number of steering switches and arrangement-”, The Japanese Journal of Ergonomics, Vol.40, No.5, (2004), In Japanese.