JAIST Repository
https://dspace.jaist.ac.jp/
Title
Rheological Properties of Low Density
Polyethylenes Produced by Tubular and Vessel Processes
Author(s) Yamaguchi, Masayuki; Takahashi, Masaoki Citation Polymer, 42(21): 8663-8670
Issue Date 2001-10
Type Journal Article
Text version author
URL http://hdl.handle.net/10119/4944
Rights
NOTICE: This is the author's version of a work accepted for publication by Elsevier. Masayuki Yamaguchi and Masaoki Takahashi, Polymer, 42(21), 2001, 8663-8670, http://dx.doi.org/10.1016/S0032-3861(01)00449-9
Rheological Properties of Low Density Polyethylenes
Produced by Tubular and Vessel Processes
Masayuki Yamaguchi*
Yokkaichi Research Laboratory, TOSOH Corporation,
1-8 Kasumi, Yokkaichi, Mie 510-8540, Japan,
and
Masaoki Takahashi
Department of Polymer Science and Engineering,
Kyoto Institute of Technology,
Matsugasaki, Kyoto 606-8585, Japan
*corresponding to Masayuki Yamaguchi Polymer Processing Institute
GITC Building, Suite 3901, New Jersey Institute of Technology, Newark, NJ 07102-1982
Phone (973) 596-6092; Fax (973) 642-4594 E-mail yamaguchi@polymers-ppi.org
ABSTRACT
Various rheological properties have been studied for two kinds of low-density polyethylenes (LDPEs): One is produced by tubular process (tubular LDPE) and the other by vessel process (vessel LDPE). The latter shows smaller g’-parameter, the ratio of intrinsic viscosity to that of linear polyethylene. It was found that both LDPEs exhibit marked strain hardening behavior, i.e., upturn departure from the low strain rate asymptote, in both uniaxial and biaxial elongational viscosities, with stronger strain hardening in uniaxial elongation. Further, the vessel LDPE exhibits larger upturn behavior than the tubular LDPE. In the stress relaxation measurement, the vessel LDPE shows larger damping function, while the tubular LDPE shows similar values to those predicted by the Doi-Edwards theory. Furthermore, there is a significant difference in the effect of the shear history on the melt strength. The melt strength of the vessel LDPE decreases more rapidly with the shear history than that of the tubular LDPE. All these differences between the two types of LDPEs are due to the difference in the branch structure. The complex, multi-branched structure of the vessel LDPE gives much more prominent elastic features.
Key Words; low density polyethylene; tubular process; vessel process; uniaxial elongational viscosity; biaxial elongational viscosity; damping function; shear modification
1. Introduction
High-pressure low-density polyethylenes (LDPEs) exhibit unique rheological properties compared with linear polyethylenes, such as high-density polyethylenes and linear low-density polyethylenes, because of their long chain branches. For example, LDPE shows larger flow activation energy,1-3 marked strain-hardening in elongational viscosity,4-6 larger damping function,7 and characteristic depression of elastic properties by shear history.8-10
Recently, considerable progress has been made in theoretical approaches to the rheological properties of branched polymers. In particular, molecular theories have been proposed which can describe the non-linear behaviors successfully with no free parameter. Wagner et al.6 proposed a rheological constitutive equation based on the tube model11 by generalizing the Wagner-Schaeffer theory.12 The constitutive equation described the stress-growth curves under uniaxial, biaxial, and planer elongational flows. Moreover, McLeish et al. proposed constitutive equations for a “pom-pom” polymer,16,17 based on the rheological characteristics of the H-shaped polymers.13-15 The pom-pom polymer is a model polymer for multi-branched polymers, which is composed of a single backbone cross bar with multiple branches emerging from each end. Their model can express the stress-growth curves in uniaxial and planar elongational flows as well as shear flow. Further, they applied the simplified constitutive equation to LDPE18 and found that LDPE can be represented as a blend of highly polydisperse “pom-pom” unit from the rheological point of view, although it is a random branch polymer with hierarchical and irregularly spaced long chain branches. Finally, the constitutive equation also predicts the rheological properties of the linear low-density polyethylene with sparse long chain branches, synthesized by metallocene catalyst system.19
The polymerization process, which is responsible for the molecular characteristics including long chain branches, has to be taken into consideration in order to produce materials having preferred rheological properties, because the characteristics of branching structure significantly affect the rheological properties of LDPE. The process of producing LDPE is mainly classified into two methods, one is called “tubular process” and the other is “vessel process” or “autoclave process”. Some studies on the
dilute solution properties of LDPEs have clarified the difference in molecular structure between tubular LDPE and vessel LDPE.20-23 According to the studies, vessel LDPE has more long chain branches than tubular LDPE. The result was also confirmed by a study using nuclear magnetic resonance (n.m.r.).24 To the best of our knowledge, however, the differences in rheological properties between tubular LDPE and vessel LDPE have not been clarified yet. Moreover, in most studies on the rheological properties of LDPE, there is no explanation for the polymerization method. Consequently, the differences in the processability have not been elucidated in detail, although both LDPEs are used for various kinds of processing.
The objectives of the present study are: (1) to clarify the differences between the tubular and vessel LDPEs in a wide variety of rheological properties, and (2) to stimulate theoreticians to apply their theories to more real, complicated branch systems. The results obtained in this study are important also for the better understanding of the processability of each LDPE and give us the information on the molecular design of the LDPE having the preferred rheological properties for an intended processing.
2. Experimental Section
2.1. Materials
The polymers employed in this study were commercial materials. Both tubular (Petrocene 176R; MFR=1.0) and vessel (Petrocene 360; MFR=1.6) LDPEs were products of TOSOH Corporation. Molecular weights and their distribution of both materials were determined by means of gel permeation chromatography (g.p.c.) (Waters, 150C), in which ortho-dichlorobenzene was used as the solvent. Table I summarizes the number-, weight-, and z-average molecular weights of both types of LDPEs as polyethylene standard. As seen in this table, the vessel LDPE has broader molecular weight distribution than the tubular LDPE.
The branching index was also estimated by the combination measurements of
g.p.c. and intrinsic viscosity (Viscotek, Differential Viscometer Model 100).
High-density polyethylenes were used as the linear polymer.
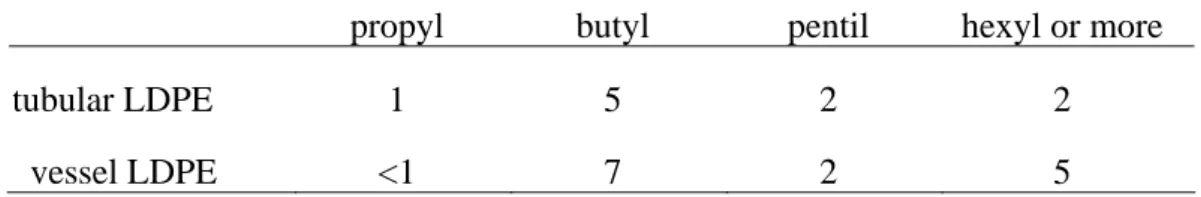
The species and contents of branches were also measured by n.m.r. As shown in Table II, the vessel LDPE has more hexyl and/or longer branches, suggesting that the vessel LDPE has more long chain branches than the tubular LDPE.
[Table II]
2.2. Measurements
Frequency dependences of oscillatory shear moduli in the molten state were measured using a cone-and-plate type rheometer (Rheometrics, Dynamic Stress Rheometer SR-2000). The samples were pressed in a laboratory hot press at 463 K and at 10 MPa for 30 min, and then quenched at 303 K. The time-temperature superposition was applied to frequency dependence curves of oscillatory moduli at different temperatures to obtain the master curves over a wide range of time scale. Stress relaxation measurements were also carried out at 433 K using a cone-and-plate rheometer (Rheometrics, Ares). The applied shear strain was 0.2-4. We also measured the steady-state shear viscosity by a cone-and-plate rheometer (Rheology, MR500) at 433 K. All measurements were carried out under a nitrogen atmosphere in order to avoid thermo-oxidative degradation. Moreover, we measured the shear viscosity by a capillary rheometer (Toyoseiki, Capillograph) having a cylinder of 9.55 mm in diameter. Three kinds of capillary dies with π/2 of entrance angle were used in order to perform the Bagley correction. The Rabinowitsch correction was also made.
Time dependence of uniaxial elongational viscosity was measured in a silicone oil bath using a Meissner-type rheometer (Toyoseiki, MELTEN Rheometer) at various strain rates
ε
&. Rod-like samples with diameter of 3-4 mm and length of 150-170 mm were prepared by means of the capillary rheometer at 433 K. The sample specimens were annealed in a silicone oil bath for 20 min prior to the experiment. The diameter of each sample was recorded by a video camera during the stretching.Biaxial elongational viscosity was measured by the lubricated squeezing flow technique (Iwamoto Seisakusho, BE-100) at 433 K. The disk-shaped samples of 20 mm diameter and 5 mm thickness were prepared by compression molding at 463 K. The silicone oil with the viscosity of 1.24 Pa s at 433 K25 (Toray Dow Silicone, SH200-10000) was used as a lubricant.
Furthermore, we investigated the shear modification behavior of the two types of LDPE. For the purpose, we measured the melt strength of processed materials. Each LDPE sample with a small amount of thermal stabilizer was kneaded in a laboratory internal mixer (Toyoseiki, Labo-Plastomil) for 10, 30, and 120 min at a rotor rate of 30 rpm. The resin temperature was kept at 433 K. After kneading, we took out the sample from the internal mixer and cut into small pieces. Then we measured the melt strength using the capillary rheometer. Figure 1 shows a schematic diagram of the measurement. The strand extruded vertically downwards from the capillary rheometer (A) at 463 K was stretched by the rotating wheel (D) via the pulley (C) at a stretching rate of 5. Then the force was detected by the transducer (B) and recorded (E) as the melt strength. We used a die having 8 mm of length, 2.095 mm of diameter, and π/2 of entrance angle. Moreover, we measured the melt strength as a function of the residence time in the cylinder of the capillary rheometer, since the melt strength increases with the residence time. It should be notified that, because of the rapid increment of the resistance to elongational flow during the annealing, melt strength is more suitable than elongational viscosity by Meissner-type rheometer.
[Figure 1]
3. Results and Discussion
3.1. Dilute Solution Properties
Figure 2 shows the ratio of the intrinsic viscosity of the LDPE to that of the linear polymer at the same molecular weight, which is known as g’-factor or branching index, as a function of molecular weight.
[Figure 2]
The values for both LDPEs are much smaller than 1, demonstrating that the radius of gyration in the solvent is considerably smaller than that of the linear polymer. Further, the vessel LDPE shows smaller g’-parameter than the tubular LDPE. This suggests that the vessel LDPE has longer and/or more long branches. Furthermore, the deviation from the linear polymer is more pronounced with increasing the molecular weight for the tubular LDPE, which is in accordance with the literature.23
3.2. Oscillatory Shear Modulus
Figure 3 shows the master curves of the frequency dependences of shear storage modulus G′ and loss modulus G′′. The reference temperature is 433 K. The apparent flow activation energy ΔH, which is evaluated from the shift factor aT by the Arrhenius
equation, is 56 kJ/mol for the tubular LDPE and 53 kJ/mol for the vessel LDPE. Graessley and Raji demonstrated that ΔH of star-shaped polymers varies linearly with the arm length.26 Their result suggests that the activation energy will provide the information on the branch structure. In this study, however, there is no significant difference in ΔH between the two types of LDPE, even though ΔH of both LDPEs is quite larger than that of linear polyethylenes. As far as the present experiment is concerned, it seems that the flow activation energy is insensitive to the long chain branching structure, although g’-parameter is quite different from each other.
[Figure 3]
Figure 3 also indicates that G ′′ of the tubular LDPE is slightly higher than that
of the vessel LDPE in all measured region of frequency. This is reasonable because the tubular LDPE shows lower MFR. Moreover, both LDPEs show similar values of G′ in
the lower frequency region, whereas the tubular LDPE exhibits higher values in the moderate and higher frequency regions (ω aT > 10-1 s-1). When G′ is compared at the
vessel LDPE has broader distribution of relaxation times, which is attributed to the molecular weight distribution and long chain branching structure.
3.3. Steady-State Shear Viscosity
Figure 4 shows the shear rate dependence of steady-state shear viscosity η(
γ
& ) at 433 K. The results are combined which are obtained by the cone-and-plate and capillary rheometers. The shear viscosity data obtained by the capillary rheometer after the Bagley and Rabinowitsch corrections are consistent with those by the cone-and-plate rheometer. Moreover, the predicted values using the Cox-Merz equation27 also fit well with the experimental values of η(γ
& ). Further, the tubular LDPE gives slightly higher shear viscosity than the vessel LDPE in all the measured region of the shear rate.[Figure 4]
Figure 5 shows the entrance pressure drop ΔP evaluated by the Bagley plot as a
function of shear rate. The ΔP increases with increasing the shear rate owing to the effect
of the hydrostatic pressure. Moreover, the tubular LDPE shows larger values of ΔP than
the vessel LDPE, in accordance with the difference in the shear viscosity.
[Figure 5]
3.4. Stress Relaxation under Large Strain
Figure 6 shows the damping function h(γ) plotted against the shear strain. In the figure, the solid line represents the predicted value from the Doi-Edwards theory11 assuming the independent alignment approximation. Obviously, there is a marked difference in the magnitude of damping function. As well known, a comb-shaped branch polymer exhibits larger damping function in the early time region than the prediction of Doi-Edwards theory, because the chain contraction after a sudden step strain is suppressed at chain sections between the branch points.13-15 As a result, the damping
function of a linear and a star-shaped branch polymer, which can be expressed by the Doi-Edwards theory,7 is larger than that of a linear and a comb-shaped branch polymer. In this study, the damping function of the tubular LDPE is scattered around the prediction of the Doi-Edwards theory. Considering the dilute solution properties of both types of LDPE, the vessel LDPE has much more complicated branch structure with multiple branch points than the tubular LDPE. It is natural that the vessel LDPE gives quite higher value of h(γ) than the Doi-Edwards prediction. At present, it is not known why the tubular LDPE gives such low values of h(γ) as comparable with the theoretical prediction.
[Figure 6]
3.5. Uniaxial Elongational Viscosity
Figure 7 shows the time dependences of the uniaxial elongational viscosity obtained at various strain rates
(
εηE+ t,&
)
ε
&. The solid lines in the figure represent 3η+( )
t , where is the transient shear viscosity at the low strain rate asymptote calculated from the oscillatory shear moduli using an approximate equation proposed by Osaki et al.,28( )
t + η( )
t t[
G( )
G(
)
G( )
]
t / 1 200 . 0 2 / 12 . 1 = + = ′′ + ′ − ′ ωω
ω
ω
η
(1) [Figure 7]The uniform deformation of each sample is confirmed by observation of the change in the sample diameter with time. As seen in the figure, both samples show marked strain hardening and the elongational viscosity considerably deviates from 3 in the large strain region. Further, in case of the tubular LDPE, the presence of a maximum of strain-hardening with rate is clearly observed.
( )
t+
η
In Figure 8, the ratio ηE+
( )
t,ε& / 3η+( )
t is plotted against the strain ε at various strain rates. Both LDPEs hardly show upturn behavior in the strain region below 0.5,which is very different from those of polystyrene.25 Beyond the strain 0.5,
deviates from 3 . The vessel LDPE exhibits marked strain-hardening behavior at any strain rate in the experimental region. The pronounced stretching of molecular chain under the elongational flow and the suppression of chain contraction due to the multi-branch points in the vessel LDPE seem to give this pronounced strain hardening.
( )
ε ηE+ t,&( )
t + η [Figure 8]3.6. Biaxial Elongational Viscosity
Figure 9 shows the time dependences of the biaxial elongational viscosity of the LDPEs obtained at various strain rates
(
B B t εη + ,&
)
ε
&B. The solid lines in the figure represent 6 . As seen in the figure, the strain-hardening behavior is observed in both LDPEs, although the deviation from the low strain rate asymptote is weaker than that of the uniaxial elongational viscosity. Moreover, the difference in the magnitude of the upturn between the vessel LDPE and the tubular LDPE is not prominent. These experimental results indicate that less molecular stretching takes place under biaxial elongational flow in the measured region of the Hencky strain (small to moderate). It is also suggested that the biaxial elongational viscosity is less sensitive to the molecular structure than the uniaxial viscosity.6,25,29( )
t+
η
[Figure 9]
3.7. Shear Modification
When polymers with long chain branches, such as LDPE and ethylene-vinyl acetate copolymer, are subjected to shear stress, some rheological properties vary drastically even though the primary molecular characteristics do not change. The phenomenon has been known as “shear modification”.8-10 The origin of this modification is considered as a result of an alignment of side chains along the backbone chain.10 In
other words, shear history changes the topological feature in the melt owing to the disentanglement of temporary couplings associated with long chain branches. Moreover, exposure to annealing makes the rheological properties recover to the initial values owing to Micro-Brownian motion.
Münstedt demonstrated that upturn behavior in uniaxial elongational viscosity of LDPE is quite depressed by shear history, whereas the shear viscosity remains constant.30 The result means that the molecular stretching is suppressed in the sample with the shear history. In this study, we evaluated the shear modification behavior by melt strength, which is defined as the force needed for the extension of the polymer extrudate and correlates with the uniaxial elongational viscosity in some way,31,32 instead of elongational viscosity, because melt strength is more convenient for the evaluation of the thermal history prior to the measurement.
Figure 10 shows a relation between annealing time and the melt strength of the samples with various shear histories. Here, the annealing time corresponds to the residence time in the capillary rheometer at 463 K. The kneading time of 10, 30 and 120 min in the internal mixer imposes the different shear histories. It should be noted that, prior to the kneading procedure, the melt strength is 75 mN for the tubular LDPE and 140 mN for the vessel LDPE.
In the short annealing time region, the melt strength of the vessel LDPE with the kneading time of 30 and 120 min is quite smaller than that of the tubular LDPE. The result demonstrates that the melt strength of the vessel LDPE diminishes to a great extent by the kneading procedure, i.e., shear history. Further, with increasing the annealing time, the melt strength of the vessel LDPE increases rapidly and becomes larger than that of the tubular LDPE. The melt strength of the vessel LDPE does not show a plateau even after 30 min of annealing time. On the other hand, the tubular LDPE shows the plateau value which agrees with that of the unkneaded sample.
Molecular alignment of the long chains, i.e., two or more branches or molecular segments in the same “tube”, is considered to be a main origin for the depression of the melt strength, because the chain contraction takes place easily owing to the reduction of “active” long chain branches for the molecular stretching. The molecular alignment makes the relaxation time shorter, which will also contribute to the depression of the melt
strength. Furthermore, the increase in the melt strength with the annealing time suggests that exposure to annealing changes the molecular conformation from the high-enthalpy state of the samples with the shear history. This indicates that micro-Brownian motion enhances the entanglement couplings associated with long chain branches. Moreover, it should be noted that the sample with longer kneading time takes longer annealing time to recover the plateau value. This is reasonable because larger shear history makes the long chain branches align to a great degree. Furthermore, assuming the hierarchical branch structure, longer shear history makes deeper branches align. Consequently, it takes longer time for the recovery. Thus the effect of the kneading time will give us the information on the hierarchical structure of branching. In the following paper, the effect of shear stress and duration of shearing on the rheological properties of an LDPE is discussed in detail quantitatively.33
As shown in the figure, the vessel LDPE is more sensitive to the shear history than the tubular LDPE. This indicates that the unkneaded vessel LDPE has longer and/or more “active” long chain branches than the tubular LDPE. This suggestion corresponds to the differences found in the experimental results of g’-parameter, uniaxial elongational viscosity, and damping function. Further, the effect of the kneading time is more pronounced for the vessel LDPE, indicating that the vessel LDPE has more hierarchical and complicated branch structure. Moreover, it can be concluded that the characterization of the shear modification will provide useful information on the molecular structure of polymers with long chain branches.
[Figure 10]
4. Conclusions
Various rheological properties have been studied for two kinds of LDPEs having similar shear viscosity. The one is produced by tubular process and the other is by vessel process. The flow activation energy does not reflect the difference in the molecular structure between them, even though both LDPEs show larger values than linear
polyethylenes. The damping function of the tubular LDPE is well expressed by the Doi-Edwards theory, from unknown reasons. On the other hand, the vessel LDPE exhibits larger value than the Doi-Edwards’ prediction, reflecting the complex hierarchical branch structure of the vessel LDPE.
The uniaxial elongational viscosity data are consistent with the results of stress relaxation measurements. The vessel LDPE exhibits marked upturn deviation from the low strain rate asymptote. On the other hand, the tubular LDPE shows less strain hardening, although both LDPEs exhibit strain hardening in the strain region above 0.5. The results indicate that the chain stretching takes place easier for the vessel LDPE owing to the existence of multiple long chain branches in a molecule. These long chain branches will lead to the suppression of the chain contraction after sudden deformation. In the biaxial elongational viscosity data of the two types of LDPE, however, there appears less difference in the strain-hardening behavior.
Finally, the effect of the shear history on the melt strength is found to be very sensitive to the structural difference. The large difference found in the melt strength suggests that the vessel LDPE has more complicated and hierarchical branch structure than the tubular LDPE.
References
1. Porter RS, Knox JP, Johnson JF, Trans Soc Rheol 1968; 12: 409. 2. Wagner MH, Laun HM, Rheol Acta 1978; 17: 138.
3. Yamaguchi M, Abe S, J Appl Polym Sci 1999; 74: 3153. 4. Meissner J, Raible T, Stephenson SE, J Rheol 1981; 25: 1. 5. Meissner J, Rheol Acta 1994; 33: 1.
6. Wagner MH, Bastian H, Hachmann P, Meissner J, Kurzbeck S, Münstedt H, Langouche F, Rheol Acta 2000; 39: 97.
7. Osaki K, Rheol Acta 1993; 32: 429. 8. Hanson DE, Polym Eng Sci 1969; 9: 405.
9. Rokudai M, Mihara S, Fujiki T, J Appl Polym Sci 1979; 32: 3289. 10. Leblans PJR, Bastiaansen C, Macromol 1989; 22: 3312.
11. Doi M, Edwards SF, The Theory of Polymer Dynamics, Clarendon, Oxford, 1986.
12. Wagner MH, Schaeffer J, J Rheol 1993; 37: 643. 13. Roovers J, Macromol 1984; 17: 1196.
14. McLeish TCB, Macromol 1988; 21, 1062.
15. McLeish TCB, Allgaier J, Bick DK, Bishko G, Biswas P, Blackwell R, Blottiere B, Clarke N, Gibbs DJ, Hakiki A, Heenan RK, Johnson JM, Kant R, Read DJ, Young RN, Macrmol 1999; 32: 6734.
16. McLeish TCB, Larson RG, J Rheol 1998; 42: 81.
17. Blackwell RJ, McLeish TCB, Harlen OG, J Rheol 2000; 44: 121.
18. Inkson NJ, McLeish TCB, Harlen OG, Groves DJ, J Rheol 1999; 43: 873. 19. Read DJ, MacLeish TCB, Macromol 2001; 34: 1928.
20. Kuhn R, Kromer H, Rosmanith G, Angew Makromol Chem 1974; 40: 361. 21. Scholte TG, Meijerink NLJ, Br Polym J 1974; 133: 9.
22. Kuhn R, Kromer H, Colloid Polym Sci 1982; 260: 1083. 23. Tackx P, Tack JCJF Polym 1998; 39: 3109.
24. Shiroyama K, Koubunshikagaku 1971; 28: 161.
26. Graessley WW, Raju VR, J Polym Sci Polym Symposium 1984; 71: 77. 27. Cox WP, Merz EH, J Polym Sci 1958; 28: 619.
28. Osaki K, Murai A, Bessho N, Kim BS, J Soc Rheol Jpn 1976; 4: 166. 29. McKinley GH, Hassager O, J Rheol 1999; 43: 1195.
30. Münstedt H, Colloid Polym Sci 1981; 259: 966.
31. Micic P, Bhattacharya SN, Field G, Polym Eng Sci 1998; 38: 1685. 32. Yamaguchi M, J Polym Sci Polym Phys Ed 2001; 39: 228.
Figure Caption
Figure 1 Schematic diagram for the measurements of melt strength. (A) capillary rheometer; (B) transducer for detecting torque; (C) pulley; (D) pulling wheels; (E) recorder.
Figure 2 Molecular weight dependence of g’-factor for tubular LDPE (open circles) and vessel LDPE (closed symbols).
Figure 3 Master curves of frequency dependences of shear storage modulus G ′
(circles) and loss modulus G ′ ′ (diamonds) at 433 K for (a) tubular LDPE (open symbols) and (b) vessel LDPE (closed symbols).
Figure 4 Steady-state shear viscosity η(
γ
& ) at 433 K for (a) tubular LDPE (open symbols) and (b) vessel LDPE (closed symbols). In the figure, circles denote the experimental values by the cone-and-plate rheometer, diamonds those by the capillary rheometer, and lines the predicted values using the Cox-Merz relation.Figure 5 Entrance pressure drop ΔP at various shear rates
γ
&
for tubular LDPE (open circles) and vessel LDPE (closed circles) at 433 K.Figure 6 Damping function h(γ) for tubular LDPE (open circles) and vessel LDPE (closed circles). The solid line represents the predicted values by the Doi-Edwards theory.
Figure 7 Time dependences of uniaxial elongational viscosity for (a) tubular LDPE and (b) vessel LDPE at various strain rates. Solid line denotes the low strain rate asymptote 3
(
ε ηE t,& +)
( )
t + η .Figure 8 Deviation from the low strain rate asymptote 3η+
( )
t of the uniaxialelongational viscosity ηE
( )
t,ε&+
as a function of strain for (a) tubular LDPE and (b) vessel LDPE at various strain rates.
Figure 9 Time dependence of biaxial elongational viscosity for (a) tubular LDPE and (b) vessel LDPE at various strain rates. Solid line denotes the low strain rate asymptote 6
(
B B t ε η+ ,&)
( )
t + η .Figure 10 Growth curves of melt strength as a function of the annealing time in the capillary rheometer at 463 K; (a) tubular LDPE and (b) vessel LDPE. The numerals denote the kneading time in the internal mixer at 433 K.
Table I Molecular Weights
Mn Mw Mz
tubular LDPE 1.9 x 10⁴ 7.5 x 10⁴ 1.8 x 10⁵ vessel LDPE 2.6 x 10⁴ 2.1 x 10⁵ 6.7 x 10⁵
Table II Number of Branches per 1000 Backbone Atoms
propyl butyl pentil hexyl or more
tubular LDPE 1 5 2 2