Japan Advanced Institute of Science and Technology
https://dspace.jaist.ac.jp/
Title
The power flow coloring: Giving a unique ID to a
power flow from a specific power source to a
specific power load
Author(s)
Javaid, Saher; Kurose, Yuhei; Kato, Takekazu;
Matsuyama, Takashi
Citation
IEICE Technical Report
Issue Date
2015-12
Type
Conference Paper
Text version
publisher
URL
http://hdl.handle.net/10119/15299
Rights
Description
Singapore-Japan Joint Workshop on Ambient
Intelligence and Sensor Networks
This article is a technical report without peer review, and its polished and/or extended version may be published elsewhere.
Copyright ©2015 by IEICE
The Power Flow Coloring: Giving a Unique ID to a Power Flow from a
Specific Power Source to a Specific Power Load
JAVAID Saher KUROSE Yuhei KATO Takekazu MATSUYAMA Takashi
Graduate School of Informatics, Kyoto University, Kyoto 6068501
E-mail: {saherjavaid, tkato, tm}@i.kyoto-u.ac.jp, kurose@vision.kuee.kyoto-u.ac.jp
Abstract The increasing number of renewable energy sources requires new approaches for the management of the
electricity grid in order to sustain or even to improve the power supply quality. Furthermore, liberalization of the grid leads to the variety of energy suppliers; therefore, trading of energy and power is becoming imperative. In these modern environments, it has become much more important to identify which power sources or suppliers are providing power to a specific load, how much each power source or supplier is occupying power line usage, and what is the contribution of each supplier to the overall system. This paper implements the power flow coloring, by giving a unique ID to each power flow between a specific power source and a specific power load. It enables us to design versatile power flow patterns between distributed power sources and loads while keeping the stability of the Nano-grid (NG). To implement the power flow coloring we propose a cooperative distributed control method, where a time-slot based feedback control is introduced to cope with power fluctuations. Experimental results show the effectiveness of proposed system in managing fluctuating loads.
Keywords Power flow coloring, Cooperative distributed control, i-Energy, Energy on demand, Demand-side management
1. INTRODUCTION
1.1 Background
The growth in population and the modernization of living environments across the globe are affecting significant increase in power demand. This increased power demand can only be met through energy generation from a diverse set of power sources establishing the potential in terms of cost, stability and effects on the environment [1] [2]. The increasing number of renewable energy sources requires new approaches for the management of the electricity grid in order to sustain or even to improve the power supply quality. The recent growth of renewable energy sources and energy storage devices in electrical grids will progressively raise the network performances while allowing full utilization of distributed power generation.
In addition, the power system operation faces new changes due to deregulation and reforming of electricity market [3]. More concretely, power market among independent power suppliers is likely to be a more serious and ongoing concern than has been anticipated by most observers. Hence, the roles of transmission capacity and demand-side elasticity are likely to be even more important than previously suggested. These social renovations allow people to purchase electricity from a particular power supplier and sell electricity to a particular power consumer.
As a result of these trends, there has been an increasing emphasis on the development and deployment of distributed generators and consumers can now select their
power sources or suppliers. Hence it is important to know which power source or supplier is providing power to a particular power load, which portions of the power transmission line are being used by individual power source, and how much individual power source contribute to the overall system. In comparison with the traditional unidirectional power flow from existing grid, the diversity of distributed power generation urge power users to think about power sources and its suppliers.
1.2 Grid Parity
Grid parity has increased the importance of renewable power sources. Grid parity arises when the cost of generated power from alternative power source is equal to the price of purchasing power from the electricity grid. This term is mostly used with the renewable power sources notably solar and wind power.
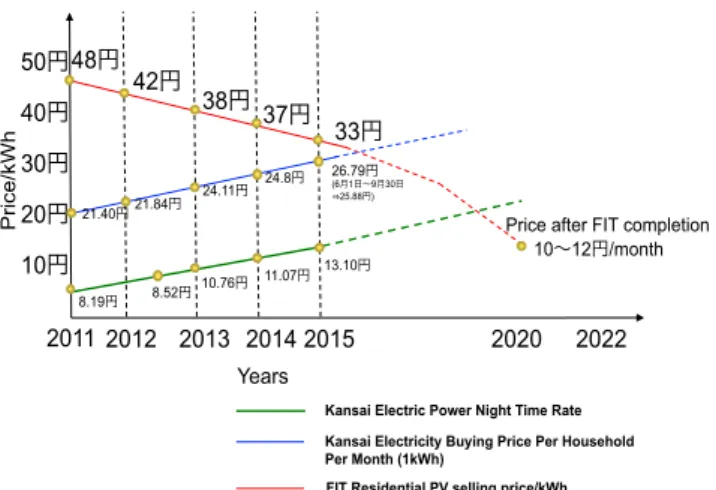
Fig. 1: Comparison Between Selling Price of Electricity form Residential PV and Utility Rate
8.19円 24.8円 42円 38円 37円 33円 2012 2013 2014 2015 2020 2022 10円 20円 30円 40円 50円
Price after FIT completion 10∼12円/month
21.40円 21.84円 24.11円
11.07円 13.10円 10.76円
Kansai Electric Power Night Time Rate 2011 48円 8.52円 26.79円 (6月1日∼9月30日 25.88円) Years Pri ce /kW h
Kansai Electricity Buying Price Per Household Per Month (1kWh)
Since 2011 Fukushima nuclear disaster in Japan, the importance of renewable energy sources specially solar power to the country’s power supply has increased. In 2011, Renewable Energy Act came into effect to promote development and operation of renewable energy sources. This introduced act so called FIT (feed-in-tariff) which require utility companies to purchase set amounts of solar, wind, geothermal, hydropower and biomass energy at high rates. These guaranteed rates were among the world’s highest and used to revise every year. In July 2012, the official FIT was announced, the time duration for both post FIT (2011-2020) and FIT (2012-2021) was fixed to ten years. In Fig. 1, the selling price of electricity from residential solar PV is compared with the electricity rate from utility grid. The favorable rate of 48 JPY/kWh in 2011 was an exciting invitation for private sector investment. The selling price of residential PV revised four times: to 42 JPY/kWh, 38 JPY/kWh, 37/kWh and again to 33/kWh in the years 2012, 2013, 2014 and 2015 respectively. According to the situation in 2011, the selling price of electricity from residential PV was indeed high as compare to the electricity rate, but the selling price has continued to fall. In current situation, the selling price of electricity from residential PV is decreased and came closer to the electricity rate of utility. After ten years with the completion of post FIT and FIT, the selling price of electricity from residential PV is estimated to reduce to 10-12 JPY/kWh. In this situation, the selling price of electricity from residential PV would be less than the utility rate by Electricity Trade. Hence, It would be preferable to utilize generated power from residential PV for household power usage rather than selling to utility.
The households under post FIT already recovered charges for initial installation cost of PV in addition to the amount usually charged for the supply of electricity from utility. After ten years, still they can get benefit without any investment cost. In Japan, the electricity is supplied from utility company. The cost of transmission, distribution, other expenses and taxes increases the total cost aside from the generation cost of power. Electricity bills charged to consumers ultimately include these various costs as well as the profit for the utilities. When a person privately installs a solar PV system at residence, no cost for transmission or distribution is required if the electricity is consumed directly at the site, and no payment is required to utilities either, as the power is not purchased through them. It means that the cost for using electricity generated by solar PV is comprised only of the installation
and maintenance costs of the solar PV system.
In order to use generated from residential PV, consumers need to have a method for self-sufficient power management for fluctuating power sources and loads. Consequently, people will manage power by themselves in the near future.
1.3 Introduction of the Concept of The Power
Flow Coloring
The integration of renewable energy sources, liberalization of the grids and realization of grid parity leads to the introduction of variety of energy suppliers/power generators, therefore, trading of energy and power is becoming imperative. In these modern environments, it has become much more important to identify which power sources or suppliers are providing power to a specific load, how much each power source or supplier is occupying power line usage, and what is the contribution of each supplier to the overall system.
In order to develop sophisticated systems with diverse components and versatile functions, it is a crucial and fundamental requirement to give a unique ID to each basic entity such as IP addresses in the Internet, social security numbers in welfare and health care systems etc. In [4], [5], the concept of the Power Flow Coloring is proposed, which attaches the unique identification to each power flow between a pair of power source and load. While the concept of the power flow coloring can be applied to any types of grids, this paper focuses on the power flow coloring over a Nano-grid (NG). This is because the structure of residential and commercial areas will be changed drastically due to the development of such distributed power sources [6], [7]. A Nano-grid (NG) includes power generating sources, an in-house power distribution system, and energy storage functions as well as a variety of appliances such as lighting, TV, heating/ventilation/air conditioning, and cooking.
Fig. 2: The Power flow coloring Electric Power Line
Power Flow from Electric Grid to Appliances Power Flow from Storage Battery to Appliances
Power Flow from Solar Panel to Storage Battery and Appliances Source/Load Agent to Monitor and Control Power Flows
150W% 400W% 100W% 1050W% 50W% 500W% 900W% 1000W% Solar Power Generation Electric Grid Storage Battery 50W%
The development of fundamental technologies for implementing the power flow coloring can be facilitated in a NG consisting of a shared bus power line without complicated power control devices for transmission and distribution. Fig. 2 illustrates the power flow coloring over a NG in a house. It enables us to design versatile power flow patterns between distributed power sources and loads.
Note that as shown in Fig. 2, a power source can supply power flow streams to multiple loads and a load can be supplied power flow streams from multiple power sources. For example, watch a TV with the utility supplying power, use an air-conditioner with photovoltaic power, make coffee using power stored in a battery, and mix 60% photovoltaic power and 40% battery power to operate a heater. The power flow coloring can help in realizing the cost sensitive usage of power by evaluating power generation costs of power sources. The utilization of renewable energy sources to reduce atmospheric carbon dioxide would be another important motivation for the power flow coloring. Moreover, the power flow coloring
can manage power flow streams with diverse
characteristics. For example, the power generated by a photovoltaic is characterized by power fluctuations and available time periods. With the power flow coloring, a power with dynamic fluctuations can directly flow into a load, which can accommodate the fluctuations such as heaters and coolers without affecting the other power flows. Consequently, we are able to use variety of power sources with diverse characteristics over the NG.
This paper aims to implement power flow coloring over a NG with distributed power sources and fluctuating loads while keeping the voltage stability of NG. The rest of the paper is organized as follows; Section 2 surveys existing implementation methods of the power flow coloring and introduces our idea for the power flow coloring implementation. In Section 3, we propose a prototype system protocol for proposed cooperative distributed control method for the power flow coloring and basic message exchange protocol among power devices. To maintain the voltage stability of the NG and to cope with power fluctuations of loads as well as delays in message exchanges and computations and, Section 4 introduces system protocol with the master-slave role assignment and the time-slot based feedback control. In Section 5, the practicality of our implementation for the power flow coloring is demonstrated with experimental results. Section 6, gives the concluding remarks.
2. IMPLEMENTATION METHODS OF THE
POWER FLOW COLORING
With the advent of distributed power sources, a large number of new technologies of managing multiple power sources have been developed [8]–[11].
To integrate distributed power sources to the ordinary grid, a variety of power sharing schemes have been proposed [12], [13]. To achieve accurate power sharing while maintaining the voltage and frequency of a grid, there are two main types of control methods: centralized and decentralized. Centralized control based on a communication infrastructure [14], [15]. However, it is impractical to transmit dynamic data and control signal. The central controlling device should have the information of entire power network including (power sources and power loads). In order to overcome limitations of centralized control method, decentralized control methods are reported, which majorly applies droop control methods to integrate different power sources [16], [17] for current sharing. This type of control does not need communication infrastructure, which actually helps in increasing the robustness of the entire system. However, the power sharing schemes just coordinate multiple power sources to supply the total power consumed by a group of power loads and hence cannot discriminate individual power consumptions of the power loads as in the power flow coloring.
Since the concept of power flow coloring is attractive, there have been proposed several implementation methods that can be classified into three categories:
1. Power Line Switching
2. Power Routing (Store and Forward) 3. Synchronized Terminal Control
2.1 Power Line Switching
Okabe et al. in [18] proposed a matrix power line switch between a group of power sources and a group of loads. The system architecture for power line switching is shown in Fig. 3., which consists of power sources, loads, power router and power transmission lines. By setting the switch, a physical power line connection is established between a
Fig. 3: Power Line Switching
Power&Router Power&Loads Power&Sources
Power&Router Dedicated&Path
a power source and a load. While the control scheme is simple but only one-to-one and one-to-many connections can be realized between a power source and one or more power load(s). However, the control cannot be scaled up without changing the existing grid structure to handle many to one connection type because the voltage levels can vary for multiple power sources. The power fluctuation management is out of scope for the power line switching method.
2.2 Power Routing (Store and Forward)
Hikihara et al. [19] and Abe et al. [20] proposed power routing methods. The system architecture for power routing is described in Fig. 4. The system structure consists of multiple power sources, loads, power routers, storage battery and power transmission lines. They developed so-called power routers which receive, store, and transmit chunks of power, power packets, just in the same way as message packet routers: a chunk of power is associated with source ID and destination ID.
By introducing a multiplexing method, a simple power line can support multiple power packet transmissions. To realize this ID-based store-forward transmission, each power router should be equipped with a storage battery, which requires mass investments for the routing methods to be implemented in the existing grid. This control method can support one–to-one, one-to-many connection and also many-to-many connection types between power source(s) and power load(s). However, this method does not have explicit control method to cope with power fluctuations.
Additionally, this implementation method aims to encapsulate power fluctuations caused by large-scale renewable energy integration to the national wide grid not for small-scale power generation. Moreover, since they focus on the power routing, no mechanism to control distributed power sources and loads is introduced. This method can cause EMC problems due to power variations.
Fig. 4: Power Routing Method (Store and Forward)
2.3 Synchronized Terminal Control
The proposed cooperative distributed control method for the power flow coloring in this paper can be characterized into the synchronized source-load control method, whose advantage is that it can be used not only inside a household but also over the existing grid without mass investments. That is, our method focuses on the terminal (power sources and loads) control.
To implement the synchronized source-load control, we introduce a cooperative distributed control method consisting of power sources, power loads, power source agents and power load agents. All power agents (i.e., power source agent and load agent) communicate with each other to realize the power flow coloring. In our proposed implementation method, a power agent (i.e. source agent, or load agent) is attached to each power
source and load, which measures and control
supply/consume power of the attached power device. Our proposed method uses master and slave architecture to maintain the voltage stability of NG. Hence, the proposed implementation method for the power flow coloring can manage fluctuating power sources and loads while keeping the voltage stability.
If power supply and/or consumption were constant, there would be no problem in proposed implementation. Thus, we introduce a time slot based feedback control (TSBFC) method to cope with the power fluctuations (see Fig. 5). When the power consumption of a load fluctuates, its associated power load agent measures the power fluctuation and sends that data to its power supplying agent(s), which then controls the amount of power supply. This paper basically assumes that all power sources are controllable and power loads are fluctuating. But when we
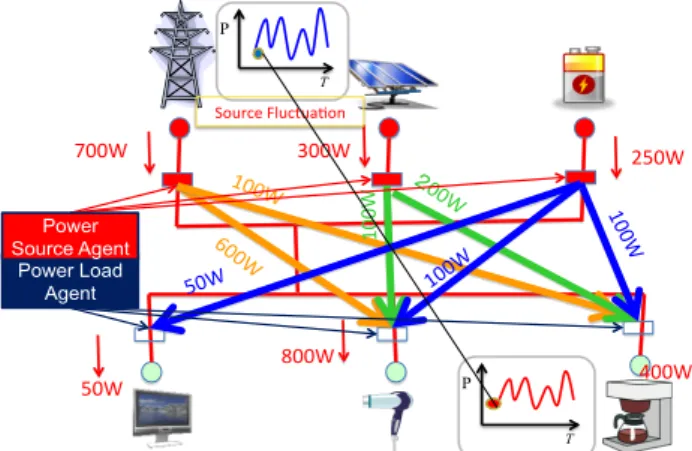
Fig. 5: Co-operative Distributed Control with Fluctuating Power Loads
Power&Sources Power&Loads Power&Packet&from&U3lity&& Power&Source Power&Packet&from&PV&& Power&Source Shared&Power&Line Power&Router 800W 400W 50W 250W 300W 700W 600W 100W 100W 00W 50W 100W 100W Power Load Agent Power Source Agent Load/Fluctua5on/ P T P T
have controllable power loads such as heaters, fluctuating power sources can be easily managed by a “reversed” TSBFC: power sources and loads in the proposed TSBFC are replaced with each other. When the power supply fluctuates, its associated power source agent informs the fluctuation to its related power load agent(s) so that their power consumptions match with the fluctuating power supply (see Fig. 6).
Fig. 6: Co-operative Distributed Control with Fluctuating Power Sources
Note that with a power controllable load such as a heater, the proposed implementation method can be easily augmented to manage a fluctuating power source such as a photovoltaic. The details of reversed TSBFC would be discussed in new paper.
While some readers may recognize similarities between the popular consignment power supply and the power flow coloring, they differ in the following points:
Real-timeness: Since the former manages volumes of power supply and consumption, real-time power control is not required. The latter, on the other hand, controls instantaneous power supply and consumption in real-time. More specifically, the system proposed in this paper uses three different time responses based on the control hierarchy of the system: microscopic, mesoscopic, and macroscopic levels. The micro-level time response or hardware level uses 16.3 milliseconds control intervals to manage AC power and voltage [21]. The meso-level time response shows the communication interval of one-second among distributed power sources and loads. The macro-level time response indicates operation mode changes of power loads by human, which can take several minutes or more.
Stability Control: In the former, since the amount of power for the consignment power supply is far small
compared to the base power managed, no additional control mechanism need to be introduced for the consignment power supply. In the latter case, however, since power flows to be managed over a NG are similar in their volumes, a sophisticated stability control mechanism should be developed at the same time as the power flow design. The system proposed in this paper employs a master-slave role assignment scheme to maintain the voltage stability of the NG against unexpected power fluctuations by power loads.
Power Fluctuation Management: Thanks to the real-time power control, the power flow coloring can manage dynamically fluctuating power sources and loads as described above, which is out of scope of the consignment power supply.
Specification of Arbitrary Power Supply Mixture: As described before, the power flow coloring can manage power flows from multiple power sources to one load. That is, a home user can specify how much power from which source is to be supplied for a particular power load taking into account energy availability, cost, and carbon dioxide emission.
3. PROTOTYPE SYSTEM PROTOCOL
In this section, prototype of system protocol for the implementation of the power flow coloring over a NG with fluctuating power loads is proposed. A PS is an electric device, which can supply electric power e.g. solar panel, wind turbine and utility company. The PSs are considered with unique identifiers such as !"!!(! ∈ ! {1,2, … , !}) where
! is the total no. of PSs. A set of PLs is also considered: a PL is an electric device that consumes electric power supplied by the PS(s). The proposed system comprises of ! PLs with identifiers !"!!(! ∈ ! {1,2, … , !}). To specify,
monitor, and maintain the overall power flow pattern, two
Fig. 7: Prototype System Protocol 800W 400W 50W 250W 300W 700W 600W 100W 100W 00W 50W 100W 100W Power Load Agent Power Source Agent P T Source1Fluctua6on1 P T PS1 EOD Manager Power Flow Manager (PFM) PS2 SA1 SA2 … … SAM PSM PL1 LA2 LAN PLN LA1 PL2 … …
SA = Source Agent M = Total no. of SA(s) and PS(s) PS = Power Source N = Total no. of LA(s) and PL(s) LA = Load Agent Electric Power Line PL = Power Load Communication Line
types of power managers are introduced (see Fig. 7). The Energy on Demand (EoD) manager conducts overall power management over the NG. It mediates all power demands required by loads based on the EoD protocol [22], [23] and designs the overall power flow pattern (i.e. the power flow specification (PFS)) specifying which PS should supply how many Watts to which PL:
!"# = !!! !!" ⋮ !!! !!" !!! ⋮ !!! …1 …1 ⋱1 …1 !!! !!! ⋮ !!"
where, !!" denotes the nominal power (in Watt) supplied
from !"ℎ PS to !"ℎ PL. Then, PFS is forwarded to the power flow manager (PFM), which monitors and co- ordinates SAs and LAs to maintain the specified PFS. The nominal power value specified in PFS is just a reference and hard to maintain physically. To bridge between this nominal and physical power values, PFM converts a given PFS into the power supply ratio (PSR) as follows:
!"# = !!" = !!" !!" ! !!! !!" ! !!! = 1 for all !,
where !!" denotes the nominal power supplied from !"ℎ
PS to !"ℎ PL and !!" is PSR supplied from !"ℎ PS to !"ℎ
PL. The PFM sends PSR to all SAs so that PSR is preserved against any power fluctuations by loads.
4. PROPOSED SYSTEM PROTOCOL
To deal with practical situations, there is a need to manage power fluctuations of power devices. Here power fluctuations include both noisy fluctuations and power variations. Noisy fluctuations are physical power fluctuations due to the nature of power sources and loads. On the other hand, power variations are caused by operation mode changes of PSs/PLs (e.g. ON/OFF status changes, low power to/from high power supply/ consumption etc.). The system protocol proposed in this paper is designed to manage real-time power fluctuations of PLs alone. To implement such management, a time-slot based feedback control method is introduced into the basic system protocol: it maintains the specified PSR even if consumed powers by PLs fluctuate unexpectedly due to noise and vary a lot by their operation mode changes. Even if power fluctuations are confined to those by PLs, the power fluctuation management leads us to another augmentation. That is, there is a need to introduce a
mechanism to maintain the voltage stability of the NG against physical power fluctuations. For this purpose, the master and slave role assignment scheme is introduced among SAs. The third augmentation is required to cope with communication and computation delays by SAs and LAs. This is essential in real world for power management because electrical devices operate continuously.
As will be described later, the time-slot based feedback control method can be designed to hide communication and computation delays in a systematic way. In summary, the augmented system protocol should satisfy at least the following three requirements to work in the real world: • Maintain the voltage stability of the NG
• Maintain the specified PSR against power fluctuation
• Cope with communication and computation delays
4.1 Master and Slave Architecture
To maintain the voltage stability of the NG against power fluctuations, the master and slave role assignment scheme has been proposed among SAs. One of the SAs is selected as the master that operates as voltage and phase sources. Master SA supplies and absorbs any amount of active power (fluctuation) to maintain the voltage level of the NG. The internal power control device as well as its corresponding PS of the master SA should be equipped with enough physical functions and power supply capacity to fulfill the role of the master. A utility power line or a large-scale storage battery is a candidate of the master SA. Note that while the current implementation is designed for an AC power NG, it manages the active power alone and is to be augmented further to manage the reactive power. All SAs except the master operate as slaves. They work as active power sources and supply specified powers without caring about any power fluctuations.
4.2 Time-slot Based Feedback Control (TSBFC)
Method
Since the voltage stability is maintained by the master SA, it is necessary to develop a method to solve the remaining two problems: cope with unexpected power fluctuations of PLs while keeping the specified PSR and make the power management operate continuously without being affected by communication and computation delays. Hence, TSBFC is developed to solve these problems in a systematic way. Note that TSBFC is conducted by all slave SAs and no explicit power control to comply with the specified PSR is conducted by the master SA.
4.2.1
Time-slot and Protocol Description
First, the time axis is partitioned into a series of time-slots (TSs) with a fixed length and the operation
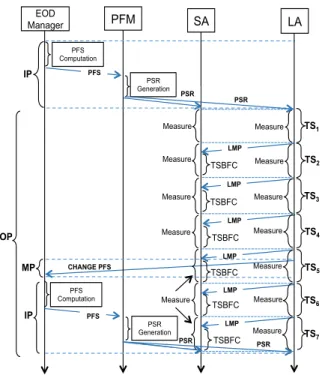
Fig. 8: Proposed System Protocol
phase (OP) is represented by a series of !"!!(! = 1,2 … )
(see Fig. 8). While in what follows it is assumed that all SAs and LAs share the common time axis, the augmented system protocol accommodates small discrepancies among local clocks in SAs and LAs. That is, SAs and LAs can run asynchronously based on their internal clocks without exchanging any synchronization messages.
At the very beginning, the first initialization phase (OP) is conducted by the EoD manager and PFM. Then PFM broadcasts the PSR to all SAs and LAs to start the OP. The first TS of the OP is TS!. During TS!, all LAs and SAs
just measure power consumptions by their corresponding PLs and power supplies by their corresponding PSs respectively. That is, no power control is conducted in !"!.
Since TSBFC can cope with large power variations keeping the specified PSR, it is assumed that all PLs are OFF at the beginning of the operation phase and switched ON later in the operation phase.
In !"!, each LA sends the average power consumption
value (Watt) in !"!, to all SAs that supply powers to that
LA, while keeping the power consumption measurement in !"!. This message transmission is shown as load measured
power (LMP) message in Fig. 6. When each SA receives the average power consumption data in !"! from its
corresponding LAs, it calculates the target power level to supply for the next TS (i.e., !"!) while keeping the power
supply measurement in !"!. The target power level
computation algorithm will be described later. Note that
no power control is conducted in !"! either.
In !"!!!! ≥ 3, each LA measures its power consumption
during !"!!and !"!!! reports it to all SAs that supply
power flow streams to it. Each SA (except the master SA), on the other hand, collects power consumption data in !"!!!!from all LAs, which are supplied power from that
SA and computes the target power level to supply in !"!.
These message receipt and computation are conducted during !"!!!!while the power supply according to the
target power level for !"!!!!!as well as the power supply
measurement in !"!!!! are being continued.
4.2.2
Feedback Control Method
Here, the algorithm for each slave SA is addressed to compute the target power level for !"!!! ≥ 3 , which
realizes the feedback control to maintain the specified PSR against unexpected power fluctuation. Note that the algorithm processes average power consumption and supply levels in !"! instead of instantaneous power
levels. Let !!,!! denotes the average power consumption
by !"! in !"! and !!,!! is the average power supply by
!"! in !"!. As described above, the target power level
!!,! of !"! for the next time-slot !"! is calculated
based on the power consumption and supply data measured in !"!!!. This computation is done during !"!!!.
To implement the feedback control, there is a need to evaluate the difference between the actual power supply by !"! in !"!!!, !!,!!!! , and the actually consumed
powers in !"!!!!by such LAs that received power from
!"!. Then, this difference should be compensated in !"!.
So, this difference is denoted as !!,! meaning the
compensation factor for !"!, which is defined as follows:
!!,!= !!"∙ !
!!! !!,!!! ! + !
!,!!!− !!,!!!! !!!!!!!!!!!!!!!!!! 1
where !!,! denotes the PSR specified for !"! by PFM.
Note that for all slave !"!, !!,!= !!,!= 0 because no
power control is conducted in !"! or !"!. Then, the
target power level (!!,!) of !"! for the next time-slot !"!
is defined as !!!!!!!!!!!!,!= !!"∙ ! !!! !!,!!! ! + ! !,!!!!!!!!!!!!!!!!!!!!!!!!!!!!! 2
Here again !!,!= !!,!= 0 since no power control is
conducted in !"! and !"!. In this definition, we assume
all LAs will consume the same amount of power in !"! as
that measured in !!!!!.
5. EXPERIMENTAL RESULTS
To show that the proposed system works in real physical environments, at first a power distributer module is developed. It consists of a bidirectional AC-DC converter, PSR PSR TSBFC TSBFC TSBFC Measure LMP PSR TSBFC LMP Measure LMP Measure LMP TSBFC LMP SA PFM EOD Manager IP OP MP CHANGE PFS TS1 IP TS2 LA LMP PFS PFS Computation PSR PSR Generation Measure Measure Measure Measure Measure TS3 TS4 Measure TS5 TS6 Measure TSBFC Measure PFS Computation PFS PSR Generation TS7 Measure
Fig. 9: Physical Environment Setup
a microprocessor, and a ZigBee wireless communication device. As for technical details of the power distributer module, please refer to [21].
Fig. 9 illustrates the physical and experimental settings for a grid-off mode operation of our system, where a pair of DC power storage batteries is used as independent power sources. Each battery is connected to a common AC 100V power line via a power distributer. On the other hand, two loads are connected to the common AC 100V power line via smart taps, power sensors with embedded microprocessors and ZigBee wireless communication devices, respectively. As shown in Fig. 9, an oscilloscope is used to measure detailed fluctuations of power supply and consumption. Moreover, in the following experiments, a pair of programmable power load devices was used instead of ordinary appliances.
The following results show typical characteristics of the proposed system. PSR and the master-slave assignment are specified manually. That is the experimental setup does not include the EoD manager or PFM. The PS1 acts as
master SA and PS2 acts as slave SA. SA1 supplies 50%
power to LA2 while SA2 supplies 100% power to LA1 and
50% power to LA2. Then PSR can be represented as,
!"# = 0 0.5 1.0 0.5
It means the supply power should be PS1 = 0.5PL2 and
PS2 = PL1 + 0.5PL2 respectively. The duration of time slot
for TSBFC is set to TS= 1sec. At the starting time of the experiment, both PL1 and PL2 are switched OFF. Then as
illustrated in Fig. 10, PL1 (red line in Fig. 10) is switched
ON, continues working for a while, and then switched OFF manually. PL2 (green line in Fig. 10) on the other hand, is
switched ON after PL1 is switched OFF.
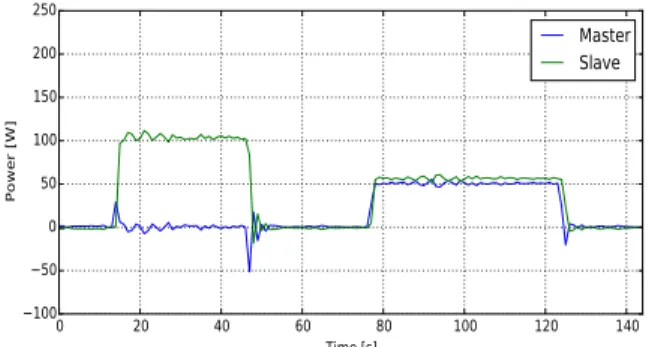
Fig. 11 illustrates dynamic profiles of power supplies by SAs. When PL1 is switched ON, slave SA (i.e. SA2,
green line in Fig. 11) supplies 100% power to PL1 as
specified in PSR. Since the power consumption by PL1
changes largely, the power supply by SA2 oscillates for
several time slots as illustrated in Fig. 11. This oscillation is introduced by TSBFC conducted by SA2. Then master
SA, SA1 automatically stabilizes the oscillation by
maintaining the voltage level of the NG as shown by the blue line in Fig. 11.
That is, the electric bulb of PL1 does not cause any
flickering. The same stabilization effects by master SA can be observed when PL1 and PL2 are switched ON or
OFF in Figs. 10 and 11. When PL2 is switched ON, both
SA1 and SA2 supply 50% power respectively following the
specified PSR. Figs. 10 and 11 prove that the power supply to a specific load from multiple power sources can be realized stably, i.e. no power oscillation is observed as shown by the green line in Fig. 10 and PSR is maintained, i.e., both source agents supply 50% power as shown by overlapping blue and green lines in the Fig. 11.
Fig. 10: Power Consumption by Loads (PL1 and PL2)
Fig. 11: Power Supply from PSs (Master and Slave)
6. CONCLUDING REMARKS
This paper proposed a cooperative distributed control method to implement the power flow coloring over a NG with fluctuating loads while keeping the stability of the NG. The power flow coloring gives a unique ID to each individual power flow from a specific power source to a specific power load. It enables us to design versatile Power& Source& Power& Source&& Source& Agent&& Source& Agent&& Load&Agent& Power&Load&
power flow patterns between multiple power sources and loads.
The experimental results demonstrated the proposed method can (i) maintain physical power stability, (ii) keep the specified PSR (power supply ratio) against power load fluctuations and variations, and (iii) accommodate communication and computation delays.
References
[1] T. F. Garrity, “Getting smart,” IEEE Power Energy Mag., vol. 8, no. 2, pp. 38-45, 2009.
[2] S. Keshav and C. Rosenberg, “How internet concepts and technologies can help green and smarten the electrical grid,” Proc. ACM Sigcomm Green Netw., pp. 35-40, 2010.
[3] J. Driesen, and R. Belmans, “Distributed generation: challenges and possible solutions,” IEEE Power Eng. Soc. General Meeting, 2006.
[4] T. Matsuyama: “Creating safe, secure, and envir- onment friendly lifestyles through i-Energy,” New Breeze, vol. 21, no. 2, pp.1-8, 2009
[5] T. Matsuyama: “i-Energy: Smart demand-side energy management,” Chapter 8, Smart Grid Applicat. and Develop., Springer, 2014.
[6] M. C. Kinn, “Proposed components for the design of a smart Nano-Grid for a domestic electrical system that operates at below 50V DC,” IEEE PES Int. Conf. and Exhibition on Innovative Smart Grid Tech. (ISGT Europe), pp. 1-7, 2011.
[7] J. Schonberger, R. Duke, and S. D. Round, “DC-Bus signaling: a distributed control strategy for a hybrid renewable Nano-grid,” IEEE Trans. on Ind. Electron., vol.53, no.5, pp.1453-1460, 2006.
[8] J. Han, C. Choi, W. Park, I. Lee, and S. Kim, “Smart home energy management system including renewable energy based on ZigBee and PLC,” IEEE Trans. on Consumer Electron., vol. 60, no. 2, pp. 198-202, 2014.
[9] J. Han, C. Choi, W. Park, I. Lee, and S. Kim, “PLC-based photovoltaic system management for smart home energy management system,” IEEE Trans. On Consumer Electron., vol. 60, no. 2, pp. 184-189, 2014.
[10] I. Hong, B. Kang, and S. Park, “Design and implem- entation of intelligent energy distribution manage- ment with photovoltaic system,” IEEE Trans. on Consumer Electron., vol. 58, no. 2, pp. 340-346, 2012.
[11] Y. Rashidi, M. Moallem, and S. Vojdani, “Wireless Zigbee system for performance monitoring of photo- voltaic panels,” Proc. IEEE Photovoltaic Specialist Conf., pp. 3205-3207, 2011.
[12] X. Xiaoli, and Q. Daoe, “Remote monitoring and control of photovoltaic system using wireless sensor network,” Proc. Int. Conf. on Electric Inform. and Control Eng., pp. 633-638, 2011.
[13] Y. A. I. Mohammad, and E. F. Ei-Saadany, “Adaptive
decentralized droop controller to preserve power sharing stability of paralleled inverters in distributed generation micro-grids,” IEEE Trans. on Power Electron., vol. 23, no. 6, pp. 2806-2816, 2008.
[14] L. Lu, and C. Chu, “Autonomous power management and load sharing in isolated Micro-Grids by consensus-based droop control of power converters,” 1st Int. Conf. on Future Energy Electron., pp. 365-370, 2013.
[15] H. Kaki, A. Nisino, and T. Ise, “Distribution voltage control for DC micro-grid with fuzzy control and gain-scheduling control,” IEEE 8th Int. Conf. on Power Electron. and ECCE Asia (ICPE and ECCE), 2011.
[16] J. A. P. Lopes, C. L. Moreira, and A. G. Madureira, “Defining control strategies for micro-grids islanded operation,” IEEE Trans. on Power Syst., vol. 21, no. 2, pp. 916-924, 2006.
[17] B. K. Johnson, R. H. Lasseter, F. L. Alvarado, and R. Adapa, “Expandable multi-terminal DC systems based on voltage droop,” IEEE Trans. on Power Delivery, vol.8, no.4, pp.1926-1932, 1993.
[18] Y. Okabe, and K. Sakai, “QoEn (quality of energy) routing toward energy on demand service in the future internet,” The Inst. of Electr., Inform. and Comm. Eng. Tech. Rep., 2009.
[19] T. Takuno, Y. Kitamori, R. Takahashi, and T.
Hikihara, “AC power routing system in home based on demand and supply utilizing distributed power sources,” Energies, pp. 717-726, 2011.
[20] R. Abe, H. Taoka and D. McQuilkin, “Digital Grid: communicative electrical grids of the future,” IEEE Trans. on Smart Grid, vol. 2, no.2, June 2011.
[21] T. Edagawa, K. Fukae, and T. Hisakado, “Peer-to peer
energy transmission system by bidirectional AC-DC converter module,” Inst. of Elect. Eng. of Japan, Tech. Rep. PE-14-191, PSE-14-191, 2014 (In Japanese). [22] T. Kato, K. Yuasa, and T. Matsuyama, “Energy on
demand: efficient and versatile energy control system for home energy management,” Proc. Smart Grid Comm. 2011, pp. 410-415, 2011.
[23] T. Kato, K. Tamura, and T. Matsuyama, “Adaptive storage battery management based on the energy on demand protocol,” Proc. Smart- GridComm2012, pp. 43-48, 2012.