The effect of tonic contraction of one hand
muscle on motor area of tonically contracting
another hand muscle
著者
城野 靖朋
内容記述
学位記番号:論保第15号, 指導教員:平岡 浩一
大阪府立大学大学院
総合リハビリテーション学研究科
博 士 論 文
The effect of tonic contraction of one hand
muscle on motor area of tonically contracting
another hand muscle
2016 年 3 月
Table of contents
Abstract --- 1
Overview --- 2
I. Coordination of finger movements --- 2
II. MEP map--- 2
III. Experiment 1--- 3
IV. Experiment 2 --- 3
V. Conclusion --- 3
Chapter 1: The effect of tonic contraction of the hand muscle on the motor area of the contracting adjacent muscle I. Introduction--- 5
II. Materials and Methods --- 7
1. Participants --- 7 2. Apparatus --- 7 3. TMS --- 7 4. Mapping procedure --- 8 5. Data analysis --- 9 III. Results --- 10 1. Hotspot and RMT--- 10
2. bEMG and MEP amplitude in the FDI muscle --- 10
3. COG --- 11
4. Active TMS sites --- 12
5. OL and NOL areas --- 13
IV. Discussion --- 16
1. Summary --- 16
2. Methodological considerations--- 16
4. Medial shift of the COG--- 17
5. Neural mechanism underlying the COG shift--- 18
6. Conclusion --- 19
Chapter 2: Modulation of motor area of tonically contracting hand muscle induced by tonic contraction of adjacent hand muscle I. Introduction--- 20
II. Material and methods --- 22
1. Participants --- 22 2. Apparatus --- 22 3. TMS --- 23 4. Motor tasks --- 24 5. Mapping procedure --- 24 6. Data analysis --- 25 III. Results --- 27 1. Behavioral data --- 27 2. Hotspot--- 28
3. COG of the OL and NOL areas--- 29
4. Task effect on the OL and NOL areas --- 31
IV. Discussion --- 33
1. Summary --- 33
2. Methodological consideration--- 33
3. Hotspot--- 34
4. OL and NOL areas --- 35
5. Conclusion --- 36
References--- 37
Abstract
Motor area for the adjacent hand muscles partially share the motor area and interact through the horizontal connection of the primary motor cortex. Therefore, the motor area of the contracting muscle must be coordinated by tonic contraction of the adjacent muscle. In the experiment 1, the effect of tonic contraction of one hand muscle on the facilitatory circuit of the motor area of the contracting adjacent muscle was investigated. In the experiment 2, an investigation was made to elucidate whether the facilitatory and inhibitory circuits of the motor area of tonically contracting hand muscle is modulated by tonic contraction of the adjacent muscle, and whether the effect of tonic contraction of the hand muscle on the motor area of tonically contracting adjacent hand muscle is dependent on the muscle tested. In both experiments, the motor area of the motor evoked potentials (MEP) map in the first dorsal interosseous (FDI) muscle, non-overlapped with those in the abductor digit minimi (ADM) muscle, was suppressed by tonic contraction of the ADM muscle. In the experiment 2, not only the facilitatory circuit but also inhibitory circuit was suppressed by tonic contraction of the ADM muscle. Moreover, the motor areas of the MEP and cortical silent period (CSP) maps in the ADM muscle, both overlapped and non-overlapped with those in the FDI muscle, were not modulated by tonic contraction of the FDI muscle. In the experiment 1, the center of the non-overlapped area of the FDI muscle was lateral to that of the overlapped area in the FDI muscle. In the experiment 2, the centers of the non-overlapped areas of the MEP and CSP maps of the FDI muscle were lateral to those of the overlapped areas in the FDI muscle, and were lateral to both the overlapped and non-overlapped areas in the ADM muscle. The suppression observed in the present study may be caused by a fact that the lateral motor area of the FDI muscle, non-overlapped with the motor area of the ADM muscle, is particularly susceptible to motor command to the ADM muscle, or may be to prevent isolated activity of the muscle for the independent hand, when acting together with the adjacent muscle as the synergist.
Key words: transcranial magnetic stimulation, motor area, motor evoked potential, cortical silent period, coordination
Overview
I. Coordination of finger movements
Enslaving effect is the involuntary force production of the finger by force production of the other fingers1. Moreover, force production of one finger decreases and cessation of
force production of the same finger increases force production of the other fingers2.
Such interaction of motor outputs between the fingers must be partially mediated by neural interaction; i.e., horizontal interaction among the motor cortical cells3. Indeed,
inactivation of the motor cortical cells reduces independency of finger movements4,
indicating that the motor cortical cells contribute to balance between independent and coordinated finger movements.
II. MEP map
Tonic contraction of the proximal arm muscle facilitates motor evoked potential (MEP) map in the distal arm muscle5. As enslaving effect is, this interaction must be partially
mediated by neural interaction through the horizontal connection of the motor cortical cells. In spite of this view, MEP in tonically contracting hand muscle elicited at the hotspot was not modulated by tonic contraction of the adjacent hand muscle6. One of
the explanations of the different findings between the studies on MEPs elicited across the MEP map and on MEPs elicited at the hotspot is that the motor cortical cells, which play a role for coordination of the hand muscles, are unequally distributed across the motor area, and these cells are relatively sparse at the hotspot of the MEP. Indeed, the motor area of the MEP map, where prominent MEPs in a particular muscle are evoked, has certain extent7, 8. Accordingly, it is possible to suppose that certain area within the
motor area other than the hotspot is interactive among the motor cortical cells mediating coordination between the hand muscles.
Movements of the different fingers partially share the functional somatotopy of the motor area9-12. The overlapped area (OL area) of the motor area has been considered to
play a role for coordination of finger movements, and the non-overlapped area (NOL area) of that plays a role for the independent movement13. This hypothesis could be
studied by use of the MEP map. III. Experiment 1
In the experiment 1, the effect of tonic contraction of the hand muscle on the motor area of the contracting adjacent muscle was examined. The map of the MEP in the first
dorsal interosseous (FDI) and the abductor digit minimi (ADM) muscle were obtained with the participant at rest or during tonic contraction of the ADM muscle while the FDI muscle was tonically contracted. The center of gravity (COG) in the FDI muscle shifted medially during contraction of the ADM muscle. Motor area of the MEP map in the FDI muscle, non-overlapped with those in the ADM muscle, was suppressed by tonic contraction of the ADM muscle. In contrast, the motor areas of the MEP map in the FDI muscle, overlapped with those in the ADM muscle was not modulated by tonic contraction of the FDI muscle. It is concluded that medial shift of the COG of the MEP map in the contracting hand muscle induced by tonic contraction of the adjacent muscle must be due to suppression of the lateral motor area.
IV. Experiment 2
In the experiment 2, an investigation was made to elucidate whether the facilitatory and inhibitory circuits of the motor area of tonically contracting hand muscle is modulated by tonic contraction of the adjacent muscle. The map of the MEP and that of the cortical silent period (CSP) in tonically contracting hand muscle tested were obtained while the adjacent muscle was tonically contracting or was at rest. Motor area of the MEP map and that of the CSP map in the FDI muscle, non-overlapped with those in the ADM muscle, were suppressed by tonic contraction of the ADM muscle. In contrast, the motor areas of the MEP and CSP maps in the FDI muscle, overlapped with those in the ADM muscle, and those in the ADM muscle, both overlapped and non-overlapped with those in the FDI muscle, were not modulated by tonic contraction of the adjacent hand muscle. The centers of the non-overlapped areas of the MEP and CSP maps in the FDI muscle were lateral to those of the overlapped areas in the FDI muscle, and were lateral to both the overlapped and non-overlapped areas in the ADM muscle. In conclusion, the suppression observed in the present study may be caused by a fact that the lateral motor area of the FDI muscle, non-overlapped with the motor area of the ADM muscle, is particularly susceptible to motor command to the ADM muscle, or may be to prevent isolated activity of the muscle for the independent hand, when acting together with the adjacent muscle as the synergist.
V. Conclusion
The suppression in motor area of tonically contracted hand muscle by tonic contraction of the adjacent hand muscle is area dependent and muscle specific. This is possibly caused by greater susceptibility of the facilitatory and inhibitory circuits in the lateral motor area of the FDI muscle to motor command to the ADM muscle, or by smaller
susceptibility of the motor area in the FDI muscle, acting for the independent finger, so that isolated activity of the muscle is suppressed when the muscle acts together with the adjacent hand muscle as the synergist.
Chapter 1: The effect of tonic contraction of the hand muscle on the motor area of the contracting adjacent muscle
I. Introduction
Enslaving is the involuntary force production by fingers not explicitly involved in a force-production task by the force-production task of other fingers1. One of the
potentially mechanism considered with the interaction among fingers could be due to central neural mechanism, which implies the existence of neural interaction among the motor pathways executing finger movements. Similarly to enslaving, tonic contraction of the hand muscle facilitates corticospinal excitability in the relaxed adjacent hand muscle14-16. One point to be considered with respect to these previous studies is that
they examined corticospinal excitability through the motor evoked potentials (MEP) elicited by transcranial magnetic stimulation (TMS) at the hotspot. Motor cortical cells interact through the horizontal connection of the primary motor cortex across within-limb motor areas3, 17-19, and the motor area of the MEP map, where prominent
MEPs in a particular muscle are evoked, has certain extent7, 8. Thus, the effect of tonic
contraction of the muscle on the particular site of the motor area of the adjacent muscle is not necessarily the same as that on the hotspot of MEP.
Another point to be considered is the different effects of tonic contraction of the hand muscle on corticospinal excitability in the relaxed and contracted muscles. Tonic contraction of the hand muscle has been found to facilitate corticospinal excitability of the relaxed adjacent hand muscle14, 16, but was found not to facilitate the tonically
contracting adjacent muscle6. Accordingly, the facilitatory effect of tonic contraction of
the hand muscle on the corticospinal excitability of the adjacent hand muscle must be present only when the tested muscle is relaxed. Nevertheless, this view may not be applicable for motor cortical area. Neural interaction between motor cortical area for the adjacent hand muscles may occur when the adjacent hand muscles are simultaneously activated, according to neurophysiological findings that motor area for the adjacent muscles partially share motor area when both muscles are active; motor area is considerably shared when different joints are moved within the same limb13, 20, and
movements of different fingers partially share the same motor cortical areas9-12. Given that the motor areas of the adjacent muscles interact with each other when the muscles are active, the motor cortical excitability of the contracting muscle must be affected by tonic contraction of the adjacent muscle. Experiment 1 investigated the
effect of tonic contraction of the hand muscle on the excitability of the motor area of the adjacent hand muscle during the tonic contraction. The little finger was tonically
abducted or relaxed while the index finger was tonically abducted. Abduction of each finger must activate a single prime mover. Thus, the present investigation allows us to observe the effect of tonic voluntary contraction of a single hand muscle on the motor area of the tonically contracting single adjacent hand muscle.
II. Materials and Methods 1. Participants
Eleven healthy humans aged 28.3 ± 1.4 years old (eight males and three females) participated in this study. All participants were right-handed according to the Edinburg Handedness Inventory21. No participant had any history of orthopedic or neurological
issues. The experimental protocol was explained, and the participants provided their written informed consent to participate in this experiment. All procedures were
approved by the Ethics Committee of Osaka Prefecture University and were conducted according to the Declaration of Helsinki.
2. Apparatus
The participant was seated in a chair. The right forearm in the prone position, and the right hand with the palm facing downward, were placed on a table. The fingers were sandwiched between metal plates fixed to the table. Strain gauges were attached over the metal plates to measure the force level of isometric abduction of the index and little fingers. An oscilloscope configured in X-Y mode displayed a cursor indicating the force level of index finger abduction along the y-axis and the force level of little finger
abduction along the x-axis (Fig. 1. 1). The signals from the strain gauges were amplified via strain amplifiers (DPM-712B; Kyowa Dengyo, Tokyo, Japan). The
electromyographic (EMG) activities of the first dorsal interosseous (FDI) and abductor digiti minimi (ADM) muscles were recorded using Ag/AgCl surface electrodes
configured in belly-tendon montages. The EMG signals were amplified and band-pass filtered (15 Hz to 3 kHz) with an amplifier (MEG-1200; Nihon Kohden, Tokyo, Japan). The EMG signals were converted to digital signals at a sampling rate of 10 kHz using an A/D converter (PowerLab 800S; ADInstruments, Colorado Springs, CO, USA), and the digital signals were stored on a personal computer.
3. TMS
TMS was delivered using a figure-of-eight coil with an outer diameter of 99 mm (YM-133B; Nihon Kohden) connected to a magnetic stimulator (SMN-1200; Nihon Kohden). The maximum intensity of the coil was 0.96 T. The coil was placed tangentially to the scalp at a 45-degree angle to the sagittal plane and induced
posterior-anterior electrical current in the brain22. The participants wore a swim cap on which markers facilitating the localization of TMS had been placed. The hotspots of the FDI and ADM muscles were determined by searching the site for locations where the maximum MEP amplitude was obtained. The resting motor threshold (RMT) of the FDI
muscle was defined as the minimal intensity of the magnetic stimulator that produced an MEP amplitude larger than 50 μV in at least 5 out of 10 stimulations delivered over the hotspot23. The TMS intensity was maintained at the RMT during the experiment.
4. Mapping procedure
TMS was performed over a fixed 5 cm x 5 cm grid (25 points) centered on the hotspot for each muscle24-26. The TMS sites, indicated by markers on the swim cap, were spaced
at 1-cm intervals. A fixed 25-point grid was used to avoid stimulating the primary
sensory cortex located 3 cm posterior to the hotspot of the primary motor cortex27 or the
premotor cortex located 2.5 cm anterior to and 1 cm medial to the hotspot28.
Maximal force (MF) levels of index and little finger abduction were measured. The participant adjusted the force level according to visual feedback displayed on the oscilloscope. The participant was asked to abduct the index finger against the fixed metal plate so that the cursor on the oscilloscope stayed at target A, indicating index
finger abduction at 10% of MF with little finger abduction at 0% of MF (ADM-at rest task). The participant was then asked to abduct the index and little fingers
simultaneously against the plates so that the cursor stayed at target B, indicating
abduction at 10% of MF in both the index and little fingers (ADM-active task). Several familiarizing sessions were conducted before the experiment was conducted. Six trains of single TMS pulses with intervals from 3 to 5 s were delivered while the participant consistently exerted the target force level in each session. The interval between sessions was approximately 1 min. For each session, the TMS coil was placed over one of the 25 TMS sites. The task and TMS site were altered randomly from one session to the next. The experiment was continued until one session was completed for each task at each TMS site.
5. Data analysis
The EMG traces were rectified, and the pre-stimulus background EMG (bEMG)
amplitude was estimated from the rectified EMG traces in the time window between 10 and 110 ms before TMS. The MEP amplitude was estimated on a peak-to-peak basis. An MEP amplitude equal to or less than the bEMG amplitude was considered to be 0. The center of gravity (COG) of the MEP map was estimated7, 29-31. Active TMS site,
where motor systems of the muscle is prominently activated by TMS at a certain intensity, was defined as the site at which the MEP amplitude at the TMS site was significantly higher than the overall average MEP amplitude across 25 TMS sites during each task as revealed by an unpaired t-test32. Any active TMS site of the FDI muscle
during the ADM-at rest task that overlapped with the active TMS sites in the ADM muscle during the ADM-active task was defined as overlapped area (OL area). Any active TMS site of the FDI muscle during the ADM-at rest task that did not overlap with the active TMS sites in the ADM muscle during the ADM-active task was defined as non-overlapped area (NOL area). The COG and the numbers of OL and NOL areas were estimated. The difference between the two means was tested by a paired t-test. Two-way repeated measures analysis of variance (ANOVA) was conducted when testing the difference in bEMG amplitudes among the TMS sites and between the tasks. The alpha level was 0.05. Statistical analysis was conducted using a software program
Ekuseru-Toukei 2012 (Social Survey Research Information Co., Tokyo, Japan). Data were presented as the mean values and the standard error of the mean.
III. Results
1. Hotspot and RMT
The hotspot was 5.7 ± 0.3 cm lateral to and 1.2 ± 0.3 cm anterior to the vertex in the FDI muscle, and 5.6 ± 0.2 cm lateral to and 0.9 ± 0.3 cm anterior to the vertex in the ADM muscle. The locus of the hotspot in the FDI muscle was almost identical to that of the hotspot in the ADM muscle. The TMS intensity at the RMT was 68.7 ± 3.0% of the maximum output.
2. bEMG and MEP amplitude in the FDI muscle
In the FDI muscle, the bEMG amplitude was 47.2 ± 10.4 μV during the ADM-at rest task and 47.8 ± 10.8 μV during the ADM-active task. ANOVA failed to reveal any significant effect of task [F(1, 10) = 0.67, p = 0.43] or TMS site [F(24, 240) = 1.23, p = 0.22], nor was there any significant interaction between the two factors [F(24, 240) = 1.12, p = 0.32]. The MEP amplitude at the hotspot was 1.6 ± 0.4 mV during the ADM-at rest task and 1.5 ± 0.5 mV during the ADM-active task (Fig. 1. 2). No significant difference in MEP amplitude was found between the tasks (paired t-test, p = 0.81). The maximum MEP amplitude was 2.7 ± 0.6 mV during the ADM-at rest task and 2.8 ± 0.8 mV during the ADM-active task. No significant difference in maximum MEP amplitude was found between the tasks (paired t-test, p = 0.92). The average MEP amplitude across all TMS sites was 0.9 ± 0.2 mV during the ADM-at rest task, and 0.9 ± 0.3 mV during the ADM-active task. No significant difference in this amplitude was found between the tasks (paired t-test, p = 0.87).
3. COG
The COG in the FDI muscle was 3.2 ± 1.1 mm medial to the hotspot and 0.3 ± 1.6 mm anterior to the hotspot during the ADM-at rest task (Fig. 1. 3A), and 3.8 ± 1.2 mm medial to and 0.9 ± 1.5 mm anterior to the hotspot during the ADM-active task. The COG was significantly medial to the locus of the hotspot during both tasks (paired t-test,
p < 0.05). In contrast, it was not significantly different from the locus of the hotspot on
the anterior-posterior axis during either task (paired t-test, p > 0.05). The COG during the ADM-active task was significantly medial to the COG during the ADM-at rest task (paired t-test, p < 0.05). The mean difference in the COG on the medio-lateral axis between the two tasks was 0.5 ± 0.2 mm. In contrast, the COG in the FDI muscle on the anterior-posterior axis was not significantly different between the two tasks (paired
t-test, p = 0.21). The COG in the ADM muscle was 4.0 ± 1.2 mm medial to and 0.8 ±
1.2 mm anterior to the hotspot during the ADM-at rest task (Fig. 1. 3B), and 4.6 ± 0.9 mm medial to and 0.7 ± 1.1 mm anterior to the hotspot during the ADM-active task. The COG was significantly medial to the locus of the hotspot during both tasks (paired t-test,
p < 0.05). In contrast, it was not significantly different from the locus of the hotspot on
the anterior-posterior axis during either task (paired t-test, p > 0.05). The COG was not significantly different between the tasks on either axis (paired t-test, p > 0.05).
4. Active TMS sites
The numbers of participants showing “active” for each TMS site are shown in Fig. 1. 4 for the FDI muscle and in Fig. 1. 5 for the ADM muscle. The number of active TMS sites in the FDI muscle was 4.6 ± 0.5 during the ADM-at rest task and 5.1 ± 0.8 during the ADM-active task (Fig. 1. 6). The number of active TMS sites was not significantly different between the tasks (paired t-test, p = 0.46). The number of active TMS sites in the ADM muscle was 3.5 ± 0.5 during the ADM-at rest task and 5.7 ± 0.8 during the ADM-active task. The number of active TMS sites during the ADM-active task was significantly larger than that during the ADM-at rest task (paired t-test, p < 0.05).
5. OL and NOL areas
In 10 of 11 participants, there was OL area. The average number of OL area was 2.9 ± 0.5. The MEP amplitude across the OL area in the FDI muscle was 2.4 ± 0.5 mV during the ADM-at rest task and 2.4 ± 0.6 mV during the ADM-active task (Fig. 1. 7). No significant difference in MEP amplitude was found between the tasks (paired t-test, p = 0.97). In 9 of 11 participants, there was NOL area. The average number of NOL area was 2.4 ± 0.4. The MEP amplitude across the NOL area in the FDI muscle was 2.3 ± 0.5 mV during the ADM-at rest task and 1.8 ± 0.5 mV during the ADM-active task. The MEP amplitude was significantly different between the tasks (paired t-test, p < 0.05).
In 8 of 11 participants, both OL and NOL areas were present. The COG of the OL area was 2.9 ± 1.3 mm medial to and 1.1 ± 1.5 mm posterior to the hotspot (Fig. 1. 8). The COG of the NOL area was 0.8 ± 1.4 mm lateral to and 0.0 ± 1.6 mm anterior to the hotspot. The COG in the medio-lateral direction was significantly different between the OL and NOL area (paired t-test, p < 0.05). In contrast, no significant difference in COG in the anterior-posterior direction was found between the OL and NOL area (paired
IV. Discussion 1. Summary
Experiment 1 examined the effect of tonic contraction of the hand muscle on the motor area of the contracting adjacent muscle. The COG of the MEP map in the tonically contracting hand muscle shifted medially during tonic contraction of the adjacent hand muscle. While one hand muscle is tonically contracted, the NOL area of the contracting muscle was suppressed by tonic contraction of the adjacent muscle.
2. Methodological considerations
Experiment 1 investigated the effect of hand muscle activity on the MEP map of the adjacent hand muscle under ADM-active and -at rest conditions. The MEP is known to depend on the bEMG level33, 34. However, the bEMG level must not be a major factor
affecting MEP map in the present study, because the bEMG amplitude was not significantly different among the TMS sites or between the tasks. In the present study, the number of active TMS sites was 4-6, which is consistent with one previous finding that the number of active TMS sites in the FDI muscle was around 626, but inconsistent
with another previous finding that this number was 10-1325. The inconsistency in the
number of active TMS sites between the present study and the previous study by Malcolm and colleagues25 must be derived from a difference in statistical methodology:
the active TMS site was defined as the point at which the MEP size was significantly larger than the MEP size averaged across all TMS sites in the present study, but was defined as the TMS site at which the MEP was larger than 10% of the maximum MEP size in Malcolm’s study25. In the present study, a small fixed grid map was used to
construct the MEP map. This small map was used to avoid stimulating the premotor cortex or primary sensory cortex approximately 3 cm away from the hotspot27, 28. Our
statistical methodology, with which a small MEP map was obtained, must have been able to prevent the motor area from spilling over the small fixed grid map and to minimize the contaminative effect derived from TMS over the premotor cortex or over the primary sensory cortex.
Fatigue facilitates corticospinal excitability during maximum or submaximum voluntary contraction of the target muscle35-37. In the present study, the participants stained the target force level for at most 30 s in each session. A previous study showed that fatigue-induced facilitation of MEP in thebiceps brachii muscle was not present before 6 min of sustained contraction of the tested muscle with 20% of maximal voluntary contraction35. According to this previous finding, each session must have terminated
before the onset of fatigue-induced facilitation of corticospinal excitability found in the present study. Fatigue occurring across trials does not affect our findings, because across-trial effects were cancelled by the random alteration of TMS sites and tasks from one session to the next.
3. MEP elicited at the hotspot
The amplitude of the MEP in the FDI muscle elicited by TMS at the hotspot was not significantly different between the tasks. This finding is consistent with a previous finding that tonic contraction of the hand muscle does not modulate MEP amplitude in the contracting adjacent hand muscle6. The present finding indicates that excitability of
the corticospinal pathway in the tonically contracting hand muscle, represented by MEP elicited at the hotspot, is not modulated during tonic contraction of the adjacent hand muscle. However, this finding fails to explain the enslaving effect by increased corticospinal excitability in the hand muscle. In the present study, the force of the tested finger movement was maintained at a constant level through visual feedback, as in the study by Poston et al6, which also failed to find any facilitatory effect. Therefore, it is
possible that the enslaving effect on the corticospinal pathway does not occur when the activity level of the tested muscle is explicitly controlled by the participant.
4. Medial shift of the COG
The main finding in the present study was that the COG of the MEP map in the hand muscle shifted medially during tonic contraction of the adjacent hand muscle. A previous study investigated the modulation of the motor area induced by tonic contraction of the adjacent hand muscle38. That study was conducted using an
experimental methodology very similar to that of the present study, but failed to find any significant shift of the COG of the MEP map induced by tonic contraction of the adjacent hand muscle. In Wilson’s study, tonic contraction of the abductor pollicis brevis (APB) and ADM muscles was performed. These muscles must not be synergists, because the APB muscle is the abductor of the thumb in the palmar direction, although the ADM muscle is the prime mover of little finger abduction in the ulnar direction. In contrast, the FDI and ADM muscles, in which tonic abduction was performed simultaneously in the present study, must be synergists when all fingers are spread apart. Therefore, the different findings regarding the COG shift induced by adjacent hand muscle activity between the present study and the previous study may be related to differences in the synergistic relationship between the target and adjacent hand muscles.
Although the medial shift of the COG of the MEP map in the FDI muscle induced by tonic contraction of the ADM muscle was statistically significant, the magnitude of the shift was as small as 0.5 mm. This magnitude was even smaller than the magnitude of the COG shift (1.1 mm) found between the different grip tasks26 or the magnitude of the
COG shift (6 mm) found during voluntary contraction8. Reilly and Mercier26 suggest
that such a small shift of COG is within the normal limit of variation for repeated mapping in the same muscle. Indeed, the small shift of the COG found in the present study is within the inter-trial variability of the COG around 1.8 - 1.9 mm on either the x or y axis31. Nevertheless, we believe that the small shift in the COG found in the present
study is meaningful. The COG of the MEP map indicates the distribution of motor cortical excitability in motor area. Accordingly, the small shift in the COG observed in the present study must reflect modulation of the motor cortical excitability in the small limited area of the motor area. The subgroup analysis discussed below supports this view.
5. Neural mechanism underlying the COG shift
The bEMG level was not significantly different among the TMS sites or between the tasks in the present study. The bEMG level has been said to reflect motoneuron pool excitability39. Accordingly, the medial shift of the COG of the MEP map in the present
study must not be of spinal origin but instead reflects modulation of the excitability distribution in the motor area. The motor area of the hand muscle in the radial finger is located laterally, and that in the ulnar finger is locate medially, but those motor areas overlap broadly9, 10, 40. The broad overlap of the motor areas indicates that different
finger movements are partially controlled by the same motor cortical areas. In contrast, the MEP in the NOL area was suppressed during tonic contraction of the adjacent hand muscle. The COG of the NOL area in the FDI muscle was lateral to that of the OL area in which the MEP was not suppressed during tonic contraction of the ADM muscle. Thus, the medial shift of the COG in the FDI muscle induced by tonic contraction of the ADM muscle must reflect lower motor cortical excitability at the lateral site of the motor area.
Suppression of the motor area that does not overlap the motor are of the adjacent hand muscle is likely to be related to the surround inhibition reported previously6, 15, 16. Surround inhibition must be of motor cortical origin41 because it occurs without suppression of the F-wave or H-reflex15, 16. In the present study, corticospinal
of the adjacent hand muscle. This finding was consistent with previous findings that surround inhibition does not occur at the hotspot during tonic contraction of the adjacent hand muscle6, 16. Such different effects of voluntary contraction on corticospinal
excitability in the adjacent hand muscle may be due to a difference in motor commands for different types of voluntary contraction42.
Nevertheless, corticospinal excitability in the NOL area was suppressed during tonic contraction of the ADM muscle. According to the definition given in the Data analysis section above, NOL area in the target hand muscle constitute the “surrounding” area of the motor area of the adjacent activated hand muscle. That is, tonic contraction of the hand muscle suppressed motor cortical excitability of the motor area of the adjacent hand muscle specifically at the surrounding area of the motor area of the hand muscle that was tonically contracted. Surround inhibition occurs at the hotspot specifically during the premovement or phasic phase of voluntary contraction in the muscle that is not a synergist of the activated muscle16. Nevertheless, suppression of the MEP was
present in the surrounding area of the motor area of the adjacent hand muscle during tonic contraction of the adjacent hand muscle, that is, the synergist of the tested muscle. Based on these findings, we speculate that surround inhibition may occur even in areas other than the hotspot and even during tonic contraction of the synergist muscle. 6. Conclusion
The COG of the MEP map in the tonically contracting hand muscle shifted medially during tonic contraction of the adjacent hand muscle. While one hand muscle is tonically contracted, motor cortical excitability of the contracting muscle, which is not shared by the motor area of the adjacent muscle, is suppressed by tonic contraction of the adjacent muscle.
Chapter 2: Modulation of motor area of tonically contracting hand muscle induced by tonic contraction of adjacent hand muscle
I. Introduction
Movements of the different fingers partially share the functional somatotopy of the motor area9-12. The overlapped area (OL area) of the motor cortex has been considered
to play a role for coordination of finger movements, and the non-overlapped area (NOL area) of that plays a role for the independent movement13. This hypothesis has been
studied by the experiment 1 on the MEP map43. Experiment 1, the motor area, where
TMS elicits prominent MEP in the hand muscle, was categorized into two areas: the OL area where prominent MEP both in the FDI and ADM muscles was elicited and the NOL area where prominent MEP solely in one of the two muscles was elicited. This previous study revealed that the NOL area of tonically contracting FDI muscle was suppressed by tonic contraction of the ADM muscle, although the OL area of that was not. This finding indicates that motor command to the ADM muscle suppresses the motor area which prominently activates motor system solely of the FDI muscle, but does not modulate the motor area which activates motor systems of both the FDI and ADM muscles while motor command is sending to the FDI muscle.
In spite of the experiment 143, two issues remain to be elucidated. One is whether the
effect of tonic contraction of the hand muscle on the motor area of tonically contracting adjacent hand muscle is dependent on the muscle tested. Motor systems of the different fingers have different degrees of interaction between the fingers. The index finger moves independently, but the little finger moves together with the other fingers44-47.
Motor related cortical potential was greater when force production of the ring finger was combined with force production of the other fingers, but was smaller when that of the index finger was combined with that of the other fingers46. Surround inhibition of
the hotspot of the MEP was not the same between the hand muscles16. Accordingly,
suppression of the NOL area in the tonically contracting FDI muscle induced by tonic contraction of the ADM muscle observed in the previous study43 may not occur in the
motor area which prominently activates motor systems in the other hand muscles. Based on this view, we hypothesize that motor command to the ADM muscle is interactive with motor area, which prominently activates motor systems in the FDI muscle, because the ADM muscle moves the little finger, which is interactive with the other fingers, but motor command to the FDI muscle is not interactive with motor system in the ADM muscle because the FDI muscle moves the index finger, which is independent from the
other finger movements in daily motor tasks. If this hypothesis is true, the NOL area of tonically contracting FDI muscle is affected by tonic contraction of the ADM muscle, but the NOL area of tonically contracting ADM muscle is not affected by tonic contraction of the FDI muscle. Experiment 2 tested this hypothesis.
Another issue to be elucidated is whether tonic contraction of the hand muscle affects the inhibitory circuits of the motor area in the adjacent hand muscle. The effect of tonic contraction of the hand muscle on intracortical inhibition of the adjacent hand muscle at the hotspot of the MEP has been investigated; Short-latency intracortical inhibition of the motor area in the tested muscle was not modulated either by tonic or phasic
contraction of the conditioned hand muscle15, 16, but long intracortical inhibition of that
in the tested muscle was reduced by phasic contraction of the conditioned muscle15. In
spite of these findings, the effect of tonic contraction of the hand muscle on the inhibitory circuits of the motor area of tonically contracting adjacent hand muscle has not been investigated. The cortical silent period (CSP) represents activity of the
inhibitory circuits mediated by the intracortical γ-aminobutyric acid48-50. The CSP of the
FDI muscle during grip task was shorter than that during index finger abduction task51,
and the CSP duration of the ADM muscle was shortened by phasic movement of index finger but was not changed by tonic movement of that6, indicating that the inhibitory
circuits of the motor area are task dependently modulated. Given this, not only the facilitatory circuits but also the inhibitory circuits of the motor area of tonically contracting hand muscle may be suppressed by tonic contraction of the adjacent hand muscle. This hypothesis was tested in the experiment 2.
II. Material and methods 1. Participants
Ten healthy participants aged 28.9 ± 1.9 years (nine males and one female) participated in this study. All participants were right-handed according to the Edinburgh Handedness Inventory21. No participant had any history of orthopedic or neurological issues. The
experimental protocol was explained and informed consent was obtained from all individual participants included in the study. All procedures were approved by the Ethics Committee of Osaka Prefecture University and were conducted according to the Declaration of Helsinki.
2. Apparatus
The participant was seated in a chair. The right forearm in the prone position, and the right hand with the palm facing downward were placed on a table. The middle and ring fingers and the forearm were sandwiched by metal plates fixed to the table so that these fingers and the forearm were maintained at the start position throughout each trial. Electromyographic (EMG) activities of the FDI and ADM muscles were recorded using Ag/AgCl surface electrodes configured in belly tendon montages. The EMG signals were amplified and band pass filtered (15 Hz to 3 kHz) using an amplifier (MEG-1200, Nihon Kohden). A display indicating targets of EMG levels in the FDI and ADM muscles and a cursor indicating actual EMG levels was placed in front of the participant (Fig. 2. 1D). A cursor along the vertical axis indicated EMG level of the FDI muscle and that along the horizontal axis indicated EMG level of the ADM muscle. The angles of the index and little fingers were recorded using electrogoniometers fixed over the fingers. The signals from the electrogoniometers were amplified via strain amplifiers (DPM-712B; Kyowa Dengyo). The EMG signals and the signals from the
electrogoniometers were converted to digital signals at a sampling rate of 10 kHz using an A/D converter (PowerLab 800S, AD Instruments), and the digital signals were stored on a personal computer.
3. TMS
TMS was delivered using a figure-of-eight coil (YM-133B, Nihon Kohden) connected to a magnetic stimulator (SMN-1200, Nihon Kohden). The maximum intensity of the coil was 0.96 T. The intersection of the coil was placed tangentially to the scalp with the two wings at a 45-degree angle to the sagittal plane and induced posterior-anterior electrical current in the brain22. Hotspots, where the maximum MEP amplitude was
obtained for certain intensity of TMS, in the FDI and ADM muscles were determined. The resting motor threshold (RMT) of the FDI muscle was determined. The RMT was defined as the minimal intensity of the magnetic stimulator output producing MEP with amplitude larger than 50 μV in at least 5 out of 10 stimulations delivered over the hotspot23. Earlier component of the CSP is spinal origin, but late component of the CSP is cortical origin52-54. Accordingly, long enough CSP, involving the late component, must be obtained to observe the inhibitory circuits of the motor area across the mapping
sites. CSP duration is dependent on TMS intensity53. Thus, TMS intensity used for the
experiment 2 was 120% of the RMT in the FDI muscle55.
4. Motor tasks
The participant abducted the index or little finger at maximum effort for 5 s to obtain EMG trace while exerting maximum voluntary contraction (MVC) of the tested muscle. Averaged amplitude of the rectified EMG trace in the time window of approximately 3 s in the steady state of the amplitude level in this trial was used as the value of MVC. The participant performed motor task with visual feedback of EMG levels in the FDI and ADM muscles (Fig. 2. 1D). In the TEST task of the FDI muscle, the participant abducted the index finger so that the FDI muscle produced EMG at 10% of MVC without contraction of the ADM muscle (0% of MVC) through placing a cursor in the monitor over a target A (Fig. 2. 1A, D). In the TEST task of the ADM muscle, the participant abducted the little finger so that the ADM muscle produced EMG at 10% of MVC without contraction of the FDI muscle (0% of MVC) through placing the cursor over a target B (Fig. 2. 1B, D). In the TEST+COND task, the participant abducted the index and little fingers simultaneously so that the FDI and ADM muscles produced EMG at 10% of MVC through placing the cursor over a target AB (Fig. 2. 1C, D). 5. Mapping procedure
TMS was delivered over the map which was fixed 5 cm x 5 cm grid (25 points) where the hotspot was centered24-26. This map must be reliable, because even 15 points of MEP
map is still reliable according to a previous study31. A session was conducted each TMS
site each task. The coil was placed over the one of the 25-point mapping sites each session. For each session, TMS was delivered 6 times consecutively with intervals from 3 to 5 s each mapping site each task. Averaged MEP area estimated from six MEPs is reliable, according to a previous finding that averaged size of the MEP estimated from five MEPs was not significantly different between the sessions31. The tasks and the
TMS sites were altered randomly session by session. The interval between the sessions was approximately 30 s. Twenty-five-point of the TMS sites centered at the hotspot of the FDI were stimulated during TEST task for the FDI muscle, those centered at the hotspot of the ADM muscle were stimulated during TEST task for the ADM muscle, and the TMS sites in both the FDI and ADM muscles were stimulated during the
TEST+COND task (Fig. 2. 2). Several familiarizing sessions were conducted before the experiment. Mapping procedure was completed within 2 hours with several
6. Data analysis
EMG traces were rectified, and six of the rectified EMG traces each TMS site were averaged each task. MEP area and pre-stimulus background EMG (bEMG) amplitude were estimated from the rectified and averaged EMG trace. Pre-stimulus bEMG amplitude averaged across the time window between 110 and 10 ms before TMS was estimated. Onset of the MEP area was the period at which EMG amplitude first exceeded pre-stimulus bEMG amplitude and offset of that was the period at which EMG level was first below the pre-stimulus bEMG amplitude after TMS artifact. The onset and offset were visually determined. In order to estimate MEP area, area of the MEP in the time window between the onset and offset of the MEP was subtracted by area of the pre-stimulus bEMG, derived from mean pre-stimulus bEMG amplitude multiplied by the interval between the onset and offset of the MEP. CSP duration was defined as the interval between the TMS artifact and the reappearance of bEMG activity
after the TMS. Active TMS site, where MEP larger than 2/3 of the maximal MEP area across 25-point map of each muscle was elicited, was identified26, 29. The active TMS
sites in the muscle, overlapped with the sites in the adjacent muscle, were categorized into the OL area. Thus, the OL area represents the motor area, where motor systems of both in the FDI and ADM muscles are prominently activated by TMS at a certain intensity. Active TMS sites, which were not categorized into the OL area, were grouped to the NOL area. Thus, the NOL area represents the motor area where motor system either in the FDI or ADM muscle is predominantly activated by TMS at a certain intensity. Center of gravity (COG) of the OL area and that of the NOL area in the MEP (COGm) and CSP (COGc) maps were estimated to determine the spatial distribution of the excitability of the MEP and CSP across each area7, 29-31.
One-way analysis of variance (ANOVA) was conducted for testing the difference in means for a main effect; [4 (COG)]. Two-way ANOVA was conducted for the testing the difference in means for two main effects; [2 (task) * 25 (TMS site)], [2 (finger) * 2 (task)], [2 (muscle) * 2 (task)], or [2 (OL vs. NOL) * 2 (task)]. When ANOVA revealed a statistical difference, Bonferroni's multiple comparison test was conducted. When two-way ANOVA revealed significant interaction, test of simple main effect was conducted. Paired t-test was conducted to examine the difference between two means. One-sample t-test was conducted to test whether velocity of finger movement was significantly different from the theoretical zero velocity. Alpha level was 0.05. Statistical analysis was conducted using a software program Ekuseru-Toukei 2012 (Social Survey Research Information Co., Tokyo, Japan). Data were expressed as the mean and standard error of mean.
III. Results
1. Behavioral data
In the FDI muscle, pre-stimulus bEMG amplitude was not significantly different between the tasks [F(1, 9) = 3.18, p = 0.11] and among the TMS sites [F(24, 216) = 0.57, p = 0.95] without significant interaction between the two main effects [F(24, 216) = 0.98, p = 0.49]. Similarly, in the ADM muscle, pre-stimulus bEMG amplitude was not significantly different between the tasks [F(1, 9) = 0.28, p = 0.61] and among the TMS sites [F(24, 216) = 0.66, p = 0.88] without significant interaction between the two main effects [F(24, 216) = 0.64, p = 0.90].
The angle of index finger abduction was 11.8 ± 2.0 degrees during the TEST task and 10.1 ± 1.8 degrees during the TEST+COND task (Fig. 2. 3A). The angle of little finger abduction was 13.8 ± 1.8 degrees during the TEST task and 14.0 ± 1.8 degrees during the TEST+COND task. The angle of finger abduction was not significantly different between the fingers [F(1, 9) = 2.30, p = 0.16] and between the tasks [F(1, 9) = 3.52, p = 0.09] with significant interaction between the two main effects [F(1, 9) = 7.59, p < 0.05]. Test of the simple main effect revealed that the angle of index finger abduction during the TEST+COND task was significantly smaller than that during the TEST task [F(1, 18) = 10.40, p < 0.05].
The angular velocity of index finger abduction was 0.04 ± 0.04 degrees/s during the TEST task and 0.02 ± 0.04 degrees/s during the TEST+COND task (Fig. 2. 3B). The angular velocity of little finger adduction was 0.00 ± 0.11 degrees/s during the TEST task and 0.01 ± 0.03 degrees/s during the TEST+COND task. The angular velocity was not significantly different between the fingers [F(1, 9) = 0.67, p = 0.43] and between the tasks [F(1, 9) = 0.07, p = 0.79] without significant interaction between the two main effects [F(1, 9) = 0.01, p = 0.92]. One sample t-test revealed that the angular velocity of index finger abduction was not significantly different from the theoretical zero velocity both during the TEST (p = 0.31) and TEST+COND tasks (p = 0.59), and that of little finger abduction was not significantly different from the theoretical zero velocity both during the TEST (p = 1.00) and TEST+COND tasks (p = 0.76).
2. Hotspot
Hotspot was located 61.0 ± 2.3 mm lateral to and 15.0 ± 3.4 mm anterior to the vertex in the FDI muscle, and 62.0 ± 2.5 mm lateral to and 13.0 ± 3.3 mm anterior to the vertex in the ADM muscle (Fig. 2. 4A). In 8 out of 10 participants, the locus of the hotspot of the FDI muscle and that of the ADM muscle were identical. The locus of the hotspot was not significantly different between the muscles both on the medio-lateral (p = 0.34) and anterior-posterior axes (p = 0.17). The TMS intensity at the RMT of the FDI muscle was 62.5 ± 1.6 %, and that of the ADM muscle was 63.1 ± 1.4 % of the maximum stimulator output. MEP area at the hotspot was not significantly different between the muscles [F(1, 9) = 3.33, p = 0.10] and between the tasks [F(1, 9) = 0.47, p = 0.51] without significant interaction between the two main effects [F(1, 9) = 1.11, p = 0.32] (Fig. 2. 4B). CSP duration at the hotspot was not significantly different between the muscles [F(1, 9) = 2.05, p = 0.19] and between the tasks [F(1, 9) = 2.01, p = 0.19] without significant interaction between the two main effects [F(1, 9) = 1.92, p = 0.20] (Fig. 2. 4C).
3. COG of the OL and NOL areas
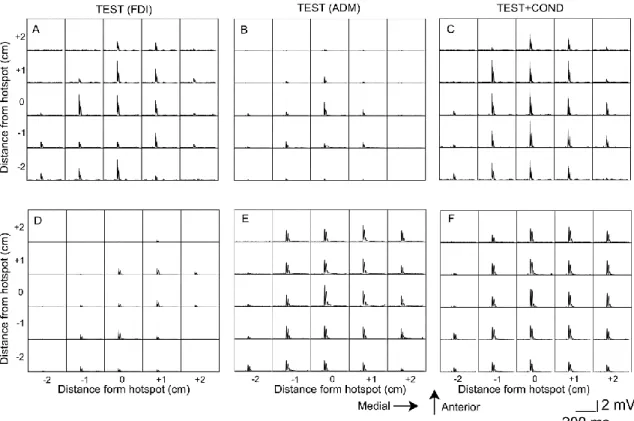
Specimen record of EMG traces each grid of 25-point map is presented in Fig. 2. 5. The COGm of the OL area was 3.8 ± 1.2 mm medial to and 3.7 ± 2.5 mm anterior to the hotspot, and that of the NOL area was 4.2 ± 2.1 mm lateral to and 2.9 ± 2.6 mm anterior to the hotspot in the FDI muscle (Fig. 2. 6A). The COGm of the OL area was 5.0 ± 1.6 mm medial to and 5.5 ± 2.5 mm anterior to the hotspot, and that of the NOL area was 6.9 ± 1.4 mm medial to and 3.9 ± 3.5 mm posterior to the hotspot in the ADM muscle. The COGm in the medio-lateral axis was significantly different among the four sites [F(3, 35) = 8.93, p < 0.05]. A post-hoc test revealed that the COGm of the NOL area in the FDI muscle was significantly lateral to the other three groups of the sites (p < 0.05). In contrast, no significant difference in COGm in the anterior-posterior axis was found among that four groups of the sites [F(3, 35) = 2.10, p = 0.12]. The COGc of the OL area was 4.1 ± 1.3 mm medial to and 4.0 ± 2.5 mm anterior to the hotspot, and that of the NOL area was 4.3 ± 2.2 mm lateral to and 3.0 ± 2.6 mm anterior to the hotspot in the FDI muscle (Fig. 2. 6B). The COGc of the OL area was 4.9 ± 1.6 mm medial to and 5.7 ± 2.4 mm anterior to the hotspot, and that of the NOL area was 7.0 ± 1.4 mm medial to and 3.9 ± 3.5 mm posterior to the hotspot in the ADM muscle. The COGc in the medio-lateral axis was significantly different among the four areas [F(3, 35) = 8.80, p < 0.05]. A post-hoc test revealed that the COGc of the NOL area in the FDI muscle was significantly lateral to the other three areas (p < 0.05). In contrast, COGc in the anterior-posterior axis was not significantly different among the four groups of the areas [F(3, 35) = 2.20, p = 0.10].
Fig. 2. 5 Specimen EMG traces. Each trace indicates the average of the six rectified EMG
traces in the time window between the period 110 ms before TMS and the period 240 ms after TMS. EMG traces in the upper panels are from the FDI muscle (A-C) and those in the lower panels are from the ADM muscle (D-F). An EMG response in each trace indicates MEP.
4. Task effect on the OL and NOL areas
In the FDI muscle, the number of active TMS sites in the OL area was 4.1 ± 0.8 during the TEST task and 4.9 ± 0.8 during the TEST+COND task (Fig. 2. 7A). The number of active TMS sites in the NOL area was 5.0 ± 1.3 during the TEST task and 5.5 ± 1.1 during the TEST+COND task. The number of active TMS sites was not significantly different between the tasks [F(1, 9) = 1.90, p = 0.20] or between the areas [F(1, 9) = 0.42, p = 0.53], without significant interaction between the two main effects [F(1, 9) = 0.02, p = 0.89]. In the ADM muscle, the number of active TMS sites in the OL area was 4.4 ± 0.9 during the TEST task and 4.8 ± 0.9 during the TEST+COND task (Fig. 2. 7D). The number of active TMS sites in the NOL area was 1.6 ± 0.3 during the TEST task and 0.9 ± 0.3 during the TEST+COND task. The number of active TMS sites was not significantly different between the tasks [F(1, 8) = 0.11, p = 0.75], but the number of active TMS sites in the NOL area was significantly smaller than that in the OL area [F(1, 8) = 18.02, p < 0.05], without significant interaction between the two main effects [F(1, 8) = 1.29, p = 0.29].
MEP area was not significantly different between the tasks [F(1, 9) = 4.96, p = 0.05], but significantly different between the OL and NOL areas [F(1, 9) = 21.16, p < 0.05] with significant interaction between the two main effects [F(1, 9) = 6.18, p < 0.05] in the FDI muscle (Fig. 2. 7B). Test of the simple main effect revealed that MEP area during the TEST+COND task was significantly smaller than that during the TEST task in the NOL area [F(1, 16) =10.63, p < 0.05], and MEP area of the NOL area was significantly smaller than that in the OL areas during the TEST+COND task [F(1, 17) = 26.50, p < 0.05]. The amount of the decrease in the MEP area in the NOL area was 18% in the FDI muscle. In the ADM muscle, MEP area was not significantly different between the tasks [F(1, 8) = 0.07, p = 0.80] or between the sites [F(1, 8) = 4.96, p = 0.06], without significant interaction between the two main effects [F(1, 8) = 0.10, p = 0.76] (Fig. 2. 7E).
In the FDI muscle, CSP duration of the OL area was 164.5 ± 9.6 ms during the TEST task and 160.0 ± 8.6 ms during the TEST+COND task (Fig. 2. 7C). CSP duration in the NOL area in the FDI muscle was 161.2 ± 10.7 ms during the TEST task and 139.7 ± 9.9 ms during the TEST+COND task. CSP duration was not significantly different between the tasks [F(1, 9) = 3.94, p = 0.08], but significantly different between the sites [F(1, 9) = 7.63, p < 0.05] with significant interaction between the two main effects [F(1, 9) = 5.67, p < 0.05]. Test of the simple main effect revealed that CSP duration during the
TEST+COND task was significantly shorter than that during the TEST task in the NOL area [F(1, 14) = 8.29, p < 0.05], and revealed that CSP duration in the NOL area was significantly shorter than that in the OL areas during the TEST+COND task [F(1, 17) = 13.29, p < 0.05]. The amount of the decrease in the CSP duration of the NOL area was 12% in the FDI muscle. In the ADM muscle, CSP duration of the OL areas was 154.6 ± 6.6 ms during the TEST task and 140.4 ± 6.7 ms during the TEST+COND task (Fig. 2. 7F). CSP duration of the NOL area was 157.1 ± 9.7 ms during the TEST task and 155.3 ± 7.9 ms during the TEST+COND task. CSP duration was not significantly different between the tasks [F(1, 8) = 3.25, p = 0.11] or between the areas [F(1, 8) = 2.13, p = 0.18] without significant interaction between the two main effects [F(1, 8) = 3.79, p = 0.09].
IV. Discussion 1. Summary
The present study investigated whether the facilitatory and inhibitory circuits of the motor area of tonically contracting hand muscle are modulated by tonic contraction of the adjacent hand muscle. The NOL area of the MEP map and that of the CSP map in the FDI muscle were suppressed by tonic contraction of the ADM muscle, but these modulations were absent in the OL areas of the maps in the FDI muscle and both in the OL and NOL areas of the maps in the ADM muscle.
2. Methodological consideration
In the experiment 1, the effect of tonic contraction of the ADM muscle on the active TMS sites of the MEP map in the tonically contracting FDI muscle was investigated43.
In the experiment 1, participants abducted the index and/or little fingers against rigid plates fixed over a table. When abducting the fingers against the fixed rigid plates, cutaneous sensation must have been produced by counter force from the plates. Nevertheless, in the experiment 2, cutaneous sensation was not greatly produced during the tasks, because the index and/or little fingers were freely abducted. Thus, cutaneous sensation must not be the cause of modulation of the active TMS sites of the maps. When moving the fingers freely, proprioceptive afferents from the contracting muscle are produced. However, proprioceptive afferents must not be related to modulation of the active TMS sites of the maps as well, because velocity of finger motion was almost zero when TMS was delivered. MEP is dependent on bEMG level33, 34, although the
CSP is not53, 56. Nevertheless, pre-stimulus bEMG level must not have affected the MEP
map in the tested muscle, because EMG activity was maintained at a certain level and indeed the level was not significantly different among the TMS sites and among the tasks. Fatigue-induced facilitation of the MEP onsets after 6 min of sustained contraction of the tested muscle with 20% of MVC and that of the CSP onsets after 13 min of that35. However, in the present study, each session terminated before the onset of
fatigue: The participant sustained target EMG level (10% of MVC) only about 30 s each session. Thus, fatigue within each session must not be the cause of the modulation of the active TMS sites of the maps. In addition, fatigue across the sessions must not be the cause of modulation of the active TMS sites of the maps as well, because the effect of long-term fatigue was cancelled by random alternation of the TMS sites and tasks session by session. Abduction of the index finger in the TEST task of the FDI muscle was smaller than that in the TEST+COND task of the same muscle. This may be related to change in mechanical constraint induced by abduction of the little finger: The tension
of the connective tissues in the hand increased during little finger abduction and increased passive force pulling the index finger to the side of the little finger. The number of active TMS sites, which was sum of the number of the active TMS sites in the OL and NOL areas, was around 7 the present study. The number of the active TMS site in the hand muscles was from 20 to 40 when MEP size larger than 10 μV was considered to be active7, but that was around 6 when MEPs larger than 2/3 of maximum
MEP size was considered to be active26. Thus, the small number of the active TMS site
in the present study must be due to strict criteria of the active TMS site; Only the MEPs larger than 2/3 of maximum MEP size was considered to be active as same criteria as the study by Reilly and Mercier26. The number of the active TMS sites must not be the
cause of modulation of the active TMS sites of the maps, because the number was not significantly different between the tasks.
3. Hotspot
The MEP and CSP elicited at the hotspot of the TMS site in tonically contracting tested muscle were not modulated by tonic contraction of the conditioned muscle. This finding was consistent with a previous finding that tonic contraction of the FDI muscle did not modulate the MEP and CSP elicited at the hotspot in the tonically contracting ADM muscle6. MEP size as the function of TMS intensity forms a sigmoidal curve33, 57. High
intensity of TMS was delivered to elicit prominent length of the CSP in our present study and in the previous study by Poston and colleagues6: In our present study, TMS
with intensity of 120% of RMT was delivered during 10%MVC of tonic contraction, and in the previous study by Poston and colleagues6, TMS with intensity of 130% of
RMT was delivered during 5%MVC of tonic contraction. Accordingly, one may speculate that MEPs in the tested muscle elicited by high intensity of TMS at the hotspot was not modulated by tonic contraction of the conditioned muscle because of ceiling effect due to large MEP size. However, this speculation is not likely, because even when TMS with intensity at the RMT was delivered over the hotspot, the MEP in the FDI muscle at rest was not facilitated by tonic contraction of the ADM muscle in a previous study43.
Moreover, the facilitatory and inhibitory circuits of the motor area at the hotspot of the TMS site both in the FDI or ADM muscle were not modulated by tonic contraction of the conditioned muscle, indicating that modulation of the circuits of the motor area at the hotspot of the TMS site in the tested muscle induced by tonic contraction of the conditioned muscle is not dependent on the muscle tested. The MEP in the ADM or
abductor pollicis brevis (APB) muscle elicited at the hotspot of the TMS site was suppressed by phasic contraction of the FDI muscle6, 15, 16, 58, and the MEP in the ADM
or APB muscle at rest elicited at the hotspot of the TMS site was facilitated by tonic contraction of the FDI muscle14, 16. These previous findings were derived from motor
task in which the conditioned muscle was phasically contracted or the tested muscle was at rest. In contrast, when the tested muscle was tonically contracted, modulation of the MEP and/or CSP elicited at the hotspot of the TMS site during tonic contraction of the adjacent muscle was absent6, 43. Accordingly, modulation of the facilitatory and
inhibitory circuits of the motor area at the hotspot of the TMS site in the tested muscle induced by contraction of the conditioned muscle is absent when both the tested and conditioned muscles are tonically contracted.
4. OL and NOL areas
The facilitatory and inhibitory circuits of the NOL area in the FDI muscle were suppressed by tonic contraction of the ADM muscle, although such suppression was not observed either in the OL area of the FDI muscle or in the OL and NOL areas of the ADM muscle. This finding indicates that the NOL area of tonically contracting FDI muscle is the particular area where motor command to the ADM muscle suppresses. The NOL area of the tested muscle is the surround of the active TMS sites of the adjacent hand muscle. Thus, suppression of the NOL area of the FDI muscle induced by tonic contraction of the ADM muscle means that motor command to the ADM muscle suppresses surround of the motor area of the ADM muscle. This finding may be explained by surround inhibition: Phasic contraction of one hand muscle suppresses surround of the motor area of the muscle6, 15, 16, 58. Although such suppression of the
MEP elicited at the hotspot induced by phasic contraction of the adjacent hand muscle has not been observed when the muscle was tonically contracted according to some of these previous studies, the present finding indicates a possible view that suppression of the MEP induced by tonic contraction of the adjacent muscle is observable in the MEPs across some of the motor area.
In contrast to the finding in the FDI muscle, tonic contraction of the FDI muscle did not modulate the NOL and OL areas in the ADM muscle. This muscle specific effect may be related to the locus of the motor area in the muscles. The NOL area of the FDI muscle was particularly lateral to the OL area of the FDI muscle and to the OL and NOL areas of the ADM muscle. Accordingly, the present finding is possibly explained by a view that the facilitatory and inhibitory circuits in the lateral motor area of the FDI
muscle is particularly susceptible to motor command to the ADM muscle.
The muscle specific effect may be explained by different supraspinal control between the index and little fingers. The index finger moves independently in daily activities. Independent characteristics of the index finger has been supported by previous findings that involuntary force production of the fingers induced by force production of the index finger is smaller than that induced by force production of the little finger44-46, 59, and
tapping speed of the index finger is faster than that of the little finger when single-finger or double-finger tapping is performed47. The FDI and ADM muscles become the
synergists when abducting the index and little fingers together, because simultaneous abduction of the index and little fingers is ordinary in daily activities; i.e. spreading out the fingers. When those muscles act as the synergists, isolated motor command to the FDI muscle may interfere with coordinated activity of those muscles. Given this, suppression of the facilitatory and inhibitory circuits of the NOL area of the FDI muscle induced by tonic contraction of the ADM muscle is reasonably explained by decrease in susceptibility of the circuits of the motor area in relatively independent FDI muscle to prevent isolated activity of the muscle causing independent index finger movement, when the FDI muscle acts together with the ADM muscle as the synergist.
5. Conclusion
The facilitatory and inhibitory circuits of the motor area of tonically contracting FDI muscle, non-overlapped with those in the ADM muscle, was suppressed by tonic contraction of the ADM muscle, but such suppression was absent in the motor area of the ADM muscle. This area dependent and muscle specific suppression is possibly caused by greater susceptibility of the facilitatory and inhibitory circuits in the lateral motor area of the FDI muscle to motor command for the ADM muscle, or by smaller susceptibility of the motor area in the FDI muscle, which acts for the independent finger, so that isolated activity of the muscle is suppressed when the muscle acts together with the adjacent hand muscle as the synergist.
Reference
1. Zatsiorsky VM, Li ZM, Latash ML (2000) Enslaving effects in multi-finger force production. Exp Brain Res, 131:187-195.
2. Li S, Latash ML, Zatsiorsky VM (2003) Finger interaction during multi-finger tasks involving finger addition and removal. Exp Brain Res, 150:230-236.
3. Huntley GW, Jones EG (1991) Relationship of intrinsic connections to forelimb movement representations in monkey motor cortex: a correlative anatomic and physiological study. J Neurophysiol, 66:390-413.
4. Schieber MH, Poliakov AV (1998) Partial inactivation of the primary motor cortex hand area: effects on individuated finger movements. J Neurosci, 18:9038-9054. 5. Tyč F, Boyadjian A (2011) Plasticity of motor cortex induced by coordination and
training. Clin Neurophysiol, 122:153-162.
6. Poston B, Kukke SN, Paine RW, Francis S, Hallett M (2012) Cortical silent period duration and its implications for surround inhibition of a hand muscle. Eur J Neurosci, 36:2964-2971.
7. Wassermann EM, McShane LM, Hallett M, Cohen LG (1992) Noninvasive mapping of muscle representations in human motor cortex. Electroencephalogr Clin Neurophysiol, 85:1-8.
8. Wilson SA, Thickbroom GW, Mastaglia FL (1995) Comparison of the magnetically mapped corticomotor representation of a muscle at rest and during low-level voluntary contraction. Electroencephalogr Clin Neurophysiol, 97:246-250.
9. Sanes JN, Donoghue JP, Thangaraj V, Edelman RR, Warach S (1995) Shared neural substrates controlling hand movements in human motor cortex. Science, 268:1775-1777.
10. Beisteiner R, Windischberger C, Lanzenberger R, Edward V, Cunnington R, Erdler M, Gartus A, Streibl B, Moser E, Deecke L (2001) Finger somatotopy in human motor cortex. Neuroimage, 13:1016-1026.
11. Dechent P, Frahm J (2003) Functional somatotopy of finger representations in human primary motor cortex. Hum Brain Mapp, 18:272-283.
12. Kleinschmidt A, Nitschke MF, Frahm J (1997) Somatotopy in the human motor cortex hand area. A high-resolution functional MRI study. Eur J Neurosci, 9:2178-2186.
13. Cunningham DA, Machado A, Yue GH, Carey JR, Plow EB (2013) Functional somatotopy revealed across multiple cortical regions using a model of complex motor task. Brain Res, 1531:25-36.