■
Research Note ■Livestock
Ownership
Patterns
among
the
Scheduled
Tribes
in Rural India: A Study
based on National
Sample
Survey
Data
●
Takashi Shinoda
Introduction
In the wake of a downward shift in both land holding and operational holding structure over forty years in the 1960s, the marginal and small operational holding size classes (hereinafter OHSCs) emerged as the core sector of milk production. The combined share of the classes in the total number of in-milk cows and she-buffaloes was 66 percent in 1991. In partic-ular, the share of the marginal OHSC increased tremendously from 20 percent in 1971 to 44 percent in 1991.
Accordingly, recent studies tend to project livestock development as an effective strategy for raising and stabilizing the incomes of low income groups, diversifying their source of income, generating employment oppor-tunities, and coping with risks caused by drought.
Despite enthusiasm among administrators and researchers associated
with promoting livestock development, most of the case studies related to
篠 田 隆 Takashi Shinoda, Faculty of International Relations, Daito Bunka
Univer-sity.
Subject: Socio-economic History of India.
Articles: "Institutional Change and Entrepreneurial Development: SSI Sector", Economic and Political Weekly 35 & 36, Aug 26-Sep. 2, 2000, pp. 3205-3216;
"Legal, Institutional Development and Sweepers in Ahmedabad", in Takashi Shinoda (ed.) , The Other Gujarat: Social Transformation among Weaker Sections. Mumbai: Popular Prakashan, 2002, pp. 66-95.
112 Journal of the Japanese Association for South Asia Studies, 16, 2004
livestock have been conducted in regions where dairy industries are highly developed. We have plenty of research works and case studies on Punjab, Haryana and Gujarat, the heartland of livestock and dairy development in India. On the contrary, there have been few studies on livestock rearing in the backward regions and by the backward classes. In order to understand how livestock rearing is associated with the poorer sections, it is necessary to conduct research in these areas.
Among the backward classes, the Scheduled Tribes (hereinafter STs)1) and the Scheduled Castes (hereinafter SCs) 2) deserve special attention. Firstly, they constitute a large population in rural India. More importantly, a large segment of them falls into the category of the poor. Therefore, stud-ies on their livestock rearing may give us fresh insight into the basic na-ture of livestock economy among the poor. Since they are the main benefi-ciaries of the Integrated Rural Development Programme') and other de-velopmental schemes promoting the ownership of livestock, research on STs and SCs will also be useful for evaluating these schemes.
Secondly, STs and SCs face their own hardships and difficulties regarding livestock rearing. They suffer from a kind of stigma. Besides, STs are basi-cally isolated in tribal areas,' while SCs are under fierce oppression and competition from 'other social groups'.5) These aspects, which affect their ownership and rearing of livestock, will be isolated and analyzed. It is worth developing a specialized field of "ST and SC studies" focused on their live-stock rearing.
Disparity in the level of dairy development between regions and among social groups is a very important factor for assessing the overall dairy de-velopment of India. We observe a keen contrast in this regard between the ST and non-ST regions, and between ST and non-ST households. The
diffusion of mechanization and the commercialization of milk production seem to be the most important factors for regulating the livestock compo-sition of a region or of a social group. There are some isolated case studies reporting various obstacles for dairy development in the tribal areas or among STs, but they are not sufficient to draw a comprehensive picture.
It is anticipated from the isolated case studies that mixed farming with the use of bullocks still dominates and the commercialization of milk pro-duction is yet to develop in the tribal areas and among most of the ST communities.
livestock rearing among the STs in the central tribal bele) based on the relevant National Sample Survey (hereinafter NSS) 7) reports. Since not much data on SCs is available, we deal with STs in this paper, focusing on the associations between livestock rearing and other factors such as land hold-ing, monthly per capita expenditure (hereinafter MPCE) ,8) household type among STs with due attention to regional variations. The central tribal belt is not a homogeneous unit. Its western part is greatly influenced by modernization, while mixed farming still predominates in the central and eastern parts.
The first section deals with changes in the numerical composition of livestock with due consideration to regional variations. The second section examines livestock ownership patterns among STs and SCs and highlights the problems of each group. The third section, the main part of this paper, focuses on livestock rearing in connection with other factors among the STs in the central tribal belt.
1. Changes in the Number and Composition of Livestock
First of all, let us trace the recent trends in the number and composition of livestock in India as a whole, and then examine the particular feature of livestock composition in the eight states which are located in the central tribal belt.
In India, the livestock economy has long been subordinate to the agri-cultural sector. In a mixed farming system, the livestock sector played an important role in providing draft animals (mostly bullocks)for agriculture.
Accordingly, the primary function of cows was to reproduce he-calves . Milk and meat production has been a secondary function. However, new development in technology and increasing demand for milk resulted in changes in livestock composition in recent years, as presented in Table 1. This shows that the growth rate of indigenous cattle population has come to a standstill in recent years, i.e. between 1987 and 1992.
The absolute number of adult males among indigenous cattle increased in India till 1987, and then slightly decreased by 1992. We observe a clear regional disparity regarding the number: increasing trend in the Eastern region, and declining trend in the Northern and Southern regions . Its com-positional share among cattle clearly shows a declining trend though the pace is relatively slow in India as a whole. Its compositional share among
cattle was around 38 percent across the regions in 1992.
The number of indigenous adult females remained more or less constant between 1982 and 1992, with the only exception of 1987 when it declined. Interestingly, the compositional share of indigenous in-milk adult females shows a steady increase in all regions except the Eastern region where the demand for adult males continued to increase. But, in India as a whole, we can observe a long-term compositional change toward milk production among indigenous adult females.
Data on crossbred cattle was taken in the livestock census for the first time in 1982. At that time, its absolute number was merely 3 million, 4.6 percent of the cattle population in India. The number doubled by 1992, and its share also increased to 7.4 percent. Initially, crossbred adult males were utilized as draft animals, particularly in the Northern region, though there were several disadvantages. Their population share among crossbred cattle soon declined, as the share of adult females increased rapidly in the course of allotting more resources for milk production. In this process, the compositional share of in-milk adult females also increased steadily. There is a large regional disparity in the population of crossbred cattle. They are concentrated in the Northern and Southern regions.
The share of buffaloes among the bovine population increased steadily from 28 percent in 1977 to 31 percent in 1992. Buffaloes gained more im-portance as the main milk animal despite the indifference of state policy toward their promotion. Accordingly, the sex composition of buffaloes also shifted in favour of females in all regions except the Eastern region where adult males are often used as draft animals. There is an upward trend in the ratio of in-milk females, while the ratio of dry adult females is declining. Regionally, nearly half of the buffalo population is concentrated in the Northern region.
We may sum up the salient features of bovine development between 1977 and 1992 as follows: (1) bovine composition in India underwent drastic changes; (2) the population of draft animals has been stagnant in recent years. In the three regions, there is a clear decrease in population of draft animals, though it is still increasing in the Eastern region; (3) there is a clear shift of bovine composition towards milk production, which is reflect-ed not only in the high growth rates of female buffalo and crossbrreflect-ed cow population, but also in the compositional changes in favour of in-milk ani-mals including local breed of cows.
116 Journal of the Japanese Association for South Asia Studies, 16, 2004
Now, we would like to examine the livestock composition of the eight states that are located in the central tribal belt. Since the breakdown of figures of livestock census for tribal areas are not available, the livestock census results of the eight states are presented in Table 2 as a substitu-tion. Nevertheless, we can grasp particular features of livestock composi-tion in the central tribal belt as follows.
Firstly, the number of male cattle exceeds that of female cattle for both 1982 and 1992, which shows a keen contrast with other parts of India where the number of male per 100 female comes to around only 90 for both the years. This difference suggests that the cattle composition of the eight states is more male-oriented corresponding to the large demand for bul-locks as draft animals. Although the number of male per 100 female in the eight states has declined by 18 points between 1982 and 1992, we still observe a considerable difference with that of other parts of India. Among the eight states, male cattle dominate female cattle in number particularly in those states with a large ST population.
Secondly, crossbred variety has not prevailed in the eight states. On the contrary, crossbred female has increased rapidly to the extent that its share among female cattle has jumped to 21 percent by 1992 in other parts of India. This is a clear indicator that the cattle composition of other parts of India has been driven by the increasing demand for milk, while milk
pro-duction has not been a prime factor influencing cattle composition in the eight states. Among the eight states, the share of crossbred cows among female cattle appears high only in Maharashtra where there is a high
de-mand for milk in Mumbai.
Thirdly, the share of female buffaloes in the milch animals (cows and female buffaloes combined) also confirms that the bovine (both cattle and buffaloes combined) composition of other parts of India is more milk-oriented than that of the eight states, since female buffaloes are more advantageous for milk production than cows both in terms of quantity of milk produced per annum/lactation and fat ratio. Among the eight states, this share tends to appear low in those states with a large ST population.
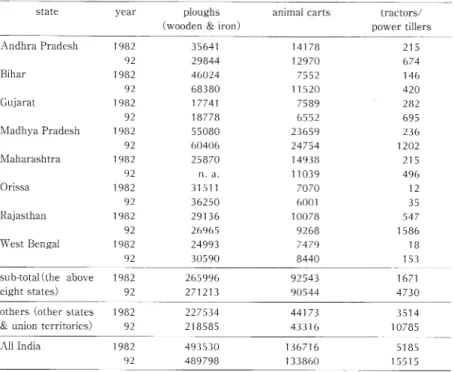
The particular feature of livestock composition in the eight states can also be confirmed by the examination of agricultural implements. As Table 3 shows, the number of tractors/power tillers has tripled in India between 1982 and 1992. The mechanization of agriculture with tractors/power till-ers has gathered momentum in India since the 1980s, though with
con-118 Journal of the Japanese Association for South Asia Studies, 16, 2004
siderable regional variations. The use of tractors has increased in other parts of India with much greater speed and scale. By contrast, the spread of tractors was slower and more limited in the eight states.
The spread of tractors is one of the most important factors in regulating the demand for draft animals since the former tends to replace the latter. Actually, the number of ploughs declined between 1982 and 1992 in other parts of India where there was a widespread use of tractors. On the con-trary, the number of ploughs increased in the eight states during this
period. We should note that the total number of ploughs in the eight
states includes the figures of Maharashtra for 1982, but the corresponding total number for 1992 does not include the figures of Maharashtra due to the non-availability of data. This suggests that the actual increase in the number of ploughs in the eight states would be more than the difference appearing in Table 3. Since the number of ploughs is proportionate to the
Table 3 Distribution of Ploughs, Carts and Tractors by State (1 982-92) (hundreds)
number of draft animals (mostly bullocks), the increase in the number of ploughs confirms an increase in the number of bullocks in the eight states between 1982 and 1992.
Besides cultivation, bullocks are used for transportation. The number of animal carts indicates that draft animals (mostly bullocks) are still widely used for transportation in the eight states, while the role of animal power for transportation is increasingly being replaced by mechanical power in other parts of India.
2. Livestock Ownership Patterns among STs and SCs
2.1 State-wise Distribution of ST and SC Population
According to the 1991 census, the shares of ST and SC population in In-dia are 8.1 percent and 16.5 percent respectively. However, as Table 4 shows, their population shares in rural India appear larger than the above figures because of their high rural population ratios, particularly among the STs. The shares of ST and SC population in rural India appear as 10 percent and 18 percent respectively. Table 4 contains the top eight states according to the size of ST population, which correspond to the major states in the central tribal belt. In these states, the rural population ratio exceeds 90 percent except in Maharashtra. In Gujarat and Andhra Pradesh, the ratio is relatively low. STs in these three states are under more influ-ence of urbanization and commercialization compared to their counter-parts in other states. In terms of the size of rural ST population, Madhya Pradesh attracts special attention as almost one fourth of the rural ST population of India is concentrated in this state. Any change in the socio-economic life of the STs in this state exerts enormous influence on the sta-tistical figures of STs at the national level. Orissa, Maharashtra and Bihar are also influential in this regard. At the state level, the share of rural ST population in the state rural population exceeds 20 percent in Madhya Pradesh, Orissa and Gujarat, while the ratio appears lower in West Bengal and Andhra Pradesh.
The state with the largest rural SC population is Uttar Pradesh which is not included in Table 4. Uttar Pradesh has 23 percent of the rural SC population of India, followed by West Bengal, Bihar and Andhra Pradesh. Rural population ratio among SCs appears relatively large, though not as large as STs, except in Gujarat and Maharashtra. Rural SC population
share in the state rural population is around 28 percent in West Bengal. The share ranges between 10 percent and 20 percent in other states ex-cept Gujarat.
The combined share of STs and SCs in the state rural population dem-onstrates the size of backward group that lags behind other groups in various socio-economic indicators. Among the eight states in Table 4, the share exceeds 40 percent in Madhya Pradesh and Orissa. These two states deserve special attention as they have a massive number of ST and SC population that falls into the category of the 'poor'.
2.2 Land Holding/Operational Holding Structure
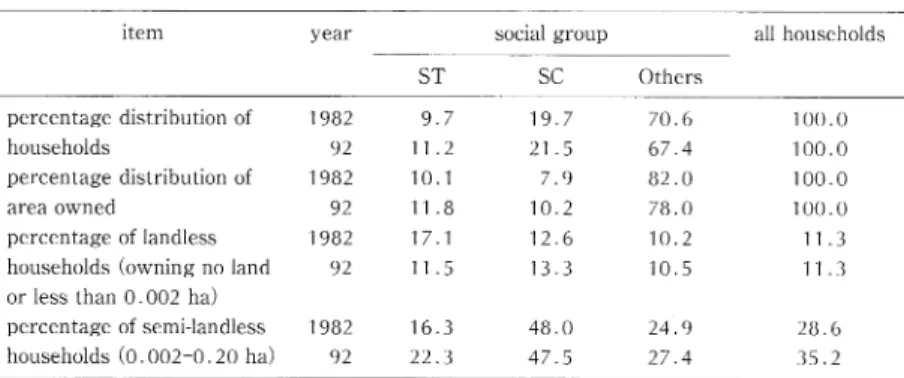
Land is the most important resource for agricultural production and is an asset in rural areas. As Table 5 shows, the SCs lag behind other groups both in percentage distribution of area owned and per household distribu-tion of area owned. The STs appear to be better off than the SCs in that regard. However, we cannot neglect the fact that land owned by the STs tends to be inferior in quality and availability of irrigation. Interestingly, percentage distribution of area owned shows an increasing trend for both STs and SCs between 1982 and 1992. There are several probable reasons behind this. The redistribution schemes of surplus land by the government may be one reason. Also, it is quite possible that the group "Others" is be-coming more interested in raising the quality of their land through irriga-tion and other means rather than increasing the size of holding as new Table 5 Share of ST and SC Households in Total Area Owned and Landlessness
Among Them (1982-92)
Rural
122 Journal of the Japanese Association for South Asia Studies, 16, 2004
technologies spread coupled with the Green Revolution during the refer-ence period.
Table 5 contains two categories of landless: 'landless' and 'semi-landless'. The landless have actually no land for agricultural operations, while the
semi-landless have some land to draw supplemental household income
through various economic activities including livestock and poultry rearing. In all households, percentage of landless households has remained same, but that of semi-landless has increased by 6 points during 1982 and 1992. This corresponds to a trend in downward shift of land holding structure during the period.
2.3 Livestock Ownership Patterns
Before going into the details of ownership of livestock by social group, let us briefly examine the state-wise livestock ownership patterns. As Table 6 shows, there is tremendous disparity in the livestock ownership patterns among states. Rajasthan, Haryana, UP and Punjab are the four topmost states, where the number of households that possess 'buffaloes only' sur-passes that of 'cows only', while ownership of cows is more common than that of buffaloes in most states of the central tribal belt. The 'others' cate-gory of milch animals denotes goats, which are commonly and intensively reared in Rajasthan. Draft animals are being substituted by tractors and power tillers in agriculturally advanced states, where per thousand distri-bution of households that do not own draft animals tends to appear large. Also, in states like Kerala where crop cultivation is not a main agricultural activity, the figure appears large. On the contrary, the figure tends to appear fairly small in Madhya Pradesh and Orissa, where STs reside in large numbers. Interestingly, in states such as Punjab and Haryana where mechanization is gaining momentum, the distribution of households pos-sessing 'single' draught animal appears larger than that of households with
'
a pair or more', while the latter occupies a larger share than that of the former in all states of the central tribal belt. Particularly, in Madhya Pradesh and Orissa, the distribution of households with 'a pair or more'
draught animals far exceeds the national average of 214.
Now, let us compare the livestock ownership patterns among various so-cial groups. As Table 7 illustrates, SCs lag behind both STs and 'others' in
terms of the numbers per thousand households reporting possession of
weak land holding basis among SCs, as examined earlier.The number per thousand SC households that do not possess draft animals is as high as 801 in 1993/94. In the course of deteriorating common property resources (CPRs),9) individual holdings are becoming a prerequisite condition for rearing milch cows and buffaloes (Shinoda 2003). Well developed fodder markets are limited to some pockets in rural India, and complete depen-dence on fodder markets is too costly to rear bovines.
On the other hand, STs, who constitute the land holding class in remote areas, heavily depend on draft animals for cultivation and transportation. Among the ST households that possess draft animals, the share of house-holds owning 'a pair or more' far exceeds that of 'single'. This gap between the two types of ownership tends to be much smaller among SCs and '
other' social groups. This may be attributed to a slow diffusion of mecha-nization in the tribal belt. Ownership of milch animals by ST households is characterized by the dominance of cows. The ownership of buffaloes is yet to gather momentum.
It is interesting to see the cross-sectional relations between ownership of livestock and MPCE (monthly per capita expenditure) by social group. The first point worth noting is that there is no difference in the average MPCE between the owners of 'a pair or more' and of 'single'. In a tradi-tional mix farming system, the owners of 'single' draft animal were basically confined to poor cultivators who could not afford to maintain a pair of bul-locks. However, the situation has changed drastically with the diffusion of mechanical powers in recent years. As a result, the owners of 'single' draught animal include a bulk of cultivators who are shifting toward mechanical cultivation as the owners or hirers of tractors.
Secondly, the average MPCE of households possessing 'buffaloes only' far exceeds that of 'cows only' for all social groups. This is natural because
rearing milch buffaloes demands more resources than rearing cows.
Although the category of cows includes cross-bred varieties, constituting around 10 percent of the cow population in 1992, its influence on average MPCE of households possessing 'cows only' seems to be minor. Most of such households are supposed to have been the owners of both cross-bred cows and buffaloes and are classified as such.
Thirdly, we observe clear differentials in average MPCE for all house-hold categories between STs and 'others' in favour of the latter. The differ-entials in average MPCE for all household categories between STs and
126 Journal of the Japanese Association for South Asia Studies, 16, 2004
SCs are negligible, if any. These two social groups share common features regarding the low level of MPCE, though their life and economic circum-stances vary considerably.
Now, let us examine the relation between land holding and ownership of livestock. As Table 8 shows, the land holding size class is closely related to the average MPCE and the livestock ownership patterns. The average MPCE tends to increase as the size of holdings increases, showing that the size of land holdings is the most decisive factor in determining the level of
MPCE in rural areas. Regarding the ownership of draft animals, the house-holds of size classes with less than 0.40 ha cannot afford to own draft ani-mals or it is not viable economically, while the number of households that possess draft animals increases as the size of holdings increases. Notably, the average MPCE of the households with 'single' draft animals exceeds that of 'a pair or more' in most of the size classes. Also, it is noteworthy that the average MPCE of the household with 'none' draft animals exceeds that of the household with draft animals in all the size classes. It is antici-pated that many households with tractors but without draft animals are included in the household category of 'none' draft animals, particularly
among the households classified into the medium and large size classes.10) The ownership patterns of milch animals vary from those of draft ani-mals. Although per thousand distribution of households that possess milch animals is not as high as that of other size classes, around 140 households for landless (less than 0.01 ha) and 280 households for marginal (here, we
refer to 0.01-0.40 ha size) households per thousand households respectively report the possession of milch animals. Since these classes consist of nearly half of rural households in 1992, their animals constitute a fair percentage of total milch animal population in rural India. Also, it is interesting to note that the number of per thousand households that possess buffaloes in-creases as the size of holdings inin-creases, while that of cows inin-creases till the size class 1.01-2.00 ha, but shows a declining trend in the medium and large size classes. Here again, the average MPCE of households with pos-session of 'buffaloes only' far exceeds that of 'cows only' for all size classes. Let us now briefly examine the relationship between livestock own-ership patterns and the type of households.11) As Table 9 shows, there are sharp differentials in the livestock ownership patterns between the house-hold type of 'self-employment in agriculture' and the other four househouse-hold types. Among the former type of households, half of them possess draft
animals, and the number of households possessing 'a pair or more' draught animals far surpasses that of 'single'. Whereas among the other household types, the number of households that possess draft animals falls in the level of 150 or so per thousand households. This is by no means a small number, suggesting that one seventh of them are associated with agri-cultural operations in their own holdings or in leased lands. Among them, the gap in the number of households between 'a pair or more' and 'single' draught animals appears relatively smaller compared to the former house-hold type.
The household type of 'self-employment in agriculture' is also dominant in the ownership of milch animals. Around 720 per thousand households of this household type possess milch animals. What is more, ownership of buffaloes prevails among the households of this household type. Interest-ingly, we find many similarities among the households of the other house-hold types in terms of per thousand number of househouse-holds that possess milch animals (slightly more than 300) and the relative share between 'cows only' and 'buffaloes only'. Ownership of cows is more common among the households of these household types.
Distribution of average MPCE attracts our attention, because it is clearly associated with the type of household. The level of average MPCE is lowest among the households of 'agricultural labour', followed by 'other labour'. The level of average MPCE of 'others' category is highest among the house-holds of all types, while that of both employed in agriculture' and 'self-employed in non-agriculture' is located in between. Within each household type, we again observe some differentials in the level of average MPCE between 'cows only' and 'buffaloes only', which is in favour of the latter across all household types.
3. Livestock Rearing among the STs
In this section, we examine the socio-economic conditions of STs related to livestock rearing with due attention to regional variations among the states and vis-a-vis non-STs in tribal areas.
As Table 10 shows, STs are not necessarily dominant in population in tribal areas. The ST population constitutes 36 percent in the central tribal belt. The ST population surpasses the non-ST population in tribal areas in Gujarat and Madhya Pradesh only, while the share of ST population in
tribal areas falls below 30 percent in Andhra Pradesh, Maharashtra and West Bengal. Interestingly, the population share of STs is positively associated with neither their share in area owned nor average holding in tribal areas. The average share of STs in total owned area of all the states in the central tribal belt is 34 percent, almost corresponding to their population share in tribal areas. However, in Gujarat, Maharashtra and Rajasthan, STs lag behind non-STs in their share in area owned vis-a-vis their population share, suggesting considerable differentials with non-STs in resource availability and socio-economic mobility. On the contrary, in Bihar and Orissa, the share of STs in area owned exceeds that of their population. However, this does not necessarily indicate their advantage in the level of MPCE.
Per thousand distribution of households that fall into the combined category of landless (`nil' category) and semi-landless is 347 for all the STs, and 456 for all the non-STs in tribal areas of rural India. Thus, the com-bined share of STs appears smaller than that of non-STs, but the share of landless is slightly larger than that of the non-STs. There are considerable variations in the share of landless among the states. In Gujarat and Maharashtra, the share of landless is as high as 400 and above per thousand ST households. On the contrary, the share falls short of 100 in Bihar, Orissa and Rajasthan. However, we have to keep in mind that the share of landless does not necessarily correspond to the actual share of households that engage in agricultural and other labour activities as a main source of household income.
The NSS classifies those households with 4.05 ha and above as the mid-dle and large land holding groups.' Per thousand distribution of house-holds that fall into this group is 53 for all the STs, and 68 for all the non-STs in the tribal areas of rural India. Thus, the share of this land holding group is slightly favourable for the non-STs in the tribal areas of India. Among the eight states in the central tribal belt, the STs lag far behind the non-STs in this share in Gujarat, Maharashtra and Rajasthan.
Now, let us examine the distribution of ST households by livelihood class. As Table 11 illustrates, major sources of household livelihood are `
settled cultivation' and 'agricultural/plantation labour' (hereinafter agri-cultural labour) for STs and non-STs in rural India. Though the dif-ferentials in the household shares of these livelihoods between STs and non-STs are not considerable, it is confirmed that the shares of both
tled cultivation' and 'agricultural/plantation labour' among ST households
exceed the corresponding shares among non-ST households. The
liveli-hood structure of non-STs is more diversified than that of STs. We can find more shares among non-ST households than those among ST house-holds in the categories of 'self-employment in non-agriculture' and 'others', which tend to show higher MPCE as examined earlier.
There are tremendous variations in the distribution of ST households by livelihood class among the states. Self-employment in settled cultivation constitutes a principal source of household livelihood in Bihar, Madhya Pradesh and Rajasthan. While, in Gujarat, Maharashtra and West Bengal, the share of 'agricultural labour' among ST households appears extremely large. The gap in the household shares of 'agricultural labour' between STs and non-STs also appears large. In addition, the share of 'settled cultiva-tion' among ST households is considerably lower than that of non-STs in these states, suggesting that large segments of STs in these states are in-corporated in the regional economy as a major source of agricultural labourers. STs in Rajasthan are in a similar situation though they are mainly included as 'other labourers'.
Among various categories of livelihood, 'livestock/poultry' shows the lowest share, 4 per thousand households, among ST households. The cor-responding share among non-ST households is slightly higher than that of ST households. However, the share is still very low due to the poor cir-cumstances for dairy development in the tribal areas as far as the central tribal belt is concerned. The tribal areas generally lack facilities and incen-tives for economically viable dairy development. Vast areas of the tribal belt are virtually cut off from the various government as well as private services including flood operation programs. Despite these disadvantages, livestock and poultry rearing is common among the STs for raising and stabilizing their income, diversifying their source of income, generating employment opportunities, and coping with risks caused by drought. Re-gional variations in the share of 'livestock' are minor. The share appears slightly higher in Bihar, while the share falls to nil in Gujarat and Orissa, where difference in this share with that of non-STs appears large. In Rajasthan, the household share of livestock appears large among non-ST households. Most probably, those households that specialize in rearing a large number of ovine (sheep and goats) are grouped into this category.
134 Journal of the Japanese Association for South Asia Studies, 16, 2004
with subsistence farming, still prevails among STs in tribal areas. As Table 12 reveals, livestock/poultry rearing is so common among them, and as many as 769 households per thousand ST households possess some live-stock and/or poultry. Although Table 12 presents the crude number of animals by kind without any breakdown figures by sex and by age-group, it suffices our purpose to outline the basic livestock ownership patterns among STs in comparison with those of non-STs.
Cattle are extensively reared as draft animals and/or milk animals among STs, showing 576 per thousand ST households. The figure exceeds 700 in Bihar and Rajasthan. Even in Gujarat, where the figure appears least among the states, around 400 households per thousand ST households possess cattle. STs are more familiar with cattle rearing than non-ST households in the tribal areas of rural India. The average number of cattle among cattle possessing households shows the intensity of cattle rearing at the household level. It is 4.0 for the ST households possessing cattle, and 3.8 for the non-ST households possessing cattle. Although Table 12 does not contain data regarding the distribution of cattle by sex or age, we may safely infer that the cattle composition in the tribal areas is still centred on the procurement of bullocks from the examination of Table 2 and Table 3. The number of buffaloes per thousand ST households appears very small everywhere in India. Buffalo rearing is yet to gain momentum in tribal areas. However, it is worth noting that variation among the states in the number of buffaloes per thousand ST households is far wider than that of cattle. Rajasthan tops in the number of buffaloes per thousand ST house-holds, followed by Gujarat. The number is the smallest in West Bengal. Another difference with the distribution of cattle is that the ownership of buffaloes is confined to a small segment of ST community, showing 135 per thousand ST households only in India. Buffaloes are relatively widely owned by ST households in Rajasthan, and to a lesser extent in Gujarat. Non-STs are slightly ahead in owning more number of buffaloes per thousand house-holds in India.
Ovine constitute very important economic animals for ST households. A large number of ovine are concentrated in Rajasthan, 2355 animals per thousand ST households, and the distribution of households that possess ovine constitutes as much as 416 per thousand ST households. Bihar follows Rajasthan in both terms. Particular importance of ovine for ST households is reflected in their superiority in the number of ovine per thousand
136 Journal of the Japanese Association for South Asia Studies, 16, 2004
households over that of non-ST households in all states except Andhra Pradesh and West Bengal. Fairly large number of ovine is distributed in the states with large ST population.
Pigs are mainly owned by STs in the central tribal belt. STs still main-tain their traditional linkage with pig rearing. Non-STs are basically reluc-tant to own pigs because they consider rearing pigs as dirty. As is shown in Table 12, pig rearing is concentrated in West Bengal, Bihar and Orissa, i.e., in Eastern India. Particularly, in West Bengal, as many as 250 per thousand ST households possess pigs. On the contrary, there is no pig rearing in states in Western India.
Rearing poultry is a very common activity among ST households throughout the states in the central tribal belt. Surprisingly, in Bihar, Orissa and West Bengal, slightly more than half of the ST households possess poultry. The average number of poultry owned by such households comes to 7.2 for all India. It is very clear that most of the ST households rear poultry on a small scale, as a supplemental source of household income. Non-ST households in tribal areas also possess poultry, showing around 200 per thousand households, which is not a small number compared with those households in non-tribal areas. Yet, there is a large difference be-tween ST and non-ST households in the distribution of households posses-sing poultry in tribal areas.
Let us consider the labour inputs for rearing livestock and poultry. Rearing livestock and poultry includes various types of activities, which are generally done with division of labour among the family members. Grazing, however, is often contracted to other parties with payment in kind or in cash. Moreover, demarcation between livestock related work and domestic work is unclear, therefore, it is very difficult to have a real picture of labour inputs for livestock rearing at the household level. Still, it is useful to check the crude figures regarding distribution of persons in the rearing of livestock and poultry by activity status and by sex. As Table 13 shows, per thousand distributions of persons associated with livestock and poul-try rearing as a principal usual activity") appears low for both sexes and for both STs and non-STs. It is confirmed that livestock rearing is basically a subsidiary activity not only at the household level but also at the indi-vidual worker level. Among the states, livestock rearing has some impact on generating employment opportunities for workers classified as 'work-ing' status in Rajasthan, and to a lesser extent, in Andhra Pradesh only. In
138 Journal of the Japanese Association for South Asia Studies, 16, 2004
the non-tribal regions where dairy business is more commercialized, the figure tends to appear higher.
Those who are classified in 'not working' category are also engaged in rearing livestock as a subsidiary gainful activity,14) though the rate of par-ticipating in this service remains low except in the above two states.
The figures in the column of current weekly activity status 15) are more realistic than the figures of the preceding two columns. However, there are still some limitations in tracing minor labour inputs with less than one hour per day that is not recorded in the NSS survey, or when labour inputs in terms of time for livestock and poultry come short of other activities during the reference period. As a result, only a small segment of actual workers is recorded in this column. Still, the figures in the column are impressive in the following two respects. First, ST females are much more widely involved in rearing livestock and poultry than ST males. Secondly, the differentials among the states in the distribution of ST females engaged in livestock and poultry rearing as current weekly activity status are much smaller that the preceding two columns. Thirdly, the figures of ST females clearly exceed those of non-ST females in most of the states. Gujarat and Maharashtra are two exceptions. All these suggest that rearing livestock and poultry constitutes a routine work of ST females, but the work is not so intensive as to get into the principal usual activity status due to the small scale and self-sufficient nature of livestock rearing.
The particular characteristics of livestock rearing among ST households in the central tribal belt can be summarized as follows. Firstly, their live-stock rearing is basically self-sufficient and associated with subsistence farming. Tribal areas have several disadvantages for agricultural develop-ment, including uneven and sterile lands, lack of irrigation facilities, and irregular and expensive transportation. Both labour and land productivity remain at a low level. Diffusion of mechanization is very slow. Under these circumstances, livestock rearing has been subordinate to mixed farming, which is clearly reflected in the dominance of cattle in livestock composition. Bullocks are fully utilized as the main source of draft power, and cows are primarily maintained to secure he-calves, resulting in a very low level of milk yield. Due to the paucity of facilities and incentives for milk production, rearing she-buffaloes is not economically viable for ST households except in a few states. Buffalo rearing prevails among the ST households of Western India only, while it lags behind in Central and Eastern India where ST
population is heavily concentrated.
Secondly, we can point out the importance of ovine, pigs and poultry in the numerical composition of livestock owned by STs. This is understood as a reflection of diversifying livestock composition within the system of mix-ed farming. Rearing these animals and poultry is supposmix-ed to contribute tremendously in stabilizing and supplementing the sources of livelihood
among ST households.
Regarding labour input, rearing livestock and poultry is basically taken care of by female members among the STs. But the work is not so inten-sive as to get into the principal usual activity status due to the small scale and self-sufficient nature of livestock rearing.
Conclusion
The STs, more rural-based than the SCs, are distributed in the areas called the tribal belt. The majority of STs are concentrated in the central tribal belt, which constitutes hilly and mountainous areas lying between the Western and Eastern Ghats. Most of these areas are specified as backward districts either by the central government or the state government. Irriga-tion is underdeveloped in these areas and market access is also limited. The influence of Green Revolution or mechanization is yet to prevail in these areas. As a result, an extensive agriculture of a self-sufficient nature still constitutes the dominant form of agricultural management. The per-centage distribution of land holding households among the ST households is not necessarily smaller than that of other social groups in the tribal belt. However, the average MPCE of ST households typed as 'self-employment in agriculture' appears lower than that of their counterpart among the other social groups because the agricultural production of ST households remains lower both in terms of land and labour productivity.
Livestock rearing among the STs is closely woven into their extensive and self-sufficient agriculture. The particular characteristic of their live-stock ownership lies in the dominance of cattle. Since the pace of mecha-nization is very slow, bullocks are still used as the main draft power, and cows are maintained mainly for reproducing he-calves. Both the green and white revolutions are yet to prevail in the central tribal belt. Accordingly, livestock composition has not yet shifted toward increasing milk produc-tion, and cows are still in the centre of milk production. Despite various
140 Journal of the Japanese Association for South Asia Studies, 16, 2004
drawbacks to livestock development, it is interesting to note that rearing she-buffaloes is becoming common among the other social groups to some extent.
Another feature of livestock ownership patterns among the STs is the diversity of species of livestock that they possess. It is common among them to rear small livestock, such as sheep, goats, pigs, and poultry. The STs are supposed to have been long associated with pig farming, which has been avoided by the caste Hindus as polluted economic activity. For any species of small livestock, the scale of rearing is generally small among the ST households. However, this economic activity can be assessed as play-ing an important role in stabilizplay-ing household income, generatplay-ing labour opportunities, and coping with risks. Notably, it is confirmed by the NSS data that those who raise small livestock are mainly female members.
Generally, the central tribal belt lags behind the plain areas in the scale of development. However, there are some exceptions. The tribal areas in Gujarat and Maharashtra are more developed, and the occupational struc-ture and livestock ownership patterns among the ST households differ greatly from those of other states. In the course of development of tribal areas, the land ownership of STs tends to become weak, and accordingly, the ratio of agricultural labourers among the STs tends to increase. Live-stock ownership patterns among the ST households also change toward having more she-buffaloes in response to the diffusion of mechanization and the introduction of White Revolution that generally accompany de-velopment.
At present, any changes in the socio-economic life of STs in Madhya Pradesh and Orissa, the top two states in terms of rural ST population, ex-ert a great influence on the overall situation of STs in the central tribal belt. The tribal areas in these two states are especially backward, and mixed farming with bullock power is still dominant. It will take consider-able time before development reaches these areas. For the time being, therefore, it is anticipated that the socio-economic gap between the STs and the other social groups may further increase.
[This article is a revised version of my paper 'Livestock Ownership Pat-terns among the Scheduled Tribes in Rural India', in Tsuguo Nakasato (ed.), A Study on Dominant Factors in a Recent Transformation of Live-stock Keeping in India, A Project Report sponsored by the Ministry of
Education and Science, Japan, Fukuoka: Fukuoka University of Education, March 2004, pp. 5-22.]
Notes
1) The term 'Scheduled Tribes' is mainly used for administrative purposes to des-ignate tribal people residing in the hilly and mountainous areas. The STs have been one of the beneficiary groups in the reservation system as prescribed in the Constitution of India (1950) . The population share of STs in India is 8 percent (2001). Various names have been used to refer to them. Nowadays, many of them prefer to call themselves 'adivasi' (indigenous inhabitants). 2) The term 'Scheduled Castes' is also used for administrative purposes to
desig-nate people who have historically been discrimidesig-nated as 'untouchables'. They also constitute a beneficiary group in the reservation system. SCs constitute 14 percent of the population in India (2001). They have been referred to in various ways. Currently, some of them prefer to call themselves 'dalits' (those who have been oppressed).
3) The Integrated Rural Development Program is a centrally sponsored scheme in operation since 1980. It aims at the alleviation of poverty among small and marginal farmers, agricultural labourers and rural artisans living below the poverty line through acquisition of productive assets or appropriate skills which would generate additional income on a sustained basis.
4) The term 'tribal areas' is synonymous with the term 'Scheduled Areas', which has been defined in the Indian Constitution as "such areas as the President may by order declare to be Scheduled Areas". The criteria followed for declaring an area a Scheduled Area are preponderance of tribal population; compactness and reasonable size of the area; under-developed nature of the area; and marked disparity in economic standard of the people. These criteria are not spelt out in the Constitution of India but have become well established. 5) The term 'other social groups' is applied to designate social groups other than
STs and SCs. Besides caste Hindus, it includes various religious groups. Since it contains various politically and economically powerful groups, 'other social groups' generally indicate better socio-economic status than the STs and SCs. 6) In India there are two regions where STs are concentrated: 1) the central part
covering vast areas between the Western and Eastern Ghats, and 2) the North-east region along the North-eastern Himalayas. The former region is called 'the cen-tral tribal belt' in the relevant NSS reports. The vast majority of ST popula-tion in India is concentrated in the central tribal belt.
7) National Sample Survey was started in 1950 to collect various socio-economic data on a regular basis useful for making socio-economic programs and poli-cies.
8) Data on monthly per capita expenditure is frequently taken in the series of NSS survey to trace the long-term trend of poverty, which is one of the most im-portant issues for the government.
142 Journal of the Japanese Association for South Asia Studies, 16, 2004
for understanding the changing dynamics of nature-society interaction in the contexts of rural development (particularly of the poor) and environmental deg-radation. The pioneer, N. S. Jodha, argues that both the areas and utilization of CPRs have drastically declined during the 1950s and the 1980s in the villages he surveyed. He sees this as a result of conflict between ecological and en-vironmental imperatives and development interventions (Jodha 2001: 224). Jodha further argues that the ecological imperatives (supporting CPRs) and sustenance of the rural poor are important factors which should not be ignored unless substitute options to CPRs that meet the two concerns are evolved. Many other studies, stimulated by Jodha's work, have been conducted on the arid, semi-arid or hilly zones, and have given conclusions similar to Jodha's, though there are wide variations in the definition of CPRs. In these studies, livestock rearing is presumed to function as a key link among these components.
10) We have some supporting evidence regarding the possession of tractors and working animals by the operational holding size classes (OHSCs). These are relevant to the possession of tractors and working animals by the landholding size classes since the lease of land has not much prevailed among the medium and large landholding size classes. According to the NSS survey on livestock and agricultural implements the number of bovine for work purpose per 100 ha of operated areas has declined from 65 to 59 between 1971 and 1991 in rural India. The number declined in all the OHSCs, but the rate of decrease was more among the large and medium OHSCs. For example, the number declined from 21 to 5 among the large OHSC, and from 41 to 18 among the medium OHSC during the period (Government of India 1997: 33). This was a direct result of diffusion of tractors among these classes. The number of tractors, which was 0.07 million in 1971, increased to 0.45 million in 1981, and jumped to 1.36 million in 1991. The ownership of tractors prevailed rapidly among the large and medium OHSCs. The distribution of tractors per 10,000 ha of operated areas by OHSC has increased from 7 to 154 among the medium OHSC, and from 12 to 147 among the large OHSC between 1971 and 1991 (ibid.). 11) In the NSS survey, households are classified into five types according to the
principal source of household income. Those households with land holdings are not classified into 'self-employment in agriculture', if it is not their principal source of household income. On the other hand, those households grouped into `self-employment in agriculture' may accommodate any family workers who are not self-employed in agriculture and engaged in other economic activities, (and) if the principal source of household income is 'self-employment in agriculture'. 12) In the NSS surveys, the land holding classes are divided into several size
classes as follows: 'landless' (less than 0.002ha), 'semi-landless' (0.002-0.21ha), `marginal' (0.002-1.01 ha) , 'small' (1.01-2.01 ha) , 'semi-middle' (2.01-4.01 ha) , `middle' (4
.01-10.01ha), and 'large' (10.01 ha and above). This division is the same for the operational land holding.
preceding 365 days prior to the date of survey is considered the principal usual status of the person. It is broadly divided into 'working' (a person who was engaged in any one or more work-activities), 'unemployed' (a person who was not working but was either seeking or was available for work) and 'not working' (a person who was engaged in any one or more of the non-gainful activities including attending educational institutions, domestic duties only or with free collection of goods, sewing etc., and a person who did (could) not work due to sickness or disability). (Government of India 1994: 7)
14) The NSS defines this as the activity pursued by persons for pay, profit or fami-ly gain, which adds value to the national product. However,the activities of
'agriculture'
(including rearing livestock and poultry), of which a part or the whole of agricultural production is used for self consumption and does not go for sale, are also considered 'gainful'. (Government of India 1994: 6)
15) This status includes both 'working' and 'not working' persons. The detailed activity category is determined according to the major time criterion during the reference period of seven days preceding the date of survey. (NSS 1988: 7)
REFERENCES
Government of India, 1994, "Survey of Life and Economy of STs in India", Sarvek-shana 17 (4), Delhi, pp. 1-80, S1-S367.
Government of India, 1995, "Some Aspects of Household Ownership Holdings", Sar-vekshana 19 (2), Delhi, pp. 43-308.
Government of India, 1997, "Livestock and Agricultural Implements in Household Operational Holdings, 19992", NSS 48th Round Report No. 408, Delhi, pp. 1-37, A1-A163.
Government of India, 1998, "Ownership of Livestock, Cultivation of Selected Crops and Consumption Levels", NSS 50th Round Report No. 424, Delhi, pp. 1-22, A1-A55.
Jodha, N. S., 2001, Life on the Edge: Sustaining Agriculture and Community Resources in Fragile Environments. New Delhi: Oxford University Press.
Pandey, U. K., 1995, "The Livestock Economy of India: A Profile", Indian Journal of Agricultural Economics 50 (3), pp. 264-282.
Rao, C. H. Hanumantha, 1994, Agricultural Growth, Rural Poverty and Environmen-tal Degradation in India. New Delhi: Oxford University Press.
Shinoda, Takashi, 2003, "Livestock Ownership Patterns and the Poor Section in Ru-ral India", A Paper submitted to the "International Workshop on Population, Economy and the Environment in India", Osaka, December 5,2003.
Subrahmanyam, S. and R. N. Rao, 1995, "Bovine Sector in Agriculturally Prosperous and Backward Regions: A Comparative Study", Indian Journal of Agricultural Economics, 50(3) , pp. 311-316.