和歌山県白浜番所崎におけるウニ類相とその変化,2000 年と 2011 年
Distribution of Sea Urchins (Echinodermata: Echinoidea) around Cape Bansho,
Wakayama, Japan, in 2000 and 2011
大垣俊一
1), †・石田 惣
2),*・小林孝行
3)・長行司大也
2)1)〒646–0032 和歌山県田辺市下屋敷町 129–1
2)京都大学大学院理学研究科動物生態学研究室.〒606–8502 京都市左京区北白川追分町
3)スポーツエデュケイションアカデミーS. E. A. 学園ダイビング学科.〒169–0075 東京都新宿区高田馬場 4–40–17
Shun-ichi OHGAKI
1), †, So ISHIDA
2),*, Takayuki KOBAYASHI
3)and Daiya CHOGYOJI
4)1) 129–1 Shimoyashiki, Tanabe, Wakayama 646–0032, Japan
2) Laboratory of Animal Ecology, Graduate School of Science, Kyoto University. Kitashirakawa, Sakyo-ku, Kyoto 606–8502,
Ja-pan
3) Diving Course, Sports Educational Academy S. E. A. Gakuen. Takadanobaba 4–40–17, Shinjuku-ku, Tokyo 169–0075, Japan
Abstract: The distribution of sea urchins (Echinodermata, Echinoidea), and changes therein over the course of a decade, were investigated around Cape Bansho, which marks the southern limit of Tanabe Bay, Japan (33°42′N, 135°20′E). Cen-suses were carried out once each in 2000 and 2011, using a semi-quantitative timed search technique on both occasions. Fourteen species of sea urchin were recorded in the two survey years, of which 64% were tropical Indo-Pacific species.
Echinostrephus aciculatus, Anthocidaris crassispina, and Stomopneustes variolaris were more abundant in the intertidal than
subtidal zone. In contrast, Echinometra sp. A, Toxopneustes pileolus, and Diadema setosum were more abundant in the sub-tidal zone than intersub-tidally. The densities of Echinometra mathaei, Echinometra oblonga, and Stomopneustes variolaris were higher on more exposed shores whereas those of Echinometra sp. A and Mespilia globulus were higher on more sheltered shores. The present results concerning Echinometra species and wave exposure are consistent with previous reports from Okinawa. From 2000 to 2011 there was a contraction in the ranges of Mespilia globulus, Diadema setosum, and
Stomopneus-tes variolaris, all of which are tropical species, but the range of the warm-temperate species Anthocidaris crassispina
re-mained constant. Environmental and biological evidence around Tanabe Bay suggests that climatic events such as a severe winter and typhoons were responsible for the decline of the three tropical species between 2000 and 2011.
Key Words: horizontal distribution, inter-decadals change, sea urchins, severe winter, tropical species, wave exposure
は じ め に
世界におけるウニ類の,数 ha∼数 km2 規模の分布とそ
の変化をめぐっては,アイルランドの海跡湖で
Paracen-trotus lividus 個体群を長年にわたり追跡した研究 (Kitching
1987; Barnes et al. 2002) や,日本の沖縄のサンゴ礁でナガ ウニ類 Echinometra spp. の水平分布について調べた報告 (Tsuchiya & Nishihira 1984) がある.しかしウニ類全般を 対象に,特定地域内で分布の種間,年度間の比較を行った 例はないようである.著者らは紀伊半島西南部の岩礁で, ほぼ十年の間隔を置いて出現したウニ類の分布を調べた. 今回の調査地では,岩礁小区域内のウニ類の分布と各種の 付着力,食性 (Yamanishi & Tanaka 1971) や,穴居性との
関連における,主要種の活動性 (Yusa & Yamamoto 1994) が調べられている.著者らはこれらの報告も参照しつつ, 今回の調査をもとに各年度における水平分布と年度間の変 化,およびその要因について検討した.その結果について 報告する.
調査地点・方法
調査は和歌山県白浜町,田辺湾の湾口部南側に位置する 番所崎 (33°42′N, 135°20′E) で行った (Fig. 1).調査範囲を 含む番所崎先端部は,鮮新世ないし更新世に堆積した塔島 礫岩層(満塩ら 1998)から成り,地層が比較的新しいこ とから浸食されやすく,随所に波蝕棚(プラットフォー ム)が発達する.波当りはその先端部で強く,それらに挟 まれた入江内で弱い.調査域の地質基盤の均質性と,潮通 しのよい岬先端の狭い範囲内のため,水質や温度条件に域 内地点差を想定しにくい環境は,生物の分布に対する波浪 の影響を検討することを容易にしている.Benthology
Received 12 December 2011 Accepted 6 February 2012
† Deceased 8 May 2012
* Corresponding author
調査方法は,半定量時間限定法(大垣 2011)による. 番所崎の海岸を,地形によって互いに隣接する 44 区に分 割し,2000 年は 8 月の大潮干潮時(8 月 2∼4 日)に 3 日 間,2011 年は 6,7 月の大潮干潮時(6 月 2 日∼7 月 2 日) に10 日間,野外調査を行なった.各調査区の海岸線延長 は約 30 m で,面積は必ずしも等しくない.2000 年は 3 人 (石田,小林,長行司)で 1 区画を各 10 分,2011 年は 1 人(大垣)で 1 区画を 30 分観察し,人数×時間の調査努 力量をそろえるよう配慮した.出現したウニ類(棘皮動物 門,ウニ綱)はすべて,種名と密度を記録した.密度評価 は,区画内で 1 個体のみ見られた場合をⅠとし,それ以外 は1 m2当たりの最大密度として,1–9 個体は II,10–99 個 体はⅢ,100 個体以上をⅣとした.1 m×1 m の範囲は概 ね目視によって決定したが,密度が階級境界付近などで評 価に迷う場合は,携行した 1 m 長の棒を補助的に用いた。 2000 年にはスキューバとシュノーケリングにより潮下帯 も調査した.地形等から任意に設定した 11 区内の海底を, 1 区画あたり 2 人(石田,小林)で 30 分間観察し,出現 したウニ類の種と密度を,潮間帯と同じ基準で記録した. 長期的な調査においては,調査者の入れ替わりによる調 査努力量や種同定基準の年度間差がしばしば問題になる. 今回の場合,各年度それぞれ予備調査を行って,調査への 習熟と種同定の正確を図ると共に,発見の容易な表在性の 種を主な調査対象とし,転石下など,努力量の影響を受け やすい生息場所の種は評価から除いた.ただし,隠蔽種の 存在が指摘されているナガウニ類(平塚・上原 2009)に ついては,年度間で評価の差を生じた.2000 年にはツマ ジロナガウニEchinometra sp. A とそれ以外のナガウニ種群 Echinometra spp. という区分で記録し,2011 年には 2000 年 のナガウニ種群の中で,ホンナガウニ Echinometra mathaei とヒメクロナガウニEchinometra oblonga を区別している. このためナガウニ類については,この点を考慮してデータ を処理した. ウニ類分布との関連において,いくつかの環境条件を検 討した.水温については京都大学瀬戸臨海実験所水族館の 開放水槽(岸から直接海水を導入)の,1996–2011 年の間 の各年の最低月平均水温を用いた.気温は同じ期間,白浜 町大浦の白浜町役場(2010 年以降は南紀白浜空港)に設 置された気象庁アメダスの記録値について,各年の最低月 平均気温を用いた.台風については,気象庁のホームペー ジ (http://www.data.jma.go.jp/fcd/yoho/typhoon/route_map/ index.html) で進路を参照し,調査地の 200 km 以内に接近 した台風の数を,調査前年までの 5 年間遡って数えた.こ のほか,各区の地形的開放度ないし波浪強度について,2 通りの計算を行った (Burrows et al. 2008; 大垣 2009; Ohgaki 2011).1 つは吹送距離 (fetch) であり,各区中央から 22.5° 間隔に 16 の方位線を引き,そのうち海面に向かって開放 されている方位線の対岸までの距離を,すべての方位につ いて合計した.ある方位線の距離が 200 km を越える場合, 理論上さらに吹送距離が伸びても波高は大きくならないと されるため,200 km として計算した.もう一つは開放度 指標 (Exposure Index, EI) で,吹送距離に風向風速を加え たものである.これはΣ fpv2で定義され,f は fetch(吹送
距離),v は各開放線から吹いた風の,月最大風速の平均 値,p はその方位からの,計算に用いた最大風速を与えた 風向の頻度割合を示す.v については波力理論から,エネ
Fig. 1. Study site. Forty-four intertidal (1–44) and 11 subtidal (A–K) census plots were established around Cape Bansho which marks the southern limit of Tanabe Bay in Wakayama Prefecture. The solid star indicates the site at which water temperature is measured by the Seto Marine Biological Laboratory of Kyoto University. The open star shows the site at which air temperature, wind speed, and wind direction are measured by the Japan Meteorological Agency.
ルギーレベルの指標とするため 2 乗した.こうして求めた fpv2を16 方 位 に つ い て 合 計 し,Σ fpv2 を開 放 度 の 指 標 (EI) とした.風向風速は気象庁アメダスの記録から, 2000 年,2011 年を遡る 5 年間の値を用いた.水温と気象 データの観測点を Fig. 1 右図に示す.
結 果
環境条件 各調査区における,fetch(吹送距離)と EI(開放度指 標)の分布を Fig. 2 に示した.fetch は調査域北端の西側 33–39 区と,岬南端の 10–15 区で大きな値を取り,両地点 が直接外海に面することに対応する.EI は 2000, 2011 年 とも,fetch とほぼ同様の傾向を示すが,22–25 区や 33–39 区といった北西方向に開放された岩礁で,それ以外よりも 大きくなる傾向がある.これは EI が風の情報を含み,田 辺湾周辺では,年間を通じて北西風が卓越する事実(大垣 2010)を反映している. 温度条件について,1996 年から 2011 年までの年間最低 月平均水,気温は,気温 4.7–8.5℃,水温 13.6–15.8℃で推 移した (Fig. 3).水温の場合,2011 年より低い値が期間中 3 回(1996, 1997, 2005 年)記録されているのに対し,気温 は期間中の最低値であり,2011 年冬の気温が特に低かっ たことがわかる. 調査地の半径 200 km 以内に接近した台風の数は,調査 前 年 ま で 5 年間において,2000 年調査の場合,1995∼ 1999 各年順に 0, 0, 2, 3, 0 で計 5 個,2011 年調査について は,2006∼2011 各年順に 1, 2, 1, 3, 0 で計 7 個であった。 ウニ類相 両年に記録された計 14 種のリストおよび出現頻度を Table 1 に示す.2000 年には潮間帯,潮下帯合わせて 12 種,2011 年には潮間帯に 13 種がみられた.これらのう ち,2000 年のみ記録されたのはサンショウウニ属の 1 種 Temnopleurus sp., 2011 年のみはバフンウニ Hemicentrotus pulcherrimus である.各種の地理的分布をみると,3 分の 2 近く (64%) は,日本の太平洋岸での分布が房総半島以 南,広く熱帯インド西太平洋に分布し,全体に南方・熱帯 性の色濃い種相になっている.残りのほとんどは,日本の 房総以南九州までと朝鮮半島,東シナ海沿岸に分布する, いわゆる「東亜固有要素」(sensu 西村 1981)の種である. 2000 年調査時のデータをもとに,各種の潮間帯と潮下 帯の密度指数を比較したところ,6 種について有意差がみFig. 2. The degree of wave exposure at each census plot around Cape Bansho. EI (Exposure Index) classes are: I, 1–9; II, 10–99; III, 100–999; IV, >1000 km×m2/s2. For details of fetch and EI parameters, see the main text or Ohgaki (2011).
Fig. 3. Fluctuations in air temperature (AT) and water tempera-ture (WT) at Cape Bansho from 1996 to 2011. The monthly mean temperatures are shown for the month with the lowest mean value of each year (air temperature: January or February; water tempera-ture: January, February, or March).
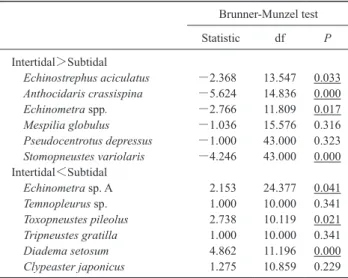
られた (Table 2).タワシウニ Echinostrephus aciculatus,ム ラサキウニAnthocidaris crassispina,クロウニ Stomopneus-tes variolaris は潮間帯に多く,ツマジロナガウニ,ラッパ
ウニToxopneustes pileolus とガンガゼ Diadema setosum は潮
下帯に多い. 開放度との関係 (Table 3) では,2000, 2011 年を通じ, fetch または EI いずれかで有意な関係を見出したのは,ツ マジロナガウニ,コシダカウニ Mespilia globulus,ホンナ ガウニ,ヒメクロナガウニ,クロウニの 5 種で,前 2 種は より遮蔽された区域,後 3 種はより開放された区域に多 かった. Table 4 に,種ごと 2000–2011 年間の分布区数の変化を 示した.両年合わせて 10 区以上出現した種の中で,コシ ダカウニ,ガンガゼ,クロウニの 3 種は,記録区数が有意 に減少していた. Fig. 4 に,両年いずれかで 10 区以上出現した種の分布 図を示した.タワシウニとムラサキウニは,2000 年に潮 下帯に全く見られない調査区があり,そのため全体として 潮間帯により多い傾向になった.ツマジロナガウニは調査 域全体に分布したが,海岸部では岩礁の奥まったところ
Table 1. A List of the sea urchin species recorded in 2000 and 2011 at Cape Bansho, showing their frequency of occurrence (i.e., number of plots) among 44 intertidal and 11 subtidal plots (latter in parentheses; n.d.=no data). GD denotes geographic distribution: the southern and north-ern limits of distribution for each geographic group are <30ºN and <35ºN for the southnorth-ern species (S), >30ºN and >35ºN for the northnorth-ern spe-cies (N), and 30º–35ºN and 30º–35ºN for the limited-range spespe-cies. The taxonomy and geographic ranges of spespe-cies are presented according to Nishimura (1995) and Imahara (2011). Plot codes are shown for rare species numbering <10 individuals in a plot (see Fig. 1 for plot locations).
Number of plots
GD Plot codes (rare species) 2000 2011 2000 2011 ECHINOIDA ホンウニ目 Echinometridae ナガウニ科 Echinostrephus aciculatus タワシウニ 43 (9) 43 S Anthocidaris crassispina ムラサキウニ 44 (8) 42 N Echinometra sp. A ツマジロナガウニ 44 (11) 43 S Echinometra spp. (E. mathaei & E. oblonga) 42 (7) 23 S Echinometra mathaei ホンナガウニ n.d. 20 S Echinometra oblonga ヒメクロナガウニ n.d. 10 S Temnopleuridae サンショウウニ科 Mespilia globulus コシダカウニ 20 (3) 2 S Temnopleurus sp. サンショウウニ属の 1 種 0 (1) 0 – K Toxopneustidae ラッパウニ科 Toxopneustes pileolus ラッパウニ 1 (5) 1 S 20, B, C, D, H, K 41 Tripneustes gratilla シラヒゲウニ 0 (1) 1 S K 20 Strongylocentrotidae オオバフンウニ科 Hemicentrotus pulcherrimus バフンウニ 0 (0) 3 L 12, 26, 42 Pseudocentrotus depressus アカウニ 1 (0) 1 L 25 22 DIADEMATOIDA ガンガゼ目 Diadematidae ガンガゼ科 Diadema setosum ガンガゼ 28 (10) 12 S ARBACIOIDA アスナロウニ目 Stomopneustidae クロウニ科 Stomopneustes variolaris クロウニ 13 (0) 5 S CLYPEASTEROIDA タコノマクラ目 Clypeasteridae タコノマクラ科 Clypeaster japonicus タコノマクラ 1 (2) 1 L 1, E, K 12
Table 2. Differences in the density of sea urchin species between the intertidal and subtidal zones around Cape Bansho in 2000. The results are shown separately for the species that had a greater aver-age density (see Fig. 4) in intertidal plots than subtidal plots (inter-tidal > sub(inter-tidal), and for species that had a greater average density in subtidal than intertidal plots (subtidal > intertidal). Significant P values are underlined.
Brunner-Munzel test Statistic df P Intertidal>Subtidal Echinostrephus aciculatus −2.368 13.547 0.033 Anthocidaris crassispina −5.624 14.836 0.000 Echinometra spp. −2.766 11.809 0.017 Mespilia globulus −1.036 15.576 0.316 Pseudocentrotus depressus −1.000 43.000 0.323 Stomopneustes variolaris −4.246 43.000 0.000 Intertidal<Subtidal Echinometra sp. A 2.153 24.377 0.041 Temnopleurus sp. 1.000 10.000 0.341 Toxopneustes pileolus 2.738 10.119 0.021 Tripneustes gratilla 1.000 10.000 0.341 Diadema setosum 4.862 11.196 0.000 Clypeaster japonicus 1.275 10.859 0.229
や,北端岩礁周辺では波浪の強い西側よりも弱い東側に多 い傾向がみられた.ホンナガウニは 2011 年に,北端西側 や岬先端南側の波当りの強い岩礁に多く,ヒメクロナガウ ニはさらに波浪の強い地点に限られていた.コシダカウニ は北端西側や岬先端南側の波浪の強い地点を避け,それ以 外の湾奥側や岩礁の奥によくみられた.ガンガゼは,潮下 帯も調査した 2000 年に,潮間帯より潮下帯で高密度で あった.クロウニは潮下帯に現れず,潮間帯では両年と も,北部や北西方向に面する波当りの強い区域に多かっ た.2000 年と 2011 年の比較では,分布図からもコシダカ ウニ,ガンガゼ,クロウニの記録区数の減少が明らかであ る. なお,両年ともに出現が 10 区未満の種については,出 現区番号・記号を Table 1 に示した.これらの評価密度は, すべての区においてⅠまたは II であった. 以上の結果をもとに,両年に出現した全種の分布の,波 当りと潮間帯/潮下帯環境との関係について Table 5 にま とめた.
議 論
今回の調査により,白浜番所崎周辺から 14 種のウニ類 が記録された.このうちサンショウウニ属の 1 種は 2000 年のみ,潮下帯からの発見である.この種はもともと稀 (2000 年の発見は 1 区のみ)であるのに加え,2011 年には 潮下帯を調査しなかったため,発見されなかったと思われ る.逆に 2011 年のみ記録された種としてバフンウニがあ る.バフンウニは主に転石下に棲み,今回の調査では転石 帯を調査対象にしていないが,2011 年にはたまたま起こ した転石の下の個体が偶発的に記録されたものである. 今回の結果から,番所崎のウニ類の分布制限要因とし て,波浪の影響が有力である.これについては直接的影響 と間接的影響が考えられる.前者は各ウニ種に固着力の差 があり,波浪の打撃に対する抵抗性が異なるとするもので ある.Yamanishi & Tanaka (1971) は今回の調査地である番 所崎のウニ類の付着力を調べ,その強さは,ムラサキウ ニ・ラッパウニ>ナガウニ(類)>タワシウニ・コシダカ ウニ・シラヒゲウニであるとした.このうちコシダカウニ については今回認められた遮蔽環境への選好性と整合する が,タワシウニは必ずしも対応しない.タワシウニはその 強い穴居性 (Yusa & Yamamoto 1994) によって付着力を補 い,開放岩礁に進出していると考えられる.後者の間接的 影響については,たとえば番所崎では入江の奥に砂が堆積 しがちであり,またプラットフォームの先端には褐藻類, 基部や入り江内に緑藻類が優占する傾向がある (Ohgaki et al. 2011).このような環境差が,ウニ類の分布に何らかの 形で反映している可能性も否定できない.したがって波浪 強度とウニ類分布との詳細な関係は,付着力に行動的適応 や間接的要素も加え,総合的に分析する必要がある. ナガウニ類については,沖縄のサンゴ礁で,種ごとの分 布特性を調べた例があり (Tsuchiya & Nishihira 1984;Nishi-Table 3. Relationship between density of sea urchin species around Cape Bansho and wave exposure. For fetch (i.e., distance over which wind has blown over water) and EI (Exposure Index) parameters, see the main text or Ohgaki (2011). Rs denotes Spearman s rank correlation coeffi-cient. Only the species that appeared in 10 plots or more in either 2000 or 2011 are examined. Significant P values are underlined. Echinometra mathaei and E. oblonga were not distinguished from each other in 2000. The number of plots with Mespilia globulus in 2011 was insufficient for statistical analysis. 2000 2011 Fetch E I Fetch E I Rs P Rs P Rs P Rs P Echinostrephus aciculatus 0.087 0.577 0.189 0.218 0.083 0.592 −0.094 0.542 Anthocidaris crassispina 0.238 0.119 0.169 0.272 0.172 0.264 0.141 0.360 Echinometra sp. A −0.142 0.359 −0.297 0.050 −0.310 0.041 −0.304 0.045 Echinometra mathaei 0.230 0.134 0.312 0.040 Echinometra oblonga 0.238 0.119 0.358 0.017 Mespilia globulus −0.390 0.009 −0.193 0.211 Diadema setosum −0.152 0.323 −0.200 0.192 0.022 0.886 0.043 0.783 Stomopneustes variolaris 0.006 0.970 0.216 0.159 0.166 0.281 0.438 0.003
Table 4. Changes in the number of plots around Cape Bansho in-habited by each sea urchin species from 2000 to 2011: − , de-crease. ±, no difference. Significant P values are underlined.
Number of plots 2000/2011 Brunner-Munzel test Statistic df P Echinostrephus aciculatus ± −0.027 85.405 0.978 Anthocidaris crassispina − −0.143 85.167 0.887 Echinometra sp. A − −1.734 83.307 0.087 Mespilia globulus − −5.179 50.479 0.000 Diadema setosum − −3.319 85.998 0.001 Stomopneustes variolaris − −2.240 72.711 0.028
Fig. 4. Distribution of sea urchin species in 2000 and 2011. Only species that occurred in 10 plots or more in either of the two years are shown. A circle represents the species density for each plot in the intertidal (solid) or subtidal (open) zone. The four circle sizes correspond to different maximum densities (no./m2) of a given species in each plot: class I (only 1 individual found in the plot), class II (maximum density of 1–9/m2),
class III (10–99/m2), and class IV (≥100/m2). Echinometra mathaei and E. oblonga are not shown for 2000, when these species were not
hira et al. 1991),ツマジロナガウニは波当りの弱い礁池内 を中心に,またホンナガウニとヒメクロナガウニは,より 波当りの強い礁縁部にまで分布することが知られている. 一方今回の結果では,ツマジロナガウニは遮蔽された海岸 に,ホンナガウニ,ヒメクロナガウニは開放性の岩礁に多 かった.従って熱帯サンゴ礁と温帯岩礁という環境の違い はありながら,これらの種の波浪に対する反応は両地域で 共通しているといえる. 2000 年と 2011 年の比較では,コシダカウニ,ガンガ ゼ,クロウニの 3 種に,有意な減少傾向がみられた.ウニ 類の長期的分布・密度の変動,特に減少の要因について は,これまで世界各地で様々な報告があり,捕食圧 (Estes
et al. 1978; Pearse & Hines 1979),病気 (Sheibling &
Stephen-son 1984; Lessios 1988),台風の波浪(清本 2011),低水温 (Barnes et al. 2002) などが挙げられている.田辺湾周辺で は,ウニ類の有力な捕食者としてモンガラカワハギ類とイ セエビ類があるが(加藤哲哉私信),それらがウニ類の特 定の種を好むとか,最近顕著な増減がみられたという情報 はなく,またイセエビ類はほとんど潮間帯で活動しない. 一方調査地周辺は京都大学瀬戸臨海実験所の地先であり, 学生実習の磯観察や潮間帯生物の研究が頻繁に行われてい る。しかし最近数十年,病気によるウニの大量死の現象は 気づかれておらず,病気による大量死の可能性は低い.台 風については,調査年の前年まで 5 年間,半径 200 km 以 内に接近した台風は 2000 年調査の場合 5,2011 年調査で は7 で,やや増加傾向にある。また調査地において波浪は 各種の分布の有力な制限要因であることが示唆されてお り,付着力の弱いコシダカウニなどについては,密度減少 に台風波浪の物理的作用が関与した可能性は排除されな い. 一方,顕著に減少した 3 種はいずれも,房総半島以南イ ンド西太平洋に分布する,南方性・熱帯性の種で,より北 方まで分布するムラサキウニには有意な変化がみられな かった.田辺湾周辺では,これまでしばしば,冬季の低温 時に南方・熱帯性の潮間帯・潮下帯種の大量死が発生して いる (Tokioka 1963; Araga & Tanase 1968; 桑村・樫山 1976). 今回の場合,2011 年の 1 月に月平均気温 4.7℃となり,こ れは気温の特に低かった 1980 年代に記録された 4.5℃ (1984 年 1 月)以来 27 年ぶりの低温であった.特に 1 月 下旬には日平均 0℃台まで下降し,この直後に著者の一人 (大垣)は,田辺湾岸でツマジロナガウニとホンナガウニ が多数死んで打ちあがっているのを観察した.同じ時期 に,田辺湾周辺ではタカラガイ類,イモガイ類など熱帯性 貝類の大量死が気づかれている(真鍋 2011).これらのこ とから,2011 年調査直前の冬季寒波により,調査地の熱 帯性ウニ類に対する選択的死亡が生じたという推定は有力 といえる. 以上の情報は,寒波や台風といった気象条件が,ウニ類 分布の年間変動に影響した可能性を示している.今後はよ り頻度を増した調査に加え,近隣地域での変化も参照しつ つ,調査地周辺のウニ類密度変動の要因を探っていく必要 があろう. 謝辞:京都大学瀬戸臨海実験所の技官の方々には,2000 年の 野外調査時,スキューバ機材の使用に当たってお世話になった. また加藤哲哉(京都大学瀬戸臨海実験所),金城その子(国立遺 伝学研究所)両氏からは田辺湾周辺のウニ類に関する情報を頂い た.2 名の匿名校閲者は,原稿に対する有意義な意見を寄せられ た.以上の方々にお礼を申し上げる.
引 用 文 献
Araga, C. and H. Tanase 1968. Further record of winter fish stranding in the vicinity of Seto. Publications of the Seto Marine Biological Laboratory, 16: 207–214.
Barnes, D. K., E. Verling, A. Crook, I. Davidson and M. O Mahoney 2002. Local population disappearance follows (20 yr after) cycle collapse in a pivotal ecological species. Marine Ecology Progress Se-ries, 226: 311–313.
Burrows, M. T., R. Harvey and L. Robb 2008. Wave exposure indices from digital coastlines and the prediction of rocky shore community structure. Marine Ecology Progress Series, 353: 1–12.
Estes J. A., N. S. Smith and J. F. Palmisano 1978. Sea otter predation and community organization in the west Aleutian Islands, Alaska. Ecology, 59: 822–833.
平塚悠治・上原 剛 2009. 美ら島のナガウニに学ぶ.本川達雄 (編),ウニ学,東海大学出版会,東京.pp. 319–338.
今原幸光(編) 2011. 写真でわかる磯の生き物図鑑.トンボ出版, 大阪,271 pp.
Kitching, J. A. 1987. Ecological studies at Lough Hyne. Advances in Ecological Research, 27: 115–186.
清本節夫 2011. 長崎県橘湾沿岸の転石海岸におけるムラサキウニ の個体群動態,特に台風が及ぼす影響について.日本ベントス 学会誌,66: 48–60.
Table 5. Summary of the distributional patterns of sea urchin species in relation to wave exposure and habitat lev-els (i.e. vertical zonation) based on the results presented in Tables 2 and 3.
Exposed Intermediate Sheltered Intertidal Stomopneustes variolaris Echinostrephus aciculatus
Anthocidaris crassispina
Intermediate Echinometra mathaei Temnopleurus sp. Mespilia globulus
Echinometra oblonga Tripneustes gratilla
Pseudocentrotus depressus
Subtidal Toxopneustes pileolus Echinometra sp. A Diadema setosum
桑村哲生・樫山嘉郎 1976. 寒波によるタカラガイ類の死亡.南紀 生物,18: 46–48. 真鍋 黌 2011. 寒波来たる.本覚寺杼貝(黒潮貝類同好会誌), 63: 9. 満塩大光・歓崎智弘・栗林知史 1998. 紀伊半島における前期更新 世の塔島層.高知大学学術研究報告(自然科学),47: 49–56. Lessios, H. A. 1988. Mass mortality of Diadema antillarum in the
Ca-ribbean: what have we learned? Annual Review of Ecology and Sys-tematics, 19: 371–393.
Nishihira, M., Y. Sato, Y. Arakaki and M. Tsuchiya 1991. Ecological distribution and habitat preference of four types of the sea urchin Echinometra mathaei on the Okinawan coral reefs. In Biology of Echinodermata, Yanagisawa I., I. Yasumasu, C. Oguro, N. Suzuki and T. Motokawa (eds.), A. A. Balkema, Rotterdam. pp. 91–104. 西村三郎 1981. 地球の海と生命.海鳴社,東京,284 pp. 西村三郎(編) 1995. 日本海岸動物図鑑 II.保育社,大阪,663 pp. 大垣俊一 2009. 開放度測定の地形法.Argonauta, 16: 25–38. 大垣俊一 2010. 浅海生物相の長期変動̶紀州田辺湾の自然史.南 紀沿岸生態研究室,田辺,136 pp. (http://www.mus-nh.city.osaka. jp/iso/argo/TanabeBay2011/TanabeBay2011.html) 大垣俊一 2011. 半定量調査法と相対値.日本ベントス学会誌, 66: 33–39.
Ohgaki, S. 2011. A regional biogeography of shore molluscs: influence of the Kuroshio current and the two capes. Zoological Science, 28:
268–275.
Ohgaki, S., K. Komemoto and N. Funayama 2011. A record of intertid-al mintertid-alacofauna of Cape Bansho, Wakayama, Japan, from 1985 to 2010. Publications of the Seto Marine Biological Laboratory, Special Publication Series, 11: 1–311.
Pearse, J. S. and A. H. Hines 1979. Expansion of a central California kelp forest following the mass mortality of sea urchins. Marine Biolo-gy, 51: 83–91.
Sheibling, R. E. and R. I. Stephenson 1984. Mass mortality of Strongy-locentrotus droebachiensis off Nova Scotia, Canada. Marine Biology, 78: 153–164.
Tokioka, T. 1963. Supposed effects of the cold weather of the winter 1962–63 upon the intertidal fauna in the vicinity of Seto. Publications of the Seto Marine Biological Laboratory, 11: 245–254.
Tsuchiya, M. and M. Nishihira 1984. Ecological distribution of two types of the sea-urchin, Echinometra mathaei (Blainville), on Oki-nawan reef flat. Galaxea, 3: 131–143.
Yamanishi, R. and A. Tanaka 1971. Contribution to the ecology of litto-ral sea urchins. I. Measurements of clinging power and observations on stability of sea urchin colonies. Publications of the Seto Marine Bi-ological Laboratory, 19: 2–15.
Yusa, Y. and T. Yamamoto 1994. Inside or outside of the pits: variable mobility in conspecific sea urchin, Anthocidaris crassispina. Publica-tions of the Seto Marine Biological Laboratory, 36: 255–266.