A hydrodynamic model for the collective motion in Ag‑Cu‑Se
journal or
publication title
Solid State Ionics
volume 179
number 21‑26
page range 761‑764
year 2008‑09‑15
URL http://hdl.handle.net/2298/9488
doi: 10.1016/j.ssi.2007.12.080
A hydrodynamic model for the collective motion in Ag-Cu-Se
Masahiro IKEDA*, Masaru ANIYA
Department of Physics, Graduate School of Science and Technology, Kumamoto University, Kumamoto 860-8555, Japan
*Corresponding author
Abstract
The interpenetrating three fluid models is presented to study the composition dependence of the sound velocity, diffusion coefficient and ionic conductivity in the liquid Ag-Cu-Se system. The model predicts that the sound velocity exhibits an extremal value at intermediate cationic composition. It is also shown that the obtained behavior of the ionic conductivity agrees qualitatively with that observed experimentally in the superionic phase.
Keywords: superionic conductor, hydrodynamic model, (AgxCu1-x)2+δSe
1. Introduction
Superionic conductors are materials which have attracted great interest from the fundamental and technological points of views. These materials are characterized by their high ionic conductivity with a value comparable to those observed in molten salts. In some kinds of superionic conductors such as Ag and Cu chalcogenides, the mobile ions Ag, Cu ions and electrons (or holes) contribute to the charge transport.
It is known that superionic conductors such as silver chalcogenides exhibit an intermediate behavior between solids and liquids. This observation has led to the concept of sublattice melting and to a model of superionic conductors such as 'crystalline cage immersed in a viscous liquid' [1]. Much studies have been done based on this hydrodynamic model [2-5].
More recently, the collective dynamics of molten salt beyond the hydrodynamic region has been studied and stressed that the generalized model of collective dynamics in many- component liquids could be used in the analysis of experimental data [6,7]. On the other hand, it has been suggested that the sublattice ordering of one of the ions occurs in the liquid phase of superionic melts [8]. Based on these properties, the interpenetrating two fluid model has been proposed to describe the superionic melt [9,10]. The model is described by two coupled Navier-Stokes equations. By using the model, it has been shown that the model reproduces quite well the composition dependence of the sound velocity and diffusion coefficient in liquid Ag2+δSe observed experimentally. The longitudinal and transverse collective modes in the same system have been also studied in detail [11].
Concerning the experimental aspect, the system Ag-Cu-Se in the solid phase has been studied extensively by Miyatani [12,13]. There, it is shown that by varying the ratio of cations Ag and Cu in (AgxCu1-x)2Se, the ionic conductivity exhibits a minimum around the composition corresponding to x=0.5. Such a behavior has been studied theoretically by Ogawa et al. by using the Multi-Component Lattice Gas Model [14]. However, concerning the liquid phase, no study is available.
In the present work, the previous hydrodynamic model is extended to treat a three- component system and it is applied to study the composition dependence of the collective modes in the system Ag-Cu-Se.
2. Model for the superionic melt
The Navier-Stokes equation for the i-th ion can be written as
) , , ( )
, ) (
, ( 3)
( ) , ( )
, ( )
,
( 2 2 F r E r 0
r V r
V r
r
V + ∇ − ∇ − + ∇∇⋅ − − =
∂
∂
i i i i i
i i i
i i
i
i M
t q M t t
t t
n c t t
ζ η
η (1)
[
( ( , ) ( , )) ( )( ( , ) ( , ))]
.) ,
( ∑3 * −1 ∫−∞
≠
− ′
′
− ′ + ′
−
= ij j i t ij j i
i
j ij
i r t M V r t V r t dtM t t V r t V r t
F γ τ (2)
The movement of each ions is described by the velocity field Vi (r,t) and the sound velocity ci. ηi is the bulk viscosity and ζi is the shear viscosity. Mi is the mass of the i-th ion, where i=1, 2 and 3 represent Se2-, Ag+ and Cu+, respectively. Mij(t) is a memory function that describes the relaxation of the restoring force in the relative motion between each ionic components. It is given by
, exp )
( * ⎟⎟
⎠
⎜⎜ ⎞
⎝
= ⎛ −
c t
ij ij
M t t
M ω τ
(3)
where ωt is the oscillator frequency and τc is the viscoelastic relaxation time. Mij* is the reduced mass between i-th and j-th ions, defined as
, ) ( )
( 1 1
*−1 − −
+
= i i j j
ij M M
M β β
(4)
where βi is the composition factor given by β1=1, β2=(2+δ)x and β3=(2+δ)(1-x). Here x and δ denote the concentration of Ag and the deviation from the stoichiometric composition, as is apparent from the chemical formula of the compound (AgxCu1-x)2+δSe. qi is the charge, γij is a numerical factor which is written as γ12=γ13=β1-1, γ21=γ23=β2-1 and γ31=γ32=β3-1. The number density fluctuations of the i-th ion, ni(r,t) is given by
) , , ) (
, (
i 0
i 0
i i N
N t t N
n −
= r
r _ (5)
where Ni(r,t) and N0i denote the number density and the mean number density of the i-th ion.
The mean number density of the cations are given by N02=(2+δ)xN0 for Ag+ and N03=(2+δ)(1- x)N0 for Cu+, where N0 is the mean number density of anions. ni(r,t) and Vi (r,t) are related each other through the continuity equation
. 0 ) , ( )
,
( +∇⋅ =
∂
∂ n t t
t i r Vi r (6) The electric field E(r,t) appearing in Eq. (1) obeys the Maxwell equation
, ) , 4 (
) , ( )
, ( )
,
( 2 2
2 2 t
c t t t
t c
t E r 2 E r J r
r
E ∂
+ ∂
∂
= ∂
⋅
∇∇
−
∇ ε∞ π
(7)
where ε∞ is the high frequency dielectric constant and c is the velocity of light. The current density J(r,t) is given by
{ 2 ( , ) (2 ) ( , ) (2 )(1 ) ( , )} ( , ) ( , ) ,
) ,
(r t =N0e− V1 rt + + xV2 rt + + −xV3 rt +∫ ∫dr′ dt′ (e) r−r′t−t′Er′t′
J δ δ σ (8)
where σ(e) is the electronic conductivity. By Fourier transforming Eq. (8), the current density is written as
. ) , ( ) , ( ) ,
(k ω σ k ω E k ω
J = (9)
By using the above set of equations, the dielectric function and the dispersion relation of the system can be derived. The detail of the derivation is given elsewhere [9-11].
3. Results and Discussion
3.1SOUND VELOCITY
The model presented in the previous section is applied to study the collective motion in liquid Ag-Cu-Se system. In this subsection, results for the composition dependence of the
sound velocity will be shown. The dispersion relation for the longitudinal collective modes is obtained by taking the irrotational part of Eq. (7),
. 0 ) , 4 (
1− =
∞ σ ω ω
ε
π k
i (10) For the electronic dielectric function, we adopt the Thomas-Fermi approximation
, 1
,0)
( 2
) (
k
k k2TF
e = +
ε (11)
where kTF is the Thomas-Fermi screening wave number. Although not shown explicitly, the dispersion relation given by Eq. (10) is a equation of 12-order in ω. The sound velocity is obtained by searching the solution with a form ω=ck. The obtained result is shown in Fig. 1.
The material parameters used in the calculation are given in Table. I. In Fig. 1 we see how the sound velocity varies with the concentration of Ag, x and with the deviation from the stoichiometric composition, δ. The effect of δ enters through the electron plasma frequency defined as
4 0 2 .
p 2
me
e N
∞
= ε δ
ω π (12)
It is interesting to note that the sound velocity exhibits a maximum value at the intermediate composition around x=0.5. This behavior implies that the system become rigid at this composition. Experimental study is suggested to check this prediction.
3.2DIFFUSION COEFFICIENT
Fig. 2 shows the calculated composition dependence of the diffusion coefficient obtained from the dispersion relation Eq. (10), by searching a solution of the form ω = -ik2D. Here we also note that the diffusion coefficient takes a minimum value around the intermediate composition of x=0.5. This finding complements our knowledge gained in a previous study.
For the case of two-component liquid Ag-Se, the composition dependence of the diffusion coefficient exhibit a maximum at the stoichiometric composition [10]. Such a behavior is in harmony with the experimental results of ionic conductivity measured in the same system and is also consistent with the predictions of the bond fluctuation model of superionic conductors [16,17]. The result shown in Fig. 2 indicates that the replacement of cation species by another cation, is unfavorable for the mass transport processes.
3.3IONIC CONDUCTIVIY
Fig. 3 shows the ionic conductivity calculated from the dispersion relation given by Eq.
(10). The results of Fig. 3 has been obtained by taking δ=0. We can see that the calculated conductivity exhibit a minimum value around x=0.5. The calculation based on the Multi- Component Lattice Gas Model gives the same behavior [11]. For the purpose of comparison, the composition dependence of the ionic conductivity measured experimentally in the solid phase [12] is shown in the inset of Fig. 3. We recognize that the conductivity changes at the composition of x=0.5.
4. Conclusions
In the present work, the interpenetrating fluid model has been extended to treat three- component systems. The model has been used to study the composition dependence of the sound velocity, diffusion coefficient and ionic conductivity in liquid (AgxCu1-x)2+δSe system.
The result of the calculation indicates that our model agrees qualitatively with the composition dependence of the ionic conductivity measured in the superionic solid phase, which exhibit a change in the behavior at the intermediate cationic composition. Our result suggests that the hydrodynamic description is a good model for treating superionic materials
which has an intermediate phase between solids and liquids. As far as the authors are informed, no experimental study of collective dynamics on these systems has been performed.
Experimental studies are necessary in order to confirm the predictions of the model.
Acknowledgements
This work was supported in part by a Grant-in-Aid for Scientific Research on Priority Area,
“Materials Science of Metallic Glasses (428)” and “Nanoionics (439)” from the Ministry of Education, Culture, Sports, Science and Technology of Japan and by a Grant-in-Aid for Scientific Research from the Japan Society for the Promotion of Science (No. 19560014).
References
[1] K.R.Subbaswamy, Solid State Commun. 19 (1976) 1157.
[2] N.Mizoguchi, H.Hidemitsu, M.Kobayashi, I.Yokota, J.Phys.Soc.Jpn. 50 (1980) 2043.
[3] F.Sukegawa, M.Kobayashi, I.Yokota, Phys.Stat.Sol. (b) 109 (1982) 717.
[4] M.Aniya, M.Kobayashi, Appl.Phys. A 49 (1989) 641.
[5] H.Hayashi, M.Kobayashi, I.Yokota, Solid State Commun. 31 (1979) 847.
[6] T.Bryk, I.Mryglod, Phys. Rev. B 71 (2005) 132202.
[7] T.Bryk, I.Mryglod, Phys. Rev. E 64 (2000) 032202.
[8] M.Aniya, H.Okazaki, M.Kobayashi, Phys.Rev.Lett. 65 (1990) 1474.
[9] M.Aniya, T.Iseki, J.Non-Cryst.Solids 312-314 (2002) 400.
[10] M.Aniya, F.Shimojo, T.Iseki, J.Non-Cryst.Solids 338-340 (2004) 579.
[11] H.Ogawa, M.Kobayashi, T.Iseki, M.Aniya, J.Phys.Soc.Jpn. 74 (2005) 2265.
[12] S.Miyatani, J.Phys.Soc.Jpn. 34 (1973) 423.
[13] S.Miyatani, J.Phys.Soc.Jpn. 46 (1979) 1825.
[14] H.Ogawa, F.Saito, M.Kobayashi, J.Phys.Soc.Jpn. 73 (2004) 3087.
[15] R.V.Gopala Rao, R.Venkatesh, Phys.Stat.Sol. (b) 187 (1995) 487.
[16] M.Aniya, Solid State Ionics 50 (1992) 125.
[17] M.Aniya, J.Phys.Soc.Jpn. 61 (1992) 4474.
Figure Captions
Fig. 1: Composition dependence of the sound velocity in liquid (AgxCu1-x)2+δSe as a function of the deviation from the stoichiometric composition, δ and concentration of Ag, x.
The vertical axis is normalized by using the sound velocity of Se, c1.
Fig. 2: Composition dependence of the normalized diffusion coefficient D(δ,x)/D(0,1) in liquid (AgxCu1-x)2+δSe.
Fig. 3: Composition dependence of the ionic conductivity in (AgxCu1-x)2Se. The solid line shows the calculated ionic conductivity. The inset shows the experimental data measured at T=493K in the solid phase [12].
Fig. 1
Fig. 2
Fig. 3
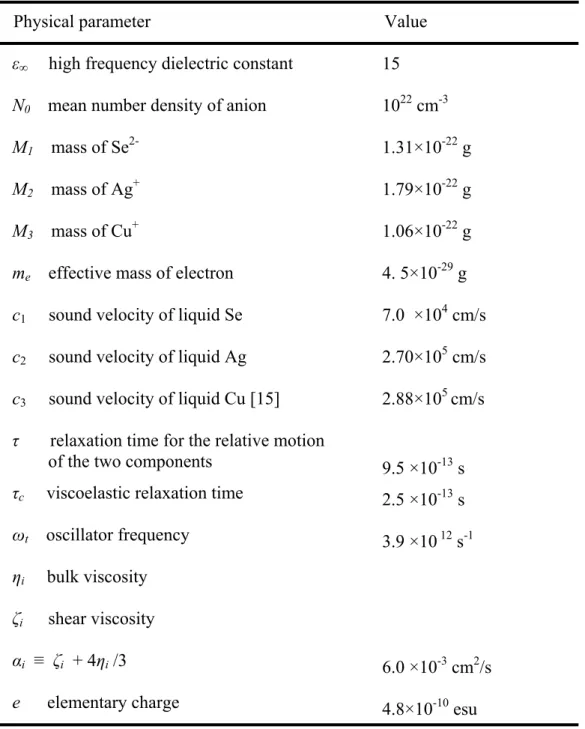
Table I. Parameters used in the calculation of (AgxCu1-x)2+δSe.
Physical parameter Value ε∞ high frequency dielectric constant N0 mean number density of anion M1 mass of Se2-
M2 mass of Ag+ M3 mass of Cu+
me effective mass of electron c1 sound velocity of liquid Se c2 sound velocity of liquid Ag
c3 sound velocity of liquid Cu [15]
15 1022 cm-3 1.31×10⁻²² g
-22 g
-22 g
-29 g
4 cm/s
5 cm/s
5 cm/s 1.79×10 1.06×10 4. 5×10 7.0 ×10 2.70×10 2.88×10 τ relaxation time for the relative motion
of the two components
τc viscoelastic relaxation time ωt oscillator frequency ηi bulk viscosity
ζi shear viscosity
αi ≡ ζi + 4ηi /3 e elementary charge
9.5 ×10⁻¹³ s
-13 s
12 s-1
-3 cm2/s
-10 esu 2.5 ×10 3.9 ×10
6.0 ×10 4.8×10