Interpretation on Stress History of Torigata Limestone Deposit Based on Rock Stresses Measured by Three Methods
S.S. Kang a, N. Nakamuraab, K. Fukuda", Y. Oikawac and Y. Obarad
a Student, Graduate School of Science and Technology, Kumamoto University b Nittetsu Mining Company, Ltd.
c National Institute for Resources and Environment, MITI
d Professor, Dept. of Civil Engineering and Architecture, Kumamoto University (Received 10 October 2000)
Abstract
In order to interpret the stress history of Torigata limestone deposit in Japan, rock stress was measured by three methods, namely the calcite strain gauge (CSG) technique, the differential strain curve analysis (DSCA) and the compact conical-ended borehole overcoring (CCBO) technique. The CSG is one of measurement methods of rock stress in the past, i.e. paleostress and others are measurement methods of rock stress at present-day.
From the measurement results, the maximum principal direction determined by the CSG and the DSCA is oriented to NW-SE, nevertheless the DSCA is a measurement method of rock stress at present-day. It is discussed that this is because of the principle of the DSCA and is because that the principal directions are determined by the orientation of the discontinuities within limestone generated in the process of stress relief of the paleostress. Then the maximum principal directions by those two methods are different from that determined by the CCBO. Putting together the results of the CSG, DSCA and CCBO, it is discussed that the state of rock in this study area is strongly affected by the crustal movement from past to present-day, especially, the movement of the Philippine Sea Plate.
1. Introduction
The limestone body at present in Japan is that a biolith-sedimentary deposit, which was composed in tropical or subtropical zone at the Carboniferous or the Permian in Paleozoic, was moved in a long term and appeared near the ground surface of Japan at present. Therefore, the limestone body was experienced the tectonic phenomena such as consolidation, metamorphism, upheaval, subsidence, erosion, movement and so on, and then the rock stress was changed with those phenomena. In the change of the process of rock stress, such discontinuities as fault, joint, fissure, crack, etc. were generated by the rock stress in the limestone body for a long period.
Limestone is only a self-sufficient resource in Japan, and limestone deposit is being developed at various districts to supply the material of cement, material of iron manufacture, gravel and so on. The bench cut method is adopted to excavate limestone in most open pit limestone mines in Japan. Recently, for the improvement of mine productivity, rock slopes are being excavated with increasing height and width. The establishment of the technologies, which are the measurement and maintenance for large rock slope, and the prediction of rock slope stability, becomes very important topics. Particularly, in the stability analysis of rock slope, the state of rock stress as the boundary condition must be estimated, as well as the mechanical property
4
of limestone rock mass. The mechanical property of limestone rock mass is correlated with the density, geometry, scale and orientation of the discontinuities within limestone deposit, and then the generation of the discontinuities is associated with the stress history of limestone deposit. Therefore, it is indispensable for the establishment of the proper prediction technology on rock slope stability to understand not only the state of the present rock stress of limestone deposit, but also the paleostress and the stress history.
In this paper, in order to interpret the stress history of Torigata limestone deposit in Japan, the stress measurements at Torigata Limestone Mine were performed by three methods, namely the calcite strain gauge (CSG) technique (Evans and Groshong, 1994), the differential strain curve analysis (DSCA) (Strickland and Ren, 1980) and the compact conical-ended
borehole overcoring technique (CCBO) (Sugawara and Obara, 1999). The CSG is one of the measurement methods of rock stress in the past, i.e. paleostress, and others are the measurement methods of rock stress at present-day. Based on the results of rock stress measured by three methods, the principal directions, their change, the relation with the movement of the Philippine Sea Plate, and the stress history of Torigata limestone deposit are discussed (Nakamura at al. 1999; Kang et al., 2000; Obara et al., 2000).
2. Outline of Torigata Limestone Mine and feature of calcite twin
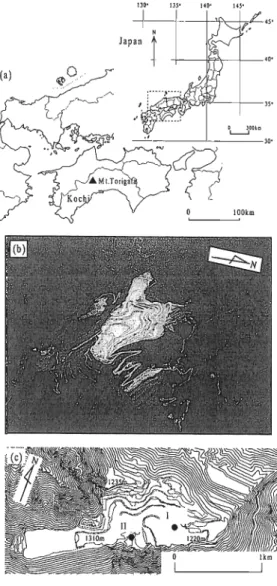
Mt. Torigata is located in the western part of Kochi Prefecture in Japan as shown in Figure 1 (a) and (b). There is Torigata Limestone deposit, which is mainly consisted of limestone. The Torigata Limestone Mine is an open pit mine located at the top of Mt. Torigata at 1459m above sea level. The excavation in the Torigata Limestone Mine was started in 1971. The excavation level is 1220-1235m at present, and the scale of the open pit is 2.5km in the east-west direction and 1.0km in the north-south direction.
The Torigata limestone belongs to the northern subbelt of the Chichibu Belt and was deposited during the Permian period. The limestone in the mine was not containing fossils or ooids, and has weakly been metamorphosed. Texture type investigated in these limestone samples was relatively closed to grainstone which has been contained less than 1 % of material with diameters less than 20^m. The petrographic microscope view of twins in limestone thin section is shown in
Figure 1 Location of the study area, Mt. Torigata. (a) Mt.
Torigata is located in Kochi prefecture in Japan, (b) a panoramic view of an open pit limestone mine, (c) samples for CSG and DSCA were obtained from sample location II; overcoring method were performed at locations I and II.
- 18-
11111
Wffl$M
111111111'
m I
I
IfflBffiSSlQlBFigure 2. The calcite crystals typically contain one or two twin sets. Most twinned grains in Torigata limestone are dominant one twin set. Most of twins investigated in the Torigata limestone are thin and thick straight twins.
The paleostress and present rock stress were measured at Torigata Limestone Mine. Calcite strain in limestone collected at 960m above sea level, from 250m depths beneath the excavation level at the location I and II, was measured by the CSG, shown in Figure 1 (c). The present rock stress was measured by the DSCA using the specimens made from the same limestone block with the CSG. The present rock stress measurement by the CCBO was also performed at the gallery that is excavated at the same level and locations as collection of samples of the CSG and DSCA.
3. Paleostress measurement by calcite strain gauge technique and discussion Figure 2 Petrographic microscope view of twins in Torigata
limestone. Samples were chosen to reflect regional
strain patterns, avoiding local deformation near faults, and to represent the broadest range of metamorphism. For precision of the measured strains, three mutually perpendicular thin sections were cut from each sample as shown in Figure 3 (after Groshong et ai, 1984b). Firstly, rectangular prisms were cut from two limestone blocks. Then, four surfaces of it are vertical and two surfaces are horizontal. From the prism, three thin sections were made as shown the shaded portion in Figure 3. All thin sections were prepared with a thickness of less than 5 fx m in order to measure twins clearly. Twins were measured on a petrographic microscope with a four-axes universal stage, and twin sets were measured in more than 25 grains in each thin section. Strain calculations were carried out by means of the CSG, and principal strain directions and magnitudes were calculated as the least square best fit based on data from the three thin sections from each prism. In this analysis, the x -axis in the global coordinate system is defined as east, the y -axis is north and z -axis is vertical.
Two coarse-grained limestone blocks, having approximately dimensions 300 X 300 X 150mm, were collected at the location II of the gallery excavated in 960m sea level as shown in Figure l(c). The thickness of the overburden was about 240-255m. According to the sampling method, eighteen thin sections were made from six rectangular prisms, which were cut from two limestone blocks. They are named Block A and Block B, respectively. Prisms cut from Block A are named A-l, A-2 and A-3, and B-l, B-2 and B-3 from Block B.
The thickness and number of twins, orientations of twins, width of grain perpendicular to twins, and orientation of c-axis were measured from eighteen thin sections using petrographic microscope with a four- axes universal stage and a micrometer ocular (Kang et al., 2000). Data were then processed and calculated by
2.5cm
3.5cm
Figure 3 Method of making three mutually perpendicular thin sections from rectangular prism, z -axis is vertical, y -axis is north, and x -axis is east. The shaded portions represent the three thin sections.
Figure 4 Principal directions plotted on the lower hemisphere stereographic projection. Closed symbols represent the results of each sample and open symbols represent avarage principal direc tions, e, is maximum principal direction, e2 and e, are intermediate and minimum principal strains, respectively.
Table 1 Results calculated by CSG. Sample location II is shown in Figure l(c). c,. e2 and e, are percent elongations for the maximum, the intermediate and the minimum elongation directions, respectively. Average strain is the square root of the second invariant of strain used here as a measure of the total distortion by twinning (after Groshong et al., 1984a), measured in percent strain. NEV represents the negative expected values after cleaning (Teufel,
1980). Positive and negative symbols represent tension and compression, respectively.
Specimen Nn
A-l A-2 A-3 B-l B-2 B-3 Average Specimen
No.
A-l A-2 A-3 B-l B-2 B-3 Average
Number of grain
81 80 81 78 77 77 79
-0.868 -0.544 -0.662 -0.738 -1.405 -1.720 -0.869
Average thickness (Mm)
0.34 0.25 0.25 0.58 0.69 0.83 0.49
Average intensity (twin/mm)
31.0 30.9 32.3 23.5 32.8 30.2 30.1
Average Strain
(%)
0.80 0.52 0.59 0.72 1.23 1.56 0.90 Principal strain (%) and direction (degree)
h
178 739°
163° /42°
160°/45°
134° /22°
120°/14°
120° /18°
130°/29°
e2
0.152 270 0.038 55°
0.185 308 0.122 265 0.506 257 0.375 1"
0.383 254
°/2°
/19°
'/39
°/57
°/71 /55°
°/45
0
o
0
0 0.716 0.505 0.478 0.661 0.900 1.345 0.485
NEV
°
4.62 6.25 12.31
0 3.23 8.06 5.74
e3
3°/50°
307°/41°
52°/16°
35°/22°
26°/12°
220°/27°
21°/31°
-20-
using the CSG computer program of Evans and Groshong (1994). Table 1 shows the results of the CSG. In the table, the magnitudes and directions of principal strains show as well as the number of measured grains, average thickness, intensity of twins and average tensor shear strain. The three specimens from Block B in Table 1 have larger strain magnitudes than those of the three specimens from Block A, but in absolute terms differences in strain are small.
Principal directions of each sample and those averages are plotted on the lower hemisphere stereographic projection in Figure 4. The strains e ,, e2, and e3 represent the maximum, intermediate and minimum principal strains, respectively. As shown in Table 1, the principal strains e2 and e3 are both positives consistently, therefore, the principal strain et is consistently odd signed (negative, whereas both other axes are positive), and has the best constrained orientation. Also, the consistent odd stress axis probably has the most direct control a shear/slip planes during deformation (cf. Krantz, 1988; Ferrill et al., 1999). e, directions have SSE-NNW trends (160-178°) and steep inclinations (57-59°) in the samples A-l to A-3. The directions of e, have SE-NW trends (120-134°) and shallow inclinations (14-22°) in B-l through B-3. The average directions for e,, e2, and e3 are 130729°, 254745°, and 21731°, respectively.
In addition, the relationships among twin strain, twin width and twin intensity obtained from calcite twins in naturally deformed coarse-grained limestone have been used as metamorphic indicators (Ferrill, 1991).
According to Ferrill's result, mean twin widths (pim) and mean twin intensities (twins/mm) generally increased with twin strains. When the mean twin width and the mean twin intensity vs twin strain calculated in this study are plotted with those data reported by Ferrill, the data from this study plot closely with twins developed at low temperature. Consequently, the calcite twins in this study area are to have developed at relatively low temperatures of <200°C.
4. Rock stress measurement by differential strain curve analysis and discussion
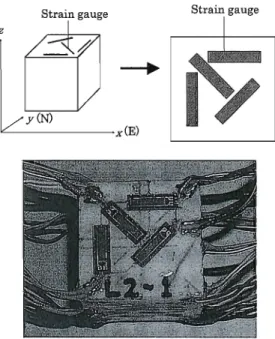
Two cubic samples of approximately 40mm side length were cut from Block B. Four strain gauges, of 10mm length, were attached to each of the six surfaces of the sample with epoxy in Figure 5.
Each sample was then sealed with epoxy sealant.
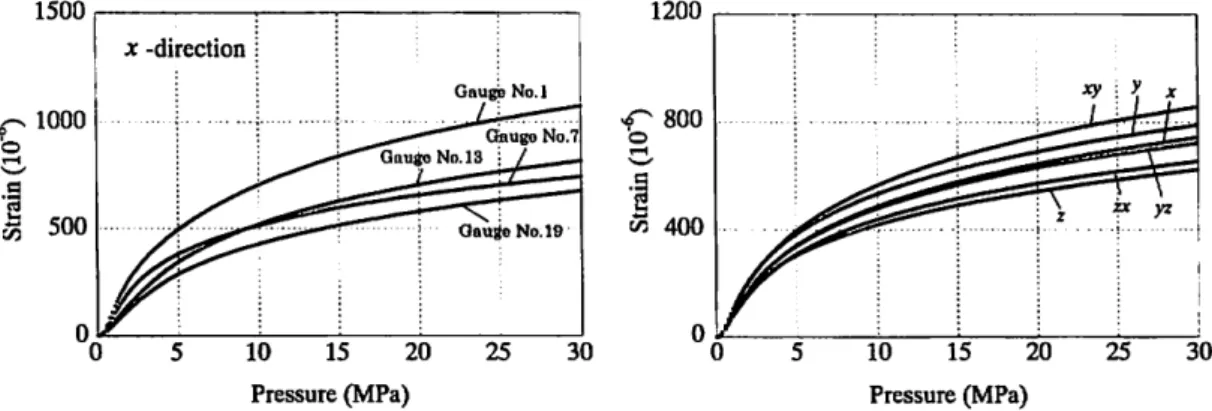
Each sample was hydrostatically compressed in a pressure vessel. The amount of pressure was increased to 50MPa at a rate of 0.025MPa/sec by a servo-controlled system. Both pressure and strain were measured at 0.1 MPa intervals. An example of strain-pressure curves in the direction of the x - axis (east) defined in the global coordinate system is shown in Figure 6. Each strain converges to a straight line with increasing the hydraulic pressure.
Thus, the strain-pressure curves in a sample are obtained as 24 components, then six strain- pressure curves in the global coordinate system are calculated applying the least square method as shown in Figure 7.
Although two methods, namely compliance
Strain gauge
§g§g|
1 '.:;■■■
P
1
i
If
I ■ it
M 1
:■;.■
■ ■
1 iP
si
Figure 5 Arrangement of strain coordinate system and sample for DSCA.
gauges and global photograph of sealed
method (Strickland & Ren, 1980) and gap method (Dey & Brown, 1986), have been proposed for DSCA, the results obtained from the two methods were found to be similar in each other (Oikawa et al., 1993).
Therefore, we used only one method, i.e. compliance method, in our analysis. Table 2 shows the differential strain component, the principal strain and the principal stress ratio. The principal stress ratio is calculated by Poisson's ratio of 0.2 which obtained from the results of uniaxial compressive test.
The magnitudes of strains obtained from the two samples are very similar. Average principal stresses
1500 1200
10 15 20
Pressure (MPa)
10 15 20
Pressure (MPa)
25 30
Figure 6 Example of strain-pressure curves in the direction Figure 7 Strain-pressure curves calculated by the least of x -axis in the global coordinate system. square method using 24 strain components.
Differential strain Component
(lO"6)
Principal
strain (10"6)
and direction (degree)
Principal stress ratio
Eix
ea
Vy*
Yn Y*y
El
63
O\IO\
No.l 7.65 5.36 7.31 0.30 -0.97 -1.17 8.82 112°/34°
6.64 297756°
4.87 204°/3°
1.00 0.86 0.71
Compliance method No.2
6.84 7.64 5.92 0.06 0.20 -0.51 7.90 154°/1°
6.66 243°/14°
5.86 72°/70°
1.00 0.92 0.84
Average 7.25 6.50 6.62 0.18 -0.38 -0.84 7.93 123°/48°
6.51 327°/72°
5.93 210°/2°
1.00 0.90 0.85
Table 2 Results calculated by the DSCA. eu, em cs, em ea, e., represent the magnitudes of each strain component, respectively. The jc-axis in the global co-ordinates is defined as east, the .V-axis is north and the z-axis is vertical.
e i, e 2 and c s represent the maximum,the intermediate and the minimum principal strains, a i, a i and a}
represent the maximum, the intermediate and the minimum principal stress ratios. Positive and negative symbols represent compression and tension, respectively.
- 22 -
normalized to ay are; <r, / ay =1.0, <r2/ <*i =0.90 and rr,/ ff, =0.85 as shown in Table 2. Assuming that the magnitude of vertical stress is overburden pressure corresponding to 250m, the magnitudes of average principal stresses are <7,=7.3MPa,
<y2=6.6MPa and <x3 =6.2MPa.
The principal directions are plotted on the lower hemisphere stenographic projection in Figure 8.
The direction of the maximum principal stress is 123°/18°, the intermediate is 327°/72°, and the minimum is 210°/2l>. From those results, the maximum principal direction is nearly horizontal from NW-SE.
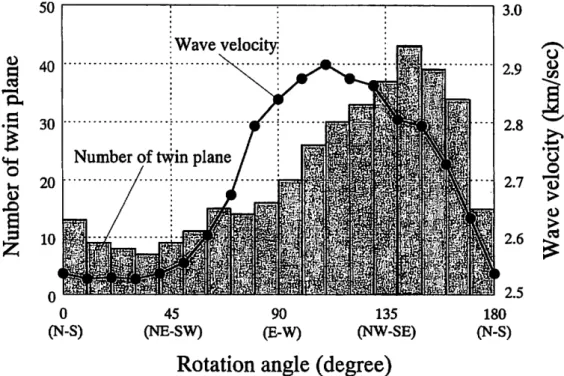
In addition, sonic wave velocity in rock is sensitive to the existence of crack and its orientation. Wave velocity in the direction perpendicular to the crack tends to propagate slowly when an open crack exists in rock mass. In order to observe the distribution of open cracks, the wave velocity method of the conventional pulse-transit technique is used (ISRM suggested methods, 1978). A cylindrical core specimen which 49.5mm in diameter and 23.4mm long was
50
Figure 8 Principal directions plotted on the lower hemisphere stereographic projection by DSCA.
Closed symbols represent the results of each sample and open symbols are average results.
Numbers represent sample number. eu e^and e3 represent the maximum, the intermediate and the minimum principal strains.
3.0
; Wave velocity j «.
L .>v. . ..: m> • li>f
Number of twin plane / i :¥ i i ffl
a
1 1
Mb 1
m
B
Ma^^^f'"1
0 0 (N-S)
2.5 45
(NE-SW)
90 (E-W)
135 (NW-SE)
180 (N-S)
Rotation angle (degree)
Figure 9 Distribution of number of twin planes and wave velocity with rotation angle.
ground flat at both the ends perpendicular to the axis. The surface of core was grounded out in order to remain a good condition. The distribution of wave velocity is shown as the closed circles in Figure 9. The wave velocity is measured by conical typed PZT, using the disk sample drilled normal to horizontal plane from Block B. The wave velocity was measured every 10 degrees to the clockwise from north. The results of wave velocity provide information about direction of cracks developed in samples. The wave velocity is distributed with the fastest oriented in the range of 100° to 130". According to those results, it is estimated that the strike of cracks developed in Torigata Limestone are mainly oriented to NW-SE, identical to the orientation of the maximum principal direction of the paleostress determined by the CSG.
In the DSCA, microcracks in a sample are assumed to be induced due to stress relief from great depth.
However, since samples in this research were collected from shallow depth, it is considered that the microcracks may not be produced during collecting samples and that the result of the DSCA is reflected pre existing cracks not microcracks induced due to stress relief during collecting sample. Therefore, it is considered that the maximum principal direction of rock stress estimated by the DSCA is in good agreement with that by the CSG. Consequently, it is concluded that this is because of the principle of the DSCA and is because that the principal directions are determined by the orientation of the pre-existing cracks in limestone generated in the process of the stress relief of the paleostress. This means that the DSCA is not appropriate for measuring present-day rock stress at shallow depth.
5. Rock stress measurement by compact conical-ended borehole technique and discussion
The rock stress measurements by the CCBO (Sugawara & Obara, 1999) were performed in two boreholes (locations I and II in Figure l(c)) for the measurement in the gallery excavated at 960m above sea level (Nakamura et al., 1999). The borehole No. I at the location I is drilled within limestone and borehole No.2 at the location II is within crystalline limestone. The thickness of the overburden is about 240-255m. Therefore, the overburden pressure is estimated to be 6.3 to 6.7MPa where the unit weight of rock is assumed to be
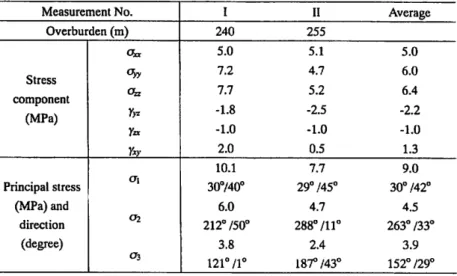
Table 3 Results of the state of stress measured by CCBO. a xx, ay>, <i ~, <r,.., <t;>, <t.,, represent the magnitudes of each strain component, respectively. <r,, <r: and us represent maximum, the intermediate and the minimum principal stress ratios. The x-axis is east, the 7-axis is north and the r-axis is vertical. Positive and negative represent compression and tension, respectively.
Measurement No.
Overburden (m)
Stress component
(MPa)
Principal stress (MPa) and
direction (degree)
Oxx
°yy Ozz Yyz Yzx Yxy
Ot
o%
I 240
5.0 7.2 7.7 -1.8 -1.0 2.0 10.1 30740°
6.0 212° /50°
3.8 121°/1°
II 255 5.1 4.7 5.2 -2.5 -1.0 0.5 7.7 29°/45°
4.7 288°/11°
2.4 187°/43°
Average
5.0 6.0 6.4 -2.2 -1.0 1.3 9.0 30°/42°
4.5 263°/33°
3.9 152°/29°
- 24 -
26.2kN/m\
The measurement results are summarized in Table 3. The results for each borehole and those average values are described in the table, and the principal directions are plotted on the lower hemisphere stereographic projection shown in Figure 10. Three measurements were performed in borehole No.l and five in borehole No.2. Since the results from these measurements are similar, the average values for each borehole are presented in the table. Young's modulus and
Poisson's ratio are 63GPa and 0.28 in borehole No.l and 50GPa and 0.28 in borehole No.2, respectively. These were determined from the conventional multiple-stage uniaxial compressive experiment (Sugawara and Obara, 1999).
The vertical stress component aa at location I is larger than the estimated overburden pressure, while that at location II is smaller than the estimated overburden pressure. This means that the rock near location II is crystalline limestone and that Young's modulus is smaller than that at location I. However, the average value at location 1 and II is in reasonable agreement with the estimated overburden pressure.
The horizontal normal stress components °«
and <yv are relatively large and 80 to 90 % of the
Figure 10 Principal directions plotted on the lower hemisphere stereographic projection by DSCA in location I and II. a,, <t: and <tj represent the maximum, the intermediate and the minimum principal stresses. Closed and gray symbols represent the result of each location, and open symbols are average.
value of (Ja . Since the rock mass near location II consists of crystalline limestone, the state of stress is considered to become hydrostatic. However, it is clear that large horizontal stress exists in the mountain.
The maximum principal direction of both results
is 30 degrees from north to east with a 40- 45 degree inclination. It is considered that the maximum principal direction is dominant because the directions from both results coincide. The intermediate and the minimum principal directions exist in a plane, although the directions of these results are different.
The principal magnitudes and directions are plotted in the horizontal and the vertical cross sections shown in Figure 11. The location of the cross sections is shown in plan view. Here, the maximum principal directions are oriented NE-SW and are in agreement with the orientation of the mountain ridge at N60W.
Near the surface of the mountain, the maximum principal stress generally exists along the ground surface and the minimum principal stress is normal (Goodman, 1980). According to the vertical sections, however, the maximum principal direction of No.2 is oriented normal to the free surface in this field. Moreover, the
maximum principal direction at location I where is at the centre of the mountain is steep. Therefore, it is
concluded that the state of stress in this field is influenced by the regional stress due to tectonic activities.6. Interpretation of stress history of Torigata limestone deposit
The principal directions obtained by the CSG, DSCA and CCBO are plotted on the lower hemisphere
stereographic projection in Figure 12. Maximum principal directions by means of the first two methods are
almost the same, i.e. NW-SE. However, the maximum principal direction by the CCBO is different from that
by the first two methods. It is considered that the result by the CCBO represents the state of rock stress at present-day. It is indicated that the maximum principal stress is oriented to 30742", the intermediate oriented to 263733° and the minimum oriented to 152729°, namely the maximum principal direction is oriented to NE-
b b1
Figure 11 The principal magnitudes and directions plotted on the horizontal and vertical planes of N-S and E-W.
Figure 12 Comparison of principal directions obtained by CSG, DSCA and overcoring method. Open symbols represent the result of CSG; gray symbols represent the result of DSCA; closed symbols represent the result of overcoring method. Circle symbols are the maximum principal direction; rectangular symbols are the intermediate principal direction; triangular symbols are the minimum principal direction.
Figure 13 Principal directions determined by the fracture system on the gallery wall excavated in Mitaki igneous body (Hada, 1972). Closed circle represents the maximum principal direction, closed rectangle represents the represents the intermediate principal direction, and closed triangle the represents minimum principal direction.
-26-
SW.
The Mitaki igneous body is distributed in south of Mt. Torigata. The limestone of Mt. Torigata was composed in the Permian period and the Mitaki igneous body in the Devonian period. Hada (1972) indicated that large bodies of the Cretaceous formation were caught by the Mitaki igneous rocks. There are galleries in the Mitaki igneous body to carry excavated limestone by belt from Torigata mine to Suzaki port. Hada also investigated the distribution of fracture system on the gallery wall and reported the direction of the principal stresses determined from conjugate fractures system. He utilized the theory that the faults develop in conjugate pairs (Hirayama et al., 1965). This theory is the same as that suggested by Anderson (1951), namely that two sets of faults in conjugate orientations with the acute angle between the two fault orientations bisected by the maximum principal compressive stress, the obtuse angle bisected by the minimum principal compressive stress, and the intersection parallel to the intermediate principal compressive stress. Hada concluded that the fracture system was developed by strike-slip tectonic movement during the late Mesozoic to the Paleogene, and that the directions as shown in Figure 13 are changed after strike-slip tectonic movement, namely the direction of ax to that of <r3, the direction of <% to that of <r, and the direction of ah to that of a-i. A stress field before the tectonic movement characterized by the maximum direction of NW-SE. These results are in harmony with those of the CSG, distribution of twin plane and wave velocity.
Consequently, it is concluded that the calcite twins in the sample used in the experiment were probably produced during the late Mesozoic to the Paleogene, and then the principal directions determined by the CSG indicate the stress state at that time. On the other hand, the stress field after the tectonic movement is similar to the result of the CCBO.
Putting together the results of three methods, it is considered that the maximum principal direction of the rock stress at the study area has been changed from NW-SE to NE-SW. Analyzing the discontinuities developing near the study area (Hada, 1972), the change of the rock stress on Torigata limestone deposit was caused by tectonic movement during the late Mesozoic to the Paleogene. The change of the maximum principal direction during that time was from NW-SE to NE-SW. Most calcite twins observed in Torigata limestone deposit may be created at that time. Therefore, it is concluded that the maximum principal direction estimated by the strike distribution of the discontinuities developing near the study area is in close agreement with that of the CSG and DSCA. After the tectonic movement, it is considered that the deformed limestone body had been uplifted to its present location due to the movement of the Philippine Sea Plate.
Although the Philippine Sea Plate is continuing to move, there is little change for the maximum principal direction after the tectonic movement, because of the coincidence of the maximum principal direction by analyzing discontinuities with that by the CCBO. Consequently, it is considered that the changes in rock stress after tectonic movement are small and that its state has been maintained from the past to present. It is concluded that the state of rock stress on the study area may be experienced two kinds of rock state at least through past time to present-day.
7. Conclusions
In order to interpret the stress history of Torigata limestone deposit, the stress measurements at Torigata Limestone Mine were performed by three methods, namely the calcite strain gauge (CSG) technique, the differential strain curve analyses (DSCA) and the compact conical-ended borehole overcoring technique (CCBO).
The maximum principal direction measured by the CSG was oriented to NW-SE. This direction is in agreement with that obtained by the DSCA. It is concluded that this is because of the principle of the DSCA
and is because that the principal directions are determined by the orientation of the discontinuities within limestone generated in the process of stress relief of the paleostress. It is noted that the DSCA is inappropriate for measuring present-day rock stress at shallow depth.
The maximum principal direction by the CSG and DSCA is different from that by the CCBO. The change of the rock stress of Torigata limestone deposit was caused by tectonic movement during the late Mesozoic to the Paleogene comparing the results by analysing discontinuities near the study area. It is concluded that the stress history of Torigata limestone deposit is strongly affected by the crustal movement of the Philippine Sea Plate.
References
[1] Anderson, E.M., 1951. The dynamics of faulting. Oliver and Boyd, London.
[2] Dey, T.N., Brown, D.W., 1986, Stress measurements in a deep granitic rock mass using hydraulic fracturing and differential strain curve analysis. Proc. Int. Symp. on Rock Stress and Rock Stress Measurements, Stockholm, 351-357.
[3] Evans, M.A., Groshong, R.H. Jr., 1994, Microcomputer techniques and applications : a computer program for the calcite strain gauge technique. J Struc. Geol., 16, 277-281.
[4] Ferrill, D.A., 1991, Calcite twin widths and intensities as metamorphic indicators in natural low- temperature deformation of limestone. J. Struc. Geol., 13, 667-675.
(5] Ferrill, D.A., et al., 1999, Stressed rock strains groundwater at Yucca Mountain. Nevada, GSA Today, 9, 5, 1-8.
[6] Goodman, R.E., 1980, Introduction to rock mechanics, John Wiley & Sons. Chapter 4.
[7] Groshong, R.H. Jr., Pfinffer O.A., Pringle, L.R., 1984a, Strain partitioning in the Helvetic thrust belt of eastern Switzerland from the leading edge the internal zone. J. Struc. Geol. 6. 5-18.
[8] Groshong, R.H. Jr., Teufel, L.W., Gasteiger, C, 1984b, Precision and accuracy of the calcite strain gage technique. Geol. Soc. Amer. Bull., 95, 357-363.
[9] Hada, S., 1972, Fracture system developed in the Mitaki igneous rocks of Mt. Torigata, Kochi prefecture, Japan - A study of reactivation of the Mitaki igneous body HI - Research Reports of The Kochi University, 21, 4:63-85.
[10] Hirayama, J., Kakimi, T, 1965, An analytical method for determination of tectonic stress-field and its application. J. Earth Science, 78, 23-31. In Japanese
[11] ISRM suggested methods, 1978, Suggested methods for determining sound velocity. Int. J. Rock Mech. Min. Sci. & Geomech. Abstr., 15, 53-58.
[12] Kang, S.-S., Nakamura, N., Obara, Y., Sugawara, K., 2000, Rock stress interpretations from Mt.
Torigata (Japan) based on calcite strain gauge and differential strain curve analysis, Int. J. Engineering Geology, 58, 35-52.
[13] Krantz, R.W., 1988, Multiple fault sets and three-dimensional strain : theory and application. J. Struc.
Geol. 10, 225-237.
[14] Nakamura, N., Ohkubo, R., Obara, Y., Kang, S.-S., Sugawara, K., Kaneko, K., 1999, Rock stress measurement for limestone open pit mine. Proc. 5th International Symposium on Field Measurements in Geomechanics, FMG-99, Singapore, 375-380.
[15] Obara, Y, Nakamura, N., Kang, S.-S., Kaneko, K., 2000, Measurement of local stress and estimation of regional stress based on the measurement to assess the stability of rock slope at open pit mine. Int.
J. Rock Mech. Min. Sci. & Geomech. Abstr. to be appeared.
[16] Oikawa. Y, Matsunaga, I., Yamaguchi, T., 1993, Differential strain curve analysis to estimate the stress
- 28 -
state of the Hijiori hot dry rock field, Japan. Int. J. Rock Mech. Min. Sci. & Geomech. Abstr., 30, 1023- 1026.
[17] Strickland, F.D., Ren, N.K., 1980, Use of differential strain curve analysis in predicting the in-situ stress state for deep wells. Proc. of 21S| US Symp. on Rock Mech., Rolla, 523-532.
[18] Sugawara, K., Obara, Y., 1999, Suggested method for in-situ stress measurement using the compact conical-ended borehole overcoring (CCBO) technique. Int. J. Rock Mech. Min. Sci. & Geomech.
Abstr., 36, 307-322.
[19] Teufel, L.W., 1980, Strain analysis of experimental superposed deformation using calcite twin lamellae. Tectonophysics, 65, 291-309.