Improvements of Data Quality of the LHD Thomson Scattering System in High-Temperature Region
Yamada, I., Narihara, K., Funaba, H., Hayashi, H., Kohmoto, T.
In the Large Helical Device (LHD) low electron density (ne), high electron temperature (Te) experiments, Te more than 15 keV has been observed by the LHD YAG Thomson scattering diagnostics.1) Since the LHS Thomson scattering system has been optimized for the temperature region, 50 eV<Te <10 keV, data quality tends to be worse in higher Te region exceeding 10 keV. In order to accurately determine Te in the high-Te experiments, we tried to increase laser pulse energy. In addition, another two signal accumulation methods were also tested.
For improvements of the data quality of the Thomson scattering diagnostics in low-ne plasma experiments, increasing laser pulse energy is one of the useful techniques.2, 3) In the 13th LHD experiment campaign, we tried simultaneous firing of up to three lasers to improve Te data quality in low-ne, high-Te ECRH plasma experiments. Figure 1 shows an example of raw signal waveform detected by a wavelength channel in a polychromator, and gate pulse applied to analog-to-digital converter. A comparison of Te profiles obtained by 1 laser and 3 lasers is shown in Fig.2. The electron densities were
~0.3x10¹⁹ m-3 in the both discharges. As shown in the left figure, Te errors are large in the temperature range above
~10 keV whereas those are small below ~8 keV. By using three lasers, Te error bars have been successfully decreased by 50 % around the plasma center. When two lasers are used, Te error bars are decreased by 45 %. Degree of improvement of data quality is more significant around the plasma center, Te >10 keV.
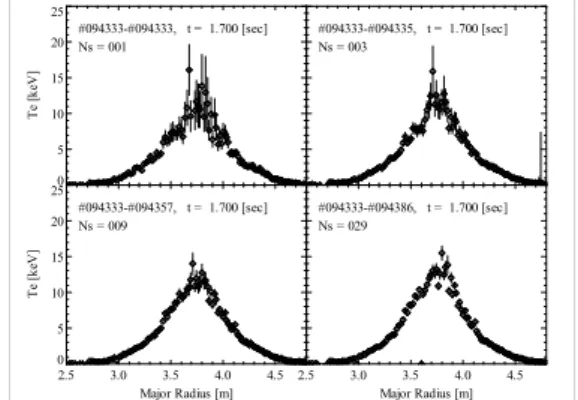
Next, we tried the raw data accumulation method on fixed plasma discharges to decrease statistical uncertainties.
Total 29 fixed plasma discharges were carried out. The line
electron densities were ~0.3x10¹⁹ m-2, and the reproducibility was within +10%. In this case, each Te profile was measured with 1 laser pulse. Figure 3 shows Te
profiles obtained by raw data accumulation of fixed 1, 3, 9, and 29 plasma discharges. Relative errors around the plasma center, �Te(0)/Te(0), are 26 %, 15 %, 8.8 %, and 5.5 %, respectively. The other data accumulation method was also tested. In this method, raw signals in a few time frames within a stationary temporal period are summed up.
By using this method, data quality has been improved by 54 % and 39 % when 3 and 5 temporal frames are added, respectively.
Figure 4 shows the summary of degree of improvement of Te data quality. Horizontal axis stands for the number of laser pulses or accumulated raw data, and vertical axis shows the uncertainty of Te(0) normalized to unity at n=1. The results in the simultaneous laser firing mode are plotted as crosses. A series of diamonds and triangles are obtained by the shot accumulation method and the frame accumulation method, respectively. Solid curve showsn-1/2. Roughly speaking, normalized Te errors in the three different methods show similar behavior, as n-1/2. This suggests that the Te data quality is mainly determined by the statistical uncertainty in low-ne, high-Te plasma experiments.
1) Takahashi, H. et al., IAEA 2010, Korea, (2010).
2) Yamada, I. et al., Rev. Sci. Instrum., 72, 1126 (2001).
3) Yamada, I. et al., Annual Rep. NIFS, 2000-2001, 149, (2001).
Fig.1. Thomson scattered signal from three laser pulses (lower waveform). Upper waveform is the ADC gate pulse.
#094407
2.5 3.0 3.5 4.0 4.5 Major Radius [m]
0 5 10 15 20
Te [keV]
t = 1.534 [s]
1 Laser
#094409
2.5 3.0 3.5 4.0 4.5 Major Radius [m]
0 5 10 15 20
Te [keV]
t = 1.500 [s]
3 Lasers
Fig.2. Te profiles measured by single laser pulse and three laser pulses
0 5 10 15 20 25
Te [keV]
#094333-#094333, t = 1.700 [sec]
Ns = 001
#094333-#094335, t = 1.700 [sec]
Ns = 003
2.5 3.0 3.5 4.0 4.5
Major Radius [m]
0 5 10 15 20 25
Te [keV]
#094333-#094357, t = 1.700 [sec]
Ns = 009
2.5 3.0 3.5 4.0 4.5
Major Radius [m]
#094333-#094386, t = 1.700 [sec]
Ns = 029
Fig.3. Comparison of Te profiles obtained by raw data accumulation of 1, 3, 9 and 29 fixed plasma discharges.
Normalized Te error
0 20
Number of added shots, n 0.0
0.2 0.4 0.6 0.8 1.0 1.2
Normalized Te error
Fixed shots, #94333-#94386 1/sqrt n
Laser simulataneous firing Frame add, #94333
Fig.4 Normalized experimental error of Te as a function of the number of laser pulses or accumulated plasma shots.
150
§1. Improvements of Data Quality of the LHD Thomson Scattering System in High-Temperature Region
Yamada, I., Narihara, K., Funaba, H., Hayashi, H., Kohmoto, T.