Keynes, Kalecki and the Japanese Economy
Toshihiro KANAO
Key words
Keynes, Kalecki, Japanese Economy, effective demand, liquidity preference, principle of increasing risk Abstract
The economic theories of Keynes and Kalecki continue to make significant contributions to contemporary analysis of modern capitalist economy. As the principle of effective demand plays a central role in their respective economics, this paper will examine the structure of the principle of effective demand of Keynes and Kalecki and foundational supports. Further, investment, finance, and funding for investment in short term-and long term- contexts will be discussed. Finally, where orthodox economics has failed to provide solutions to Japan's contemporary depression, a Keynes-Kalecki framework has the potential to elucidate this economic quagmire.
Ⅰ
Introduction
The Japanese Economy has been experiencing a long-period depression since the collapse of the Bubble economy. Considerable controversy exists over the major cause of the depression. A number of fiscal-financial policy measures and structural reforms have been proposed some of which have been implemented. However, to date no fruitful outcomes have been observed and I would argue this is due to the fact these reforms are based on orthodox economics. Orthodox economics focuses on supply side over a long period, and neglects demand side. This paper takes the position that demand side is just as important as supply side over a long period. This is post Keynesian, though Kalecki takes a further standpoint that even a long period situation is "but a slowly changing component of a chain of short period situations; it has no independent entity" (1968, p.165). Therefore, as an alternative, I will review Keynes's and Kalecki's achievements from a contemporary standpoint.
Keynes's and Kalecki's work is not only of great interest to historians of economic thought, but also provides important insights into modern economies. The validity of their economics to analysis of the Japanese economy will be examined.
This paper is divided into three parts. Section 2 will look at the principle of effective demand (referred as effective demand theory below), which is the theoretical core of the contribution of Keynes and Kalecki. Section 3 deals with investment, and the problem of financing and funding for that investment, while section 4 analyzes Japan's depression in connection with the wage hike hypothesis and outlines some possible policy responses.
Ⅱ
Keynes, Kalecki and effective demand
It is generally recognized that Keynes and Kalecki developed simultaneously and independently
their theories of effective demand. Although Keynes made great efforts to refute orthodox economics based on Say's Law, he could not deny Say's law by effective demand theory alone1). Keynes argued that an essential theoretical support to effective demand theory is liquidity preference theory. On the other hand, it was not necessary for Kalecki to deny Say's law, as he considered that the reserve army of the unemployed is built into the capitalist economies and is the logical consequence of capital movement. In other words, capital demands moderate unemployment in order to capture stable profits through controlling the working class.
Kalecki utilized a more holistic approach to support his position. Within the analysis, the degree of monopoly, while influencing enterprise's pricing decision in the microanalysis, functions as the distribution factor in the macroanalysis and determines the division of aggregate gross income between gross profits and workers' incomes. Aggregate gross income is dependent on the distribution factor in microanalysis while aggregate profits are determined by capitalists' consumption and investment as a whole. This clarifies the different roles of capitalists and workers as classes in aggregate production. The central thesis is that the capitalist class as a whole determines aggregate consumption, investment and profits, dependent on the distribution factor, while the working class plays only a "passive role", as reflected in the maxim "workers spend what they earn". The working class only influences aggregate gross income to the extent that it affects the degree of monopoly2). This micro-macro relationship depends on the assumption that workers do not save, however, in the case where workers do save, the extent of their savings can affect profits.
Though the level of effective demand determines the volume of employment and the level of output in both Keynes and Kalecki, their views differ concerning why capitalist economies cannot secure adequate effective demand to sustain full employment. In the closed Keynesian system, the level of effective demand depends on the marginal propensity to consume and the incentive to invest, and a special emphasis is placed on the relative low level of the marginal efficiency of capital to the interest rate. Therefore, financial policies to lower the interest rate and fiscal policies to directly raise investment, are effective in both the short-and- long term.
On the other hand, Kalecki states that the effectiveness of financial policies, that is, open market operations as a method of overcoming depression "would have to be on a very large scale, and might still be slow in causing recovery" (1990, p. 403). Concerning fiscal policies, he recognizes only their short-period effectiveness to attain full employment. But to maintain it for a long-period is very difficult due to the political aspects of capitalist economies (cf. Kalecki, 1971, pp. 138-45).
According to Halevi and Kriesler (1999):
"The incompatibility of capitalism and full employment results from a more fundamental aspects of the class relationship [ ]. ...unemployment was the means by which the capitalist class asserted its control over the working class" (p.10). "... unless there was some institutional change, the system could not maintain adequate levels of employment for long periods. However, the performance of Western economies in the period from the end of the 2nd World War until the early 1970s seemed to give the lie to this latter claim. ...Subsequent developments from 1970s until today indicate that Kalecki's original insight ... was fundamentally correct, and the 'golden age' was an aberration" (p.1).
Despite the above statement, I believe that the capitalist system is a more pliable structure than they suggest, so that the incompatibility of capitalism and full employment should not be emphasized too much, especially with respect to the Japanese economy. Because full employment brings mutual benefits for both parties, the working class and the capitalist, through increased production, there are benefits from cooperation. The reason why conflicting stakeholders may behave cooperatively can be
explained by repeated game theory (Kanao, 2001, chap.11). This is particularly true in Japan as the cultural-social background ("rapport" or wa ) reinforces cooperative behavior.
Ⅲ Investment and its finance
For Keynes and Kalecki, investment creates the source of funding itself. To demonstrate this, consider a closed system without government activities, in which a new investment order occurs.
Firms within the investment industry which take that order must pay costs for purchasing materials or compensating inventories, as well as wages and profits in order to meet the production increase.
The required additional funds for the payments prior to savings come from bank borrowing as working capital. These funds are used to pay for material inventory costs, and wages and profits, in order to produce the additional materials. These process are self-replicating, the funds circulate through business deposits and create the increase of primary aggregate income deposits equal to the initial increase in investment.
As soon as the new investment order occurs, firms in consumption sector anticipate increased demand for consumption goods, /(1- ) and borrow bank loans, /(1- ) as working capital3), where c is the marginal propensity to consume. As a result, within consumption sector, aggregate income increases by /(1- ) .
Therefore, the consumption sector can repay short-term loans to the bank by proceedings derived from the investment sector, and sales to consumption sector, 2 /(1- ) .
It should be noted that newly created saving deposits, - + /(1- ) - 2 /(1- ) are equal to the increase in investment, . Therefore, firms can obtain additional investment funds to purchase increased investment goods by sourcing increased saving deposits. That is, though a part of necessary funds are captured by the firm's savings, the rest is financed by long-term bank loans, and by the issuing of bonds and shares which will be bought as a part of household saving deposits. Long-term bank loans are made possible by the rest of household saving deposits without deteriorating banks' liquidity positions. Thus, the investment sector can repay short-term bank loans.
So far, short-term interest payments for banks have been neglected. However, even when this is taken into consideration, the underlying mechanism still applies. If we assume that short-term interest payments are treated as incomes and are spent on consumption and investment, then the firms of investment sector and consumption sector which borrowed discounted amount of short-term loans from banks can pay back the amount including interests to the banks by sales of consumption-and investment goods.
What happens if part of household savings is directed into idle cash balances? In this case, bond prices will fall, interest rates will rise, and the initial investment project will shrink4). However, this liquidity constraint is more important when the marginal efficiency of investment deteriorates.
Whereas Say's law tells us that sufficient effective demand to restore full employment will be guaranteed through flexible falling interest rates even if investment incentives decrease, Keynes's liquidity preference theory denies that mechanism due to the inflexibility of the interest rate through additions to idle cash balance.
At any rate, to achieve the above process requires (1) granting short-term bank credits as working capital to firms, and (2) long-term loan and new issue of shares and bonds so that the conversion from short-term funds to long-term funds is carried out smoothly5). The liquidity preference theory, the ground on which Say's law is denied, is concerned with (2). For Kalecki, (2) is dealt with by the
principle of increasing risk. However, combining the two theories reinforces the explanatory power of a depression as shown in section 4.
Sawyer states that "there appears conflict between the principle of increasing risk" and Kalecki's working assumption on which the banks make a grant towards the demand for bank credit increases (2001, p. 495-96). Further, Sawyer makes the point that "there is clearly a conflict between the principle of increasing risk and the ready availability of loans at the prevailing rate of interest (on loans) which has been generally assumed in much of the endogenous money supply literature, especially by those of a horizontalist persuasion" ( ., p. 496). If my interpretation of the principle of increasing risk which is concerned with the long-term funds for financing investment is right, then confusion must exist between the problems of long-term finance and short-term finance in the above Sawyer's statement.
The principle of increasing risk is important in that it reflects Kalecki's perspective on the capitalist economy, as Sawyer says, though he does not clarify its reason. The author thinks that it reflects invincible barriers between the "haves" and the "have-nots", corresponding to barriers of technical discontinuity between large-scale firms and small-scale firms as in Sylos-Labini (1969).
Ⅳ Keynes, Kalecki and the depression of Japan's economy
Although the major causes of Japan's depression are controversial, most discussions have revolved around four main positions. They are (1) decreasing bank credits associated with delaying the disposal of bad loans, (2) delayed structural reform of industries, (3) real wage hike, and (4) asset deflation due to the collapse of the Bubble. Elsewhere I have argued the idea that asset deflation due to the collapse of the stock market and the real estate Bubble is the major cause of the Japanese decade long depression (Kanao 2001,chap. 12). This debate will not be revisited here, though the effects of asset deflation on aggregate effective demand will be briefly referred later.
To highlight the characteristics of Keynes/Kalecki framework with the more conventional one, in particular, the wage hike hypothesis, consider a fall in aggregate effective demands. The key argument of the wage hike hypothesis insists that wage increases have a deleterious effect on capital profits.
Relation among capital profit rate, capital share, and utilization of capacity is
where is profits, , capital stock value, , gross value added, and *, potential gross value added correspondent to maximum capacity.
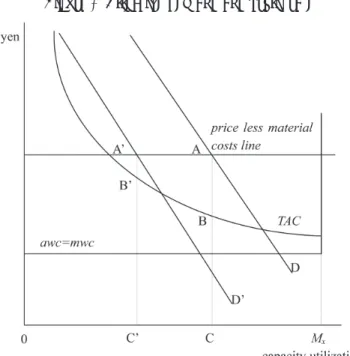
In figure 1, the lower horizontal line = up to the maximum capacity , is the average wage cost curve equal to the marginal wage cost curve, which is the marginal cost less marginal material cost curve. Kalecki assumes that the marginal wage cost and the marginal material cost are independent of output up to maximum capacity in prevailing industries, such as manufacturing industries. Existence of the constant return cost curve is of importance for Kalecki. The total average cost is obtained as an aggregation of the average wage costs and the average overhead costs (approximately equal to fixed costs).
Assume that prices are set according to the full-cost principle, and the vertical distance between the horizontal axis and the price less material costs line (called the price line below) is normalized as 1. The gross profit margin ratio is the gap between = and the price line. The wage share is
represented as the vertical distance between the horizontal axis and the marginal wage cost curve, and the profit share, as the vertical distance between the price line and curve. Assume that the aggregate demand curve (or each industry demand curve) shifts to due to decreasing effective demand. Profit share declines from to . The capital profit rate declines further, as in the above equation, by the diminishing effect of lower capacity utilization ( / *). Therefore, profit share and capital profit rate are an increasing function of capacity utilization.
In Figure 2, the late 1990s labor shares are not as large in all industries in comparison with the early 1980s, but are larger in manufacturing industries and all industries than in 1989 and 1990.
Although not shown in Figure 2, net value added labor shares of the late 1990s are larger in all industries and manufacturing, even if compared with the early 1980s. Net value added labor shares have experienced an upward tendency since 1980. Therefore, these movements of gross and net labor shares are caused by depreciation increases (included in average overhead costs) due to the relative declining effective demand to production capacities. After 1990, wage shares are stable for manufacturing industries of 30 plus employees. Those shares are between maximum 0.33 and minimum 0.31. Even if manufacturing industries of 29 or less employees are added, these figures will change only slightly, given the overwhelmingly larger weight attached to 30 plus employee industries.
This means that the average wage cost curve depicted as horizontal line in Figure 1 applies to manufacturing industries over the relevant range. It is relevant to consider whether this framework is applicable to the Japanese economy or not. This is because Kalecki's framework is applicable to the economies where manufacturing industries occupy the key position, whereas the Japanese economy has experienced drastic industrial structural changes and the importance of service industries has been increasing. However, the framework of Figure 1 can be applied even to an analysis of service sectors such as a software industry. The only modification relates to the average wage cost curve. In the software industry where variable labor costs are negligible, almost all labor costs are included in
Figure 1 Effective demand and profit rate
fixed costs which are approximately equal to overhead costs. Therefore, the Figure can be applied to software industry by making equal to 0.
We can interpret Japan's economic situation after 1990 by using the framework of Figure 16). According to this framework, the profit rate does not fall due to decreasing capital share based on real wage increases, as in the wage hike hypothesis, but is the result of decreasing capital share and capacity utilization precipitated by effective demand shrinkage. Economic recovery does not require lower real interest rates and real wage rates as suggested by the orthodox economists. Even real wage hike is compatible with both rises of profit rate and capital share in a situation where economic recovery is stimulated by effective demand policies. In Keynes's framework under diminishing returns, the recovery causes mild price increases and real wage decreases, but in Kalecki's framework, price increases need not take place, albeit the analysis is compatible with price increases.
According to Harada (2001) who insists on the wage hike hypothesis, on the one hand, the 1996-99 real wage increasing rate per hour base is 0.1% and real labor productivity growth per hour is 1.1%
(pp.114-16), while on the other hand, during the same periods, consumer prices increased by 0.66 and GDP deflator, by - 0.787). Therefore, cost increases due to the wage hike are only 0.44%. It is difficult to distinguish between the cost increases due to lower utilization of capacity and the upward shift of total average cost curve. However, it would be correct to judge cost increases largely come from lower utilization of capacity, taking into account the present overcapacity and overwhelmingly increasing cost effect that lower utilization of capacity. Thus we can conclude that the hypothesis that the Japanese depression results from the real wage hike is groundless.
Japan's aggregate effective demand shrinkage is mainly precipitated by a lower propensity to consume based on precautionary motives and lower marginal efficiency of investment (capital) relative to the interest rate, as Keynes suggests. We can easily incorporate Kalecki's principle of increasing Labor share of manufacturing and all industries are depicted by "annual statistics feature of incorporated
enterprises" in and wage share, by . Labor share is
ratio of personnel expenses to gross value added and wage share, ratio of worker's cash earnings to gross value added based on 30 plus employees.
81 82 83 84 85 86 87 88 89 90 91 92 93 94 95 96 97 98 99 2000 2001 2002
0.7 0.65
0.6 0.55
0.5
0.45
0.4
0.35 0.3
manufacturing
all industries
wage share
▲
■
■ ■
■
■
■
■
■ ■ ■
■
■
■
■
■ ■
■
■ ■
■
◆
■
■
▲ ▲
▲ ▲ ▲
▲ ▲ ▲ ▲ ▲ ▲ ▲ ▲ ▲ ▲ ▲ ▲ ▲ ▲ ▲ ▲
◆
◆
◆ ◆ ◆ ◆
◆
◆ ◆ ◆
◆
◆
◆ ◆ ◆ ◆ ◆ ◆
◆
◆ ◆
◆
Figure 2 Labor share and wage share
risk into the latter factor as Keynes (1971, pp.144-145) deals with risk problems, though they play less important role than Kalecki's principle of increasing risk does. Then implementation of investment requires that marginal efficiency of investment should cover not only the interest rate, but also marginal investment risk.
This paper takes the position that one of the major causes of the decade long depression is the increasing risk to invest caused by asset deflation, and 'risk', reflected in liquidity preference, goes to the very heart of monetary economy.
According to Kalecki: "There are two reasons for the increase of marginal risk with the amount invested. The first is the fact that the greater is the investment of an entrepreneur the more his wealth position endangered in the event of unsuccessful business. / The second ... is the danger of 'illiquidity'. ... The smaller is the own capital of an entrepreneur investing the amount κ the greater the risk he incurs" (1937, pp.442-43).
Therefore, on the one hand, the marginal risk is
= ( ) I > 0, (1)
where is the amount of investment. Call this equation the marginal risk function. In addition, this function shifts upwards when uncertainty for future prospects increases.
On the other hand, the expected value of marginal efficiency of investment μ should cover not only the long-term marginal financing cost but also the marginal risk . μ is , where is marginal efficiency of investment as random variable, ( ), enterprise's prospective probability density function of , and both of μ and are supposed to be decreasing function of . simply denotes the long-term marginal financing cost, but exactly, it may be better represented as marginal funding cost, in relation to section 3, as complex of costs by issue of shares and bond, and costs of long term loan interest rates. These costs are most likely to rise when to sell more shares and bonds, and to borrow more, because prices of shares and bonds will fall and lenders will impose higher
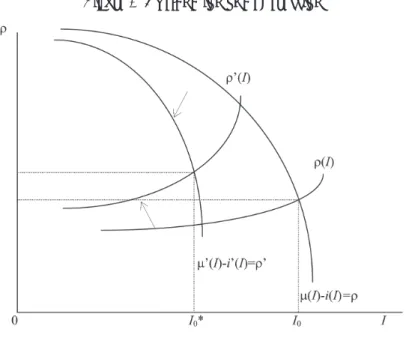
Figure 3 Explanation of a depression
interest rate on borrowers. Therefore,
μ ( - ( = μI <0 , I>0. (2)
Call the above equation the marginal risk capacity function as it shows marginal risk capacity that expected marginal net profits are able to cover.
We can obtain the marginal risk capacity function and the marginal risk function, which are charactristic macro-relations, similar to equations (1) and (2). That is, the negatively sloped marginal risk capacity function and the positively sloped marginal risk function can be obtained using the appropriate aggregation procedure (See appendix). Therefore, the Japanese economy after the collapse of the bubble in the early 1990s would be in the situation shown, as in figure 3, by the inward shift of the marginal risk capacity function and that of the marginal risk function.
Currently, the Japanese economy is in a liquidity trap in the sense that the interest rate is in the lower limit or close to the lower limit. The symbolic indication is that the yield on 10-year government bond as the representative long-term interest rate still remains very low, 1.63% as of ninth of August, even though it is up after the 0.53% in May, 2003. In addition, marginal efficiency of investment is very low so that marginal risk capacity narrows whereas the marginal risk function shifts upwards as results of increasing marginal risk through the decreasing power of disposal over assets of land and shares8), and the relative rise of debt to asset value ratio, due to asset deflation. Thus, investment activities are squeezed down as in Figure 3.
Changes of marginal efficiency of investment can be confirmed from statistical data. Certainly it is not easy task to obtain appropriate data of marginal efficiency of investment, but ratio of operating profit to total assets may be used as an approximate proxy variable when we observe change in marginal efficiency of investment. This is because ratio of operating profit to total assets is expected to move toward the same direction. When marginal efficiency of investment is higher, ratio of operating profit to total assets is most likely to be higher, and vice versa. The table shows ratios of operating profit to total assets, current returns on equity, and equity ratio in the fiscal years 1982- 2003. In the fiscal years 1993-2003 ratios of operating profit to total assets were much smaller, 1.9%-3.0%, compared with the ratios in fiscal years 1982-85 before the bubble, 4.3%-4.7%; and with the
Table Financial ratios in all industries
(%)
during fiscal year 1982 83 84 85 86 87 88 89 90 91 92
ratio of operating profit to
total assets 4.6 4.5 4.7 4.3 3.8 4.3 4.7 4.6 4.6 4.2 3.3
current return on equity 18.4 17.6 19.6 17.8 15.8 19.2 21.8 20.6 18.2 14.9 8.4
equity ratio 16.0 16.6 16.9 17.7 18.3 17.7 18.3 19.0 19.1 19.2 19.2
during fiscal year 93 94 95 96 97 98 99 2000 01 02 03
ratio of operating profit to
total assets 2.5 2.5 2.7 2.7 2.5 1.9 2.3 2.9 2.4 2.6 3.0
current return on equity 8.4 8.9 10.5 10.8 10.7 8.3 9.5 10.9 8.9 9.2 10.7
equity ratio 19.3 19.0 18.9 19.9 19.9 19.2 22.3 25.7 25.2 27.4 28.3
'Annual Statistics of Incorporated Enterprises Special Issue', in
ratios during the bubble, fiscal years 1986-1989, 3.8%-4.7%. This suggests that marginal efficiency of investment was distinctly lower during the fiscal years 1993-2003 than during the fiscal years 1982-85 and 1986-1989. Allowing for debt and interest payments, differences in profit ratios between 1982-1991and 1992-2003 fiscal years become lager. The table shows that current returns on equity between two periods highlight differences more than ratios of operating profit to total assets do. This suggests the inward shift of the marginal risk capacity function.
Next, let us confirm, from statistical data, whether the marginal risk function shifts upwards or not.
We can use the coefficient of variation of "ratio of operating profit to total assets" as the approximate proxy variable of the risk involved in investment9). Calculating the coefficient of variation of that from the table, the fiscal years 1992-2003 coefficient is much larger, 13.14%, compared with the coefficient in fiscal years 1982-1991, 6.7%. Further, equity ratio is higher in the fiscal years 1992-2003, 18.9%-28.3%
than in fiscal years 1982-1991,16.0%-19.2%. This means the fiscal years 1992-2003 have relatively larger risk bearing capital. Therefore, these facts provide the evidence that during the fiscal years 1992-2003 the marginal risk function shifts upward at least within the relevant range.
On this occasion, aggregate effective demand policies promoting a changing propensity to consume from high growth period type to low growth period type are useful for two reasons. Firstly, to directly expand aggregate effective demand through increasing aggregate consumption and secondly to raise aggregate investment through improving marginal efficiency of investment with a rising investment multiplier. One method of increasing the propensity to consume is to reduce precautionary savings by reforming social system, so as to decrease the necessity of preparation for future uncertainty. Reforms, such as simpler and clearer pension system, work-sharing, and jobs guarantee policy can contribute to this purpose10). It makes aggregate effective demands less dependent on Kaleckian external markets such as the export surpluses and budget deficit.
Unlike past practice, policies stimulating private and public investment should be different in quality and quantity, in education11). The traditional public spending still remains small multiplier and has not met social demand sufficiently. Developing capital markets which can bear risk burden and financial institutions which can estimate accurately a firm's expected profits are vitally important and can contribute to borrower's and lender's risk reduction. This is because firstly the entrepreneurs as borrowers do not have to pay dividends during a business depression, they can embark on promising businesses with less risk burden than otherwise. Secondly, the increase in ability of the financial institutions to estimate a future prospect serves to decrease unnecessary borrower's risk apprehension. Therefore, these measures would shift outward the marginal risk capacity function and the marginal risk function, which results in an outward shift of the curve in Figure 1.
While structural reform debates have been carried out, they are largely focused only on the supply side, such as productivity improvement shown as the allocation of resources from high growth sectors to low growth sectors and the creation of new industries. This focus on supply side comes from the orthodox doctrine that demand problems are only short-period and long-period problems are supply side problems. However, as Yoshikawa (2003, pp.72-100) pointed out, demand problems are also included in long period problems because products have their own life cycles and then their demand growth is bound to be stagnant in the long period. This suggests that new industries should create continuously increasing demand to sustain a certain economic growth rate. This means economic growth inevitably involves structural changes. In an addition, oligopolistic structures of industries and protection policies have prolonged the solution to shortage of effective demand problems over the long-period. More light needs to be shed on the demand side, as represented by the outward shifts of
the marginal risk capacity function through improvement of marginal efficiency of investment, in Figure 2 and curve, in Figure 1.
Ⅴ Conclusion
The central core of Keynes's and Kalecki's economics is effective demand theory, but their views differ with respect to the effectiveness of fiscal and financial policies. These differences come from their views about how the capital system works. Keynes grasped it as the system where money has a peculiar role as liquidity preference theory demonstrated. Whereas, Kalecki thought the system suffered chronically from shortages of effective demand due to institutional aspects intrinsic to the capitalist economy.
This paper refuted the wage hike hypothesis that real wage increases are the major cause of today's depression in Japanese, and elucidated the combination of both Keynes's and Kalecki's theories which shed some light on Japan's depression as well as drafting policy measures. I think a major cause of the depression is the increasing investment risk due to illiquidity as the loss of disposal power over the assets such as land and shares, which is reflected in increasing liquidity preference.
The key elements are marginal efficiency of investment (capital) relative to interest rate, propensity to consume, and the principle of increasing risk. Therefore, the efficacy of policy measures is dependent on how much they affect these elements.
Appendix
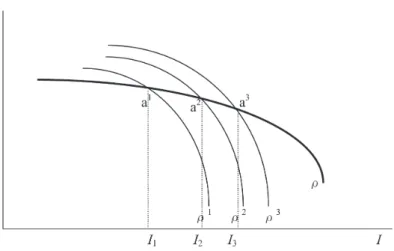
The aggregate marginal risk function and the aggregate marginal risk capacity function are not a simple aggregation of the enterprise's respective functions. Let us explain it more in detail. Fist, suppose the marginal risk capacity function of the enterprise are depicted as 1 in figure A, which corresponds to equation 2. This function is depicted, under the assumption that the other enterprise's investment is given, when the relevant enterprise increases its investment. Next, suppose each enterprise increases its investment along the 1 curve from 1 to 2. In this case, the total amount of investment increases so that the 1 curve will shift to 2 as shown in figure A, because long-period
Figure A Derivation of curve
situations such as expectation of growth rate will improve. As a result, a2 as the combination of which corresponds to 2 will be obtained. Replicating the same process produces the curve as in figure A.
There are two reasons why the curve will be negatively sloped as total investment is increased.
First, marginal efficiency of investment will diminish because the prospective yield will fall as the supply of capital is increased during any period of time (Keynes,1971, p.136). Therefore, the expected value of marginal efficiency of investment will diminish. Second, the long- term marginal financing cost or the marginal funding cost will rise as a result of incremental costs through the long- term loan interest rate costs and the issue of shares and bonds.
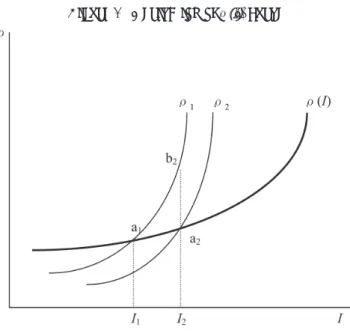
Next, let us derive ( ) curve, which reflects macro-relations, using the same procedure as in curve. Suppose the marginal risk function of the enterprise are depicted as 1 in figure B. This function is also depicted, under the assumption that the other enterprise's investment is given, when the relevant enterprise increases its investment. Then, suppose each enterprise increases its investment along the 1
curve from 1 to 2. As total investment increases and economic situations will improve, the marginal risk of the enterprise will decrease to given amount of investment. Therefore,
1 curve will shift downwards as in 2, and as a result, the new combination ( , ) will be, in figure B, point a2, not point b2. Replicating the same process produces the ( ) curve as in figure B.
The ( ) curve is most likely to be positively sloped in the relevant range, because the given enterpriser's own capital will restrict its ability to capture the required additional funds if investment increases during any period of time. The marginal risk will ultimately rise even if marginal risk is diminishing in the phase of lower investment level.
The function and the ( ) function obtained by the above process have an important property.
That is, the respective values of "elasticity of investment to marginal risk" are almost the same as those in aggregate functions. Therefore, we can safely regard them as a fraction of the aggregate, marginal risk function and marginal capacity function.
Figure B Derivation of (I) curve
*This is the revised version of the paper given at the 15th HETSA (History of Economic Thought Society of Australia) Conference, University of New England, 16-19 July 2002. I am extremely grateful to Dr Peter Kriesler of the University of New South Wales for proofreading my paper and giving me useful comments. I am grateful to Mr Greg Chaikin, Queensland University, Mr Mark Flynn, Shimonoseki City University, and anonymous referees of Hannan University for helpful suggestions. Needless to say, any errors and omissions are for the author's responsibility.
Notes
1 ) Say's law in this paper means the theory of determination of interest rate through saving-investment, refined after Alfred Marshall.
2 ) The Preface to Kriesler (2000) also points out this aspect of class roles.
3 ) This point was made clearer by Davidson (1986, pp.107-108).
4 ) Davidson (1986, pp.107-108) resolved the issues whether this is due to liquidity constraints, or saving constrains, after many controversies over Asimakopulos (1983) such as Kregel(1984-5), Asimakopulos (1986) and Kregel(1986).
5 ) See Asimakopulos (1983).
6 ) The real gross value ratio of manufacturing industries to real GDP is gradually decreasing during the periods under consideration. And wage share is larger in manufacturing industries than in non-manufacturing industries. Therefore, this means that the average wage cost curve has to be shifted downwards in considering the shrinkage period of aggregate effective demand.
7 ) The calculation formula is , where is nominal wage rate, , total labor hours, , GDP deflator, and Y is real GDP. Nominal wage increase per hour is calculated by real wage increase minus consumer price increase based on Harada's data. GDP deflator is adjusted to eliminate consumer tax changes.
8 ) Hara (2003) points up the similar remarks.
9 ) Yoshikawa shows that the risk of the Japanese economy abnormally rises, in 1990s, especially after 1995, by using coefficient of variation of GDP as the measurement of the risk (2003, pp.62-63). However, as the risk here is concerned with investment, I think the coefficient of variation of "ratio of operating profit to assets" is more appropriate.
10) For more detailed explanation of jobs guarantee policy and work-sharing, see Kanao(2004, pp.130-135).
11) Japanese educational reforms retrograde, as is reflected in vanishing debate of smaller class education and in the so-called "yutori kyouiku" or less strenuous school education. For another aspect of educational debate in quality, see Kanao (2002, p.341).
References
Asimakopulos, A. "Kalecki and Keynes on finance, investment and saving." , 1983, 7(3/4), pp.221-233.
――――― "Finance, liquidity, saving, and investment." , 1986, 9(1), pp.79-90.
Davidson, P. "Finance, funding, saving, and investment." , Fall 1986, 9(1), pp.101-110.
Halevi, J. and Kriesler, P. "On the limitations of fiscal policy: A radical Kaleckian view." The University of New South Wales, School of Economic Discussion Paper 14, 1999, pp.1-11 (in , edited by Hassan B., Edward Elgar, 2000, except for abstract).
Hara M. "'Infure Ta(-)getto Seisaku' no Mondaiten" (Problems of 'Inflation Targeting Policy'),
( ) 25, 2003.
Harada, Y. "IT wa amerika o sukutta ka"(Did IT save US economy?). , 2001, 4, pp.112-121.
Kalecki, M. "The principle of increasing risk." , 1937, 4(16), pp.440-447.
――――― Cambridge University Press, 1971.
―――――"A comment on 'Monetary policy' ", in . 1, Oxford University Press, 1990.
Kanao, T. . new ed. (in Japanese), 2001, Nihon-keizai-hyouron-sha Co.Ltd.
――――― "Book review Craig Freedman ed. ? Edward
Elger, 2001" in The , December 2002, 13 (2), pp. 340-344.
―――――"Keynes, Kalecki, and the Jobs Guarantee Policy: An analysis of the Japanese Depression and Policy
Responses"(in Japanese) in , edited by The Western
Association of Economics, Keisou Shobou, 2004.
Keynes J.M. ・ . London: Macmillan, 1971.
――――― . London:
Macmillan, 1973.
Kregel, J. A. " Constraints on output and employment: Real or Monetary?" , Winter 1984-5, 7(2), pp.139-152.
―――――"A note on finance", , Fall 1986, 9 (1), pp.91-100.
Kriesler, P. "Kalecki to gendai keizai "(Kalecki and contemporary economy) Translation of
(Cambridge University Press 1987), chapter 7 of which is replaced by "Microfoundations: A Kaleckian Perspective"
(in J. E. King ed. . Kluwer Academic Publishers, 1996) Translator T. Kanao
and H. Matuya, Nihon-keizai-hyouron-sha Co.Ltd, 2000.
Sawyer, M. "Kalecki on money and finance." , 2001 l8(4), pp.487-508.
Sylos-Labini, P. , revised ed., Harvard Univ. Press, 1969.
Wray, L. R. "Zero Unemployment and Stable Prices", , 1998, 32(2), pp.539-545.
Yoshikawa, H. (in Japanese), Iwanami-shoten, 2003.
(2004 年 10 月 12 日受付)
(2005 年 3 月 11 日掲載決定)