Introduction
Currently,the adverse effects of nutrient losses from the manure of large dairy herds are of major concern to the quality of water and ground.
Although they may be called wastes,these compo- nents are resources to be recycled. However, if these resources are in excess of the land applica-
tion capacity,they are wastes. From an environ- mental standpoint, nitrogen is the nutrient of primary concern .
In lactating dairy cows, 25 to 35 % of the nitrogen they consume is secreted into milk, and almost all the remaining nitrogen is excreted in feces and urine . Fecal nitrogen results from undigested feed, microbial protein and en- dogenous nitrogen. Urea and ammonia are the major forms of nitrogen excreted in urine. Uri- nary nitrogen is 40‑50 % of the total nitrogen excreted from dairy cows .
On the other hand, an excess of nitrogen applied to the land results in higher accumulation of nitrate in feed crops . Nitrate in the ration is usually reduced to ammonia, and is used by microbes in the rumen. However, if the nitrate content is very high, a considerable amount of nitrite is formed in the reduction process in the rumen, causing methemoglobin to form. Meth-
emoglobin does not transport oxygen to the tis- sues , and acute poisoning can kill the animal.
There may be chronic poisoning causing abortion, poor conception rate and lameness in dairy cat- tle .
The objectives of the current study were to
determine the concentrations of urea and ammo- nia nitrogen in the urine from dairy cattle, and also the nitrate concentration in the urine in an apparently healthy dairy herd. The relationship between nitrate concentration and occurrence of several disorders in the herd are also discussed.
Materials and Methods
At the Research Farm of Rakuno Gakuen University,79 dairy cows and heifers (73 Holstein and 6 Jersey) were used, including 63 milking cows, 4 dry cows and 12 heifers. The average milk yield of lactating cows at sampling day was 28.3±8.63 kg ranging from 7.0 to 42.7 kg. Days in milk ranged from 7 to 416 days. The cows were fed 4‑5 kg DM from timothy silage, 3.5 kg DM from corn silage and 5.6 kg DM from alfalfa silage. In addition, the lactating cows were fed 1.8 kg DM from beet pulp and a certain amount of concentrate mixture to fulfill energy require- ments . The average feeding level of crude protein for lactating cows was 3.15 kg daily, and about 120% of the requirement .
Urine samples were collected during urination from each cow before morning feeding at 5:30 because it was expected that urinary nitrate was hardly detectable in cows with normal ruminal reduction ability. Urinary pH was determined with a glass electrode pH meter immediately after sampling. Samples were kept at 5 ℃ for analysis within 6 hours after sampling, or at
−20 ℃ for later analysis. Urinary ammonia nitrogen was measured by steam distillation with a Kjeldahl apparatus, and ammonia plus nitrate
Concentrations of Ammonia, Urea and Nitrate Nitrogen in Urine of Dairy Cattle in the University Herd
Masahiro OKAMOTO, Mie ISHIHARA and Kenichi IZUMI (June 2001)
酪農学園大学酪農学部酪農学科
Department of Dairy Science, Faculty of Dairy Science, Rakuno Gakuen University, Ebetsu, Hokkaido, 069‑8501, Japan 酪農学園大学附属農場
Research Farm, Rakuno Gakuen University, Ebetsu, Hokkaido, 069‑8501, Japan
nitrogen was measured with Devardaʼs metal with the same apparatus. The difference between these measurements was regarded as nitrate nitrogen. In the present study, ammonia nitrogen meant ammonia plus ammonium nitro- gen. Urinary urea nitrogen was measured with a clinical kit (Urea Nitrogen-Test Wako; Wako Pure Chemical Industries) after 20-fold dilution for 43 samples.
After extraction with distilled water, nitrate and nitrite concentrations in feeds were measured by high-pressure liquid chromatography (HPLC).
Nitrate and nitrite in the drinking water were checked with a pack-test kit for water inspection
(Kyoritsu Chemical-check Lab.).
Occurrence of disorders and average days open were analyzed by chi-square test and Studentʼ s t-test, respectively.
Results and Discussion
The pH of the urine samples ranged from 8.14 to 8.63 and averaged 8.41 ±0.095. These values were somewhat higher than the normal pH of bovine urine, which is generally considered to be 7.4‑8.4 . The pH of urine may increase because of formation of ammonia from urea. However, in this study the pH was measured immediately after collection of urine. Bovine urine was also reported to have a pH value between 8.0 and 8.5 by Nakamura . The most of the present results were in this range.
The major component of nitrogenous com- pounds in urine is urea . The average concentra- tion of urea nitrogen was 5465±1606 mgL with
the range from 3148 to 10835 mgL . The histo- gram is shown in Fig.1. The mode was between 5000 and 5500 mgL . Usually,about 85 ‑90 % of total nitrogen in urea is urea nitrogen . The typical Holstein cow consuming 17.8 kg DM and producing 22.7 kg milk has been reported to excrete 22.7 kg urine with a total nitrogen concen- tration of 6 gkg . This value is equivalent to 5100‑5400 mgL urea nitrogen. More recent reports indicate that dairy cows excrete 13.0 ‑27.2 kg urine containing 5.65 ‑9.37 gkg total nitro- gen . There are considerable variation in the amount of urinary excretion of nitrogen, depend-
ing on many factors such as crude protein intake, milk production,water consumption and ambient temperature.
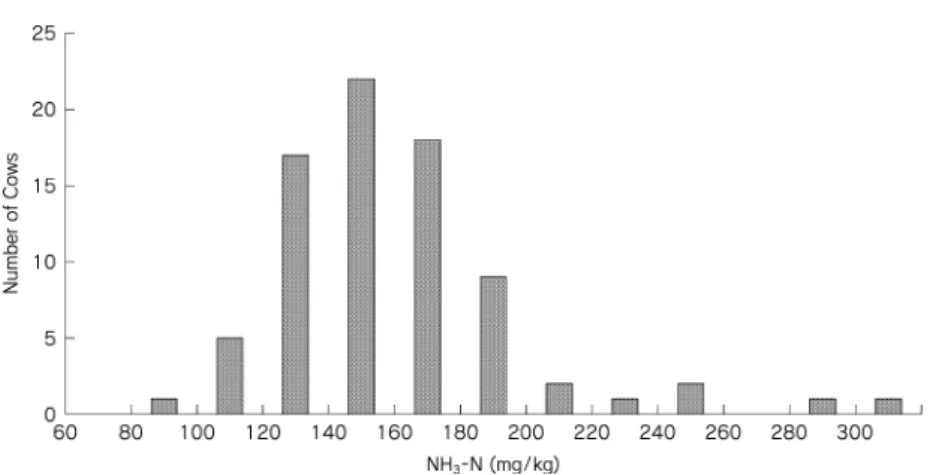
In the present study,ammonia nitrogen concen- tration was 140.8±38.0 mgkg with the range from 71 to 298 mgkg . Fig.2 illustrates the distribution of ammonia nitrogen concentration in the urine of the cows. Given that about 20 ‑40 gkg of total nitrogen in urine was ammonia nitrogen , the total nitrogen concentration (6.0 gkg would indicate that the ammonia nitrogen level is expected to be 120 ‑240 mgkg . It was considered that the present data were reasonable.
There was close positive relationship between the concentrations of urea nitrogen and ammonia nitrogen (Table 1).
In 24 cows out of 79, nitrate nitrogen was detected in urine(Fig.3). The concentration was 11.5±8.6 and between 1 and 37 mgkg . The coefficient of variation was 0.74. There were no significant correlations between nitrate nitrogen
Fig.1 Distribution of urea-nitrogen concentration in urine of dairy heifers and cows
and urine pH, urea nitrogen and ammonia nitro- gen (Table 1). The cows consumed rations containing less than 400 mgkg nitrate nitrogen in dry matter,and consumed less than 8 g nitrate nitrogen per day (4.78±2.09 gd . The nitrate content of corn silage was 210 ‑559 mgkg , and grass silage contained 31 ‑260 mgkg in dry matter. Concentrate contained less than 100 mgkg except beet pulp, which contained 219 mgkg . It is believed that rations containing less than 5000 mgkg or at least 1000 mgkg is safe . Drinking water did not contain nitrate.
The feeding level of nitrate was considered to be
normal and safe.
The correlation coefficient between nitrate consumption and urinary nitrate concentration was only 0.135. In the present study, urine sam-
ples were taken 13 hours after the last feeding.
It was considered that healthy cows with higher reduction ability of nitrate in the rumen excreted urine without nitrate at that time. Cows excret- ing urine containing nitrate might have lower reduction ability in the rumen, thus forming nitrite in the reduction process, which would cause methemoglobin to form . In such case, nitrate might be excreted in urine for a longer period.
In the various disorders encountered in the last year,no significant difference was noted between the cows excreting urine with nitrate and those excreting urine without nitrate(Table 2). Repro- ductive disorders in the cows without nitrate tended to be more prevalent than in the others.
More than half the disorders involved stillbirth.
Fig.2 Distribution of ammonia nitrogen concentration in urine of dairy heifers and cows
Fig.3 Distribution of nitrate nitrogen concentration in urine of dairy heifers and cows
Table 1 Correlation coefficient among urine pH, urea,ammonia and nitrate nitrogen in urine of dairy cows and heifers
Urea‑N NH‑N NO‑N
Urine pH 0.117 0.133 0.017
Urea‑N 0.738 −0.229
NH‑N −0.192
**:p<0.01
The cause of the stillbirth was not clear. How- ever,days open was greater in the cows in which nitrate was detected than in the other cows
(111.8±37.6 days vs. 93.7±35.0 days;p<0.05).
There might be some negative effects of meth- emoglobin formation on conception or on continu- ance of early pregnancy .
In the present study,only the concentrations of urea nitrogen, ammonia nitrogen and nitrate nitrogen in urine were measured,and no informa- tion on the amount of excretion of such nitrogenous compounds. Urine volume is affected by many factors; consequently the con- centrations of nitrogenous compounds may vary considerably. Because of shortage of informa-
tion, however, the data on the relative participa- tion of nitrogenous compounds in urine might be helpful to solve environmental problems in dairy herds, and the data on nitrate in the apparently healthy herds might be helpful to maintain cowʼ s health.
Summary
Urine samples were collected from 79 dairy cows (63 lactating, 4 dry and 12 heifers) at 13 hours after the last feeding to determine the pH value and concentrations of urea nitrogen,ammo-
nia nitrogen and nitrate nitrogen. The pH ran- ged from 8.14 to 8.63,and the average was 8.41± 0.095. Average concentrations of urea and ammonia nitrogen were 5465 ±1606 mgL and 140.8±38.0 mgkg , respectively. In 24 of the cows, nitrate nitrogen was detected, and the con-
centration was 11.5±8.6 mgkg . A close posi- tive correlation was found between the concentra- tion of urea nitrogen and that of ammonia nitro-
gen. Nitrate content of dry matter in the ration was less than 400 mgkg , and nitrate consump- tion by the cows was less than 8 g per day. This was considered to be safe level. The correlation coefficient between nitrate nitrogen consumption and the urinary concentration of nitrate was 0.135. In the frequency of disorders within the last year,no difference was observed between the cows in which nitrate was found in the urine and the other cows. However, the days open were considerably greater in the cows with nitrate detected in the urine than in the other cows (111.8 vs. 93.7;p<0.05).
References
1) Agriculture, Forestry and Fisheries Research Council Secretariat, 1999. Japanese feeding standard for dairy cattle (1999). pp.81 ‑82.
2) Kaneko, J.J., 1983. Appendix table. In Clini- cal biochemistry of domestic animals. 3rd ed.
(Japanese translated ed.). pp.881. Kindai Shuppan, Tokyo.
3) Motoi, Y., 1993. Nitrate poisoning in cattle and its prevention (in Japanese). Animal Hus-
bandry, 47:45‑51.
4) Nakamura, R., T.Yonemura and K.Sudo ed., 1973. Examination of nutritional disorders.
In Clinical Examination in Cattle(in Japanese).
pp.9‑5 and 13‑8. Nosan Gyoson Bunka kyo- kai, Tokyo.
5) National Research Council,2001. Dairy cattle nutrition and the environment. In Nutrient requirements in dairy cattle. 7th revised edi-
tion. pp.244‑248. National Academy Press, Washington, D.C.
6) Van Horn,H.H.,A.C.Wilkie,W.J.Powers and R.A.Nordstedt, 1994. Components of dairy manure management systems. J. Dairy Sci.,
77:2008‑2030.
7) Wilkerson, V.A., D.R.M ertens and D.P.
Casper, 1997. Prediction of excretion of manure and nitrogen by Holstein dairy cattle.
J. Dairy Sci., 80:3193‑3204.
要 約
酪農学園大学附属農場の乳牛群(搾乳牛 63頭,乾 乳牛4頭,育成牛 12頭)の尿を最後の飼料給与 13時 Table 2 Disorders recorded in dairy cows with and
without nitrate ditected in the urine
+NO‑N (%;n=24)
−NO‑N
(%;n=55)Significance
Reproductive disorders 8.3 21.8 NS
Metabolic disorders 20.8 20.0 NS
Mastitis 12.5 7.3 NS
Lameness 4.2 9.1 NS
Total disorders 54.2 58.2 NS
Days from calving to conception 111.8 93.7 p<0.05
*:Stillbirth was more than half of the disorders.
間後の午前5時 30分に採取し,pH値,尿素窒素,
アンモニア態窒素および硝酸態窒素濃度を測定し た。尿 のpHは 8.41±0.095で あ り,範 囲 は 8.14〜8.63で あった。尿 素 態 窒 素 濃 度 は 5,465±
1,606mgL であり,範囲は 3,148〜10,835mgL であった。ア ン モ ニ ア 態 窒 素 濃 度 は 140.8±38.0 mgkg であり,範囲は 71〜298mgkg であった。
79頭中,24頭の尿から硝酸態窒素が検出された。検 出された尿の硝酸態窒素濃度は 11.5±8.6mgkg であり,範囲は 1〜37mgkg であった。尿の尿素態 窒素濃度とアンモニア態窒素濃度との間には高い正
の相関が認められた。他の窒素成分の間には有意な 相関は認められなかった。飼料の硝酸態窒素濃度は 乾物中 400mgkg 以下であり,1日の摂取量は8g 以下と安全とされる水準であった。硝酸態窒素の摂 取量と尿の硝酸態窒素濃度の間の相関は低かった
(r=0.135)。尿中に硝酸態窒素が検出された牛と検 出されなかった牛の過去1年間の疾病率に差は認め られなかった。しかし,硝酸態窒素検出牛の空胎日 数(111.8日)は検出されなかった牛(93.7日)よ り有意に長かった(p<0.05)。