Reliability of Computer‑aided Ultrasonographic Diagnosis of Breast Masses:Receiver Operating Characteristic Study of the Effect on
ObserversʼAccuracy in Characterizing Breast Masses
Kaoru ONOUE,Yukio MIYAMOTO,Makiko NISHIOKA,Norio NAKATA,and Kunihiko FUKUDA
Department of Radiology, The Jikei University School of Medicine
ABSTRACT
Purpose:To evaluate the effect of computer‑aided diagnosis(CAD)systems on observersʼ diagnostic performance in discriminating malignant and benign breast masses on ultrasonographic images.
Methods:The subjects were 50 patients in whom ultrasonography had revealed breast masses. The masses consisted of 16 malignant and 34 benign lesions. We examined whether the differentia- tion of malignant masses from benign masses of the breast with the CAD system alone is reliable.
Receiver operating characteristic analysis was done to compare the observersʼperformance with and without CAD output. The participants wer e 3 novices and 3 experts in charge of breast ultrasonography.
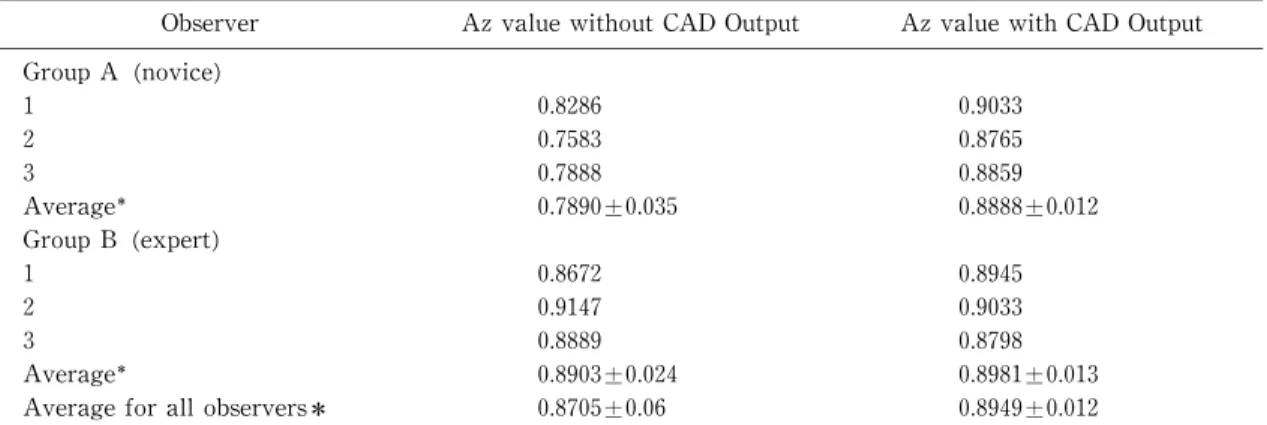
Results:The area under the best‑fit receiver operating characteristic curves(Az)of the CAD system alone was 0.8963. The mean Az values for all observers were 0.8705±0.06 and 0.8949±0.012 before and after the use,respectively,of the CAD s ystem and did not differ significantly(p=0.085).
In the novices,the mean Az values before and after the use of the CAD system were 0.7890±0.035 and 0.8888±0.012 and differed significantly(p=0. 016). In the experts,the mean Az values were 0.8903±0.024 and 0.8981±0.013 and showed no si gnificant difference(p=0.931).
Conclusion:The results of our experiments show that the use of a CAD system allows novices to diagnose breast masses as accurately as do exper ts. (Jikeikai Med J 2010;57:127‑35)
Key words:computer‑aided diagnosis,receiver operating characteristic observer study,breast masses,ultrasound,Breast Imaging‑Repor ting and Data System classification
INTRODUCTION
The number of patients with breast cancer has recently increased in Japan. The diagnostic imaging procedures used to detect br east masses include mammography, ultrasonogr aphy(US), computed tomography,and magnetic resonance imaging.
In Japan,mammography is used mostly for screening . However,thi s procedure has low diag-
nostic accuracy in high‑density breasts and in young patients,and,thus,its abi lity to detect masses is limited . Muttarak et al have reported that the mean diameter of lesions on s pecimens detectable with mammography was 3. 03±1.97 cm ;on the other hand,the mean diameter of lesions not detectable with mammography was 1.6±0. 54 cm. Muttarak et al. concluded that their ability to detect small lesions with on mammography was inadequate.
Jikeikai Med J 2010;57:127‑35
Received for publication,September 21,2010
尾上 薫,宮本 幸夫,西岡真樹子,中田 典生,福田 国彦
Mailing address:Kaoru ONOUE,Department of Radiology,The Jikei University School of Medicine,3‑25‑8 Nishi‑Shimbashi, Minato‑ku,Tokyo 105‑8461,Japan.
E‑mail:kolive23@gmail.com
127
On the other hand,the accuracy of US for diagnosing breast masses is high . This procedure facilitates the detection of breast cancers that cannot be detected with mammogr aphy . In particular, breast cancer can be detected with US alone in many patients in whom mammogr aphy has shown high‑
density breasts . Also,a study involving experimen- tal screening with US has suggested that this proce- dure increases the detection rate of cancer . However,there have been no previous studies of the screening of breast mass es with US. In Japan,a large comparative study(Japan St rategic Anti‑can- cer Randomized Trial)was started in 2007 to evaluate the usefulness of US for s creening .
However,US has limitations of its own. The diagnostic accuracy of US depends on the examinerʼs skills and is difficult to cont rol. Also,due to the low specificity of US,false‑pos itive results are more fre- quent than with mammography . Furthermore,the number of staff needed t o evaluate US images is insufficient in Japan. In gener al,sonographers in Japan undergo training in US of the breast. How- ever,if US breast screening were to be performed for all Japanese women older t han 40 years,each accred-
ited ultrasonographer(accredited by the Japan Soci- ety of Ultrasonic in Medicine)would be required to examine approximately 100 patients per day .
On the basis of this background,several recent studies have investigated t he usefulness of computer‑
aided diagnosis(CAD)for breast US . Unfortu- nately few studies have examined the quality of the observersʼperformance when breast US is used as a diagnostic tool.
In the present study,we examined the usefulness of breast US with CAD,whi ch included image assess- ment by 6 observers,in diagnosing breast masses.
METHODS
This study was approved by the institutional review board of The Ji kei University School of Medicine.
The subjects were 50 patients in whom breast US revealed breast masses from Apr il 2007 through April 2009. In all patients,pat hological diagnoses were
made at our hospital. The images for analysis were selected retrospectively by a single radiologist. The images had been obtained f rom 16 patients with malignant lesions and 34 pat ients with benign lesions.
Of the 16 patients with malignant lesions,6 had papil- lotubular carcinoma,2 had scirrhous carcinoma,4 had solid‑tubular carcinoma,2 had mucinous carcinoma,1 had invasive lobular carci noma,and 1 had ductal carcinoma in situ (DCIS). The 34 pat ients with benign lesions included 5 wi th fibroadenoma,1 with intracystic papilloma,and 28 who did not show any changes during follow‑up f or at least 2 years. These 28 lesions were anechoic and wel l‑circumscribed.
Posterior acoustic enhancement was found in all lesions on B‑mode imaging met hod. Color Doppler imaging method revealed no vas cularity. These imaging findings suggested t hat these lesions were cysts. The mean lesion di ameter was 1.46±0.85 cm (range,0.4‑3.8 cm),and the mean age of patients was 51.4 years(range,26‑89 year s).
Experiment 1 : Assessing the reliability of differ- entiating benign from malignant masses with the CAD system alone
We eval uated whether the differentiation of malignant from benign mas ses of the breast tissue with CAD system alone is r eliable. The CAD system we used was the B‑CAD s ystem (Medipattern Corp., Ontario,Canada). When establishing the extent of the lesion and proceeding t o“analysis,”the following 8 features were analyzed accor ding to the Breast Imaging‑Reporting and Dat a System (BI‑RADS) criteria on the CAD system for the classification of lesions(5 grades) :
1. Shape(oval,round,irregular) 2. Orientation(parallel,not parallel)
3. Margin(circumscribed,not circumscribed;indis- tinct,angular,microlobulated,spiculated)
4. Lesion boundary (abrupt interface,echogenic halo)
5. Echo pattern (anechoic,hyperechoic,complex, hypoechoic,isoechoic)
6. Posterior acoustic features(no posterior acoustic features,enhancement,s hadowing,combined pat- tern)
7. Surrounding tissue(duct changes,Cooperʼs liga- ment changes,edema,architectural distortion, skin thickening,skin retraction/irregularity) 8. Calcifications(macrocalcifications,microcalcifi-
cations outside of mass,microcalcifications in mass)
This system is summarized below (Fig.1).
All US examinations were performed with the LOGIQ7 US scanner(GE Heal thcare,Inc.,Japan)
with a 12‑Mhz linear probe.
The images to be analyzed were chosen from a selection of US images by an independent radiologist who otherwise did not par ticipate in the study. The lesions were classified accor ding to the BI‑RADS criteria. By comparing res ults and histopathological findings,we examined the r eliability of the CAD system as a tool to different iate benign and malignant breast masses.
Experiment 2 : An experiment involving image assessment by 6 observers
An experiment involving image assessment by 6 observers was performed wi th a 5‑grade confidence‑
rating method based on US findings of the mammary gland evaluated according t o the BI‑RADS criteria and category classification.
The observers who participated in this experi- ment consisted of those who were not routinely in charge of breast US(novi ces:2 sonographers and 1 radiology resident)and thos e who were routinely in charge of breast US(exper ts:3 sonographers accred-
ited by the Japan Society of Ultrasonics in Medicine).
The mean number of years of experience with breast US for novices and exper ts were 1.4 years
(range,0.2‑2 years)and 5.7 years(range,3‑9 years), respectively. All observers assessed the ultrasono- grams independently.
The US images were first presented without the CAD output. After each obs erver marked the initial category of confidence,the computer output for the results regarding the categor y was shown(results of Experiment 1). Then,each observer had the chance to change the previously i ndicated category level.
The observers were not informed of the patientʼs age,medical history,or his tory of pregnancy,because
CAD of Breast Masses on Ultrasonography December,2010
Fig.1. Explanation of the CAD system
US images are i nput(A). When the extent of a lesion on a selected US image of the breast lesions is outlined(B),the candi date lesions are auto- matically visualized on the CAD system. As several candidate lesions are presented,the exam- iner must select the most accurate candidate.
Simultaneously,if there are no adequate candi- dates,the examiner can manually adjust the outline on the CAD sys tem. When the lesion extent has been established,US findings are anal- yzed with the CAD system (C).
Throughout the experiment,1 radiologist selected the US image and outli ned the lesion extent for CAD analysis.
129
these are possible risk factors for malignancy.
Statistical analysis
Receiver operating characteristic(ROC)analysis was performed to compar e the observersʼperfor- mance with and without CAD output in distinguishing benign from malignant br east masses. An ROC curve was prepared on t he basis of the category chosen by the observers,empl oying the ROCKIT curve‑fitting program (LABMRMC:Char les E.
Metz,University of Chicago,Chicago,IL,USA)devel- oped by Metz et al.. The area under the best‑fit ROC curves(Az) plotted i n the unit square was calculated for each fitted cur ve. The statistical sig- nificance of the difference between the ROC curves obtained without CAD output and those obtained with CAD output was tested us ing the same computer program. The significance of the difference between the Az values was determi ned. The difference calcu-
lated was between the novices who performed assess- ments with or without the CAD system and the experts who performed as sessments with the CAD system. The difference was also calculated between the novices and the exper ts who both performed the assessments without the CAD s ystem. Evaluation of these differences was test ed using the paired t‑test. Statistical analyses were performed with a statistical software package (SPSS,ver sion 11.0;SPSS Inc., Chicago,Ill,USA).P values of less than 0.05 were considered to indicate a si gnificant difference.
We also calculated the sensitivity,specificity,and positive predictive values f or the diagnosis of breast masses determined by all obs ervers.
RESULTS
The mean size of the lesions selected for this experiment was 1.46±0.85 cm. The mean size of the 16 malignant lesions was 1. 79±0.82 cm. On the other hand,the mean size of the 34 benign lesions was 1.32±
0.85 mm.
First,we examined the database used in the experiments involving image assessment(Fig.2A,B).
Of the 34 benign lesions,18 were misdiagnosed by 1 or more novices,and 18 were mi sdiagnosed by 1 or more
experts. Of the 16 malignant lesions,13 were mis- diagnosed by 1 or more novices,and 3 were mis- diagnosed by 1 or more experts.
Experiment 1 : Assessing the reliability of differ- entiating benign from malignant masses with the CAD system alone (Table 1)
When the CAD system alone was used,the sensi- tivity,specificity,and positive predictive value were 87.5%,70.6%,and 58.3%,r espectively. For differen-
tial diagnosis by all observers,they were 74.0%,75.
5%,and 60.1%,respectively. In the novices,the sen- sitivity,specificity,and positive predictive value were 58.3%, 79.4%, and 59.7%, r espectively. In the experts,they were 89.6%,71. 6%,and 60.5%,respec- tively. When the CAD system alone was used,the Az value was 0.8963(Fig.3).
A
B
Fig.2. Number of observers who could not accurately diagnose breast masses wi thout the CAD system The graph shows the number of observers who incorrectly indicated 50 br east masses as 34 benign lesions(A)or 16 mal ignant lesions(B) without the CAD system.