実践論文
選択実験のチェックボックス位置効果検証
‐ユーグレナ食品に関する学生調査を事例として‐
The Checkbox Positioning Effect on Choice Experiments
- Evidence from a Japanese Undergraduate Survey on Food Containing Euglena -
大床 太郎*1・玉宮義之*1
Taro Ohdoko, Yoshiyuki Tamamiya
Email: [email protected]
キーワード:チェックボックス位置効果; ランダムパラメータロジットモデル; ユーグレナ
Keywords: checkbox positioning effect; a random parameter logit; Euglena
近年,極めて多くの選択実験(
choice experiment: CE
)適用事例が蓄積されている一方で,CE
におい て回答者に提示するチェックボックスの位置効果については検証されてこなかった.そこで,ユー グレナを含む仮想的なガムに対する学生選好調査において,CE
のチェックボックス位置効果を検証 した.CE
の属性として,上から順に,ガムに含有される成分(カルシウム・ビタミン・ユーグレナ), ガムを推薦している情報源(ネット・友人・トクホ),成分の含有量,14
ケ入り価格を設定し,上下 それぞれにチェックボックスを配置したサブサンプル間で推定結果に異同が生じるかを観察した.分析の結果,一番上に配置した選択セット属性のみにチェックボックス位置効果が観察され,アイ トラッカーや潜在クラスモデル,属性情報の非処理に関する質問項目設定などでさらに効果の検証 を行うべきであり,あるいはチェックボックスと価格属性の双方を選択セットの一番下に配置する ことが推奨される結果となった.
While choice experiment (CE) techniques are found in a range of contexts, the checkbox positioning effect has not been investigated, which may lead to a certain design ‘flaw’ in questionnaires. In order to test the impact of the checkbox positioning effect on CEs, we conducted a survey on a hypothetical chewing gum that includes Euglena (microalgae) using a sample of undergraduates at Dokkyo University. Our CE questions relate to the nutritional-content attributes of the chewing gum: calcium, vitamins, Euglena;
recommendations about the chewing gum from the Internet, from friends, from ‘tokuho’ labels certified by Japanese authorities; nutritional content; and the price of the gum, vertically fixed in this order into the choice set. We then separate our sample of undergraduates into those provided with checkboxes above and below the CE questions. We find that there is certain checkbox positioning effect on only the top attribute of CE questions. This suggests that there is a need for further research on the reason for the effect using eye trackers, latent class models, or stated ignorance by respondents to examine the relationship between checkbox positioning and the ignoring of attributes. Alternatively, we should set the checkboxes below the choice sets along with the bottom-placed price attribute.
―――――――――
*1:
獨協大学情報学研究所: Information Science Research Institute at Dokkyo University
1. Introduction
In order to elicit preferences in many contexts, including marketing, transportation, the environment, resources, and health economics, choice modeling (CM) techniques, as a stated preference approach, have been frequently utilized, while the revealed preference method has also been employed (Louviere et al. 2000). The revealed preference method, which includes the hedonic price function approach, has high reliability because it utilizes behavioral data in existing markets. However, it suffers from multicollinearity between covariates, relatively low flexibility because it analyzes existing alternatives, and relatively low data availability, especially in developing countries. In contrast, the stated preference method, which includes CM, describes hypothetical behavior, such that it has relatively high flexibility, and can cope with multicollinearity using certain experimental design procedures. In particular, choice experiment (CE) techniques, wherein respondents select the most preferred type from alternatives, occur in many contexts, with the expectation that the application ranges and instances of CM/CE will become increasingly extended.
While CM/CE techniques apply increasingly in many contexts, there are many methodological issues to be resolved, one being ordering or positional effects. For example, Chrzan (1994) suggested that there are three positional effects in CM, these being the order of choice sets, the order of profiles or alternatives within these choice sets, and the order of attributes within these profiles. However, while the design of CM/CE questions includes decisions on the placing of checkboxes, with the exception of Ohdoko (2014) and best–worst scaling, no known
studies consider the checkbox positioning effect on these techniques. We were especially unable to identify any research on this effect in CE questions. This is important because eye movements or visual features can influence CE responses, which can lead to a certain design
‘flaw’ in the survey instrument. Therefore, we decided to conduct our research on the checkbox positioning effect on CEs using a sample of undergraduate students as a pilot study.
The article proceeds as follows. In Section 2, we summarize previous studies on the research issues associated with CE questions. In Section 3, we explain our survey design and the econometric methods employed. In Section 4, we present and discuss the estimation results. Finally, in Section 5 we provide some concluding remarks along with some topics for future research.
2. Literature Review
While CE techniques increasingly apply in many contexts, many methodological issues remain unresolved. We categorize these as falling into two main areas: psychological issues and survey instrument design. Psychological issues are frequently studied. Because CEs utilize hypothetical scenarios to measure preferences in the ‘real world,’ hypothetical bias has been seen as one of the main problems to be solved (Lusk and Schroeder 2004; Chang et al. 2009; Lusk et al.
2008; Mitani and Flores 2009; Hensher 2010).
Some research has focused on the framing effect, whereby respondents react in different ways to loss and gain framing, a feature known as loss aversion (Hess et al. 2008; Howard and Salkeld 2009).
Other studies have examined the phenomenon of
attribute nonattendance, where respondents only
attend to some of the attributes in the CE choice
set. This is one of the heuristics of processing information (Hensher et al. 2005; Colombo et al.
2013; Hess et al. 2013; Hole et al. 2013;
Kehlbacher et al. 2013; Lagarde 2013; Balcombe et al. 2015; Glenk et al. 2015; Nguyen et al. 2015).
While it is certain that we can ultimately solve such psychological challenges, survey instrument design should also be studied because CEs are a social survey instrument.
Many other fields of research have also been the subject of attention. For instance, to estimate preferences efficiently, there is experimental design in the context of designing CE questions (Kanninen 2002; Sándor and Wedel 2002; Lusk and Norwood 2005; Sándor and Wedel 2005;
Kessels et al. 2006; Raghavarao and Wiley 2006;
Ferrini and Scarpa 2007; Street and Burgess 2007;
Louviere et al. 2008; Scarpa and Rose 2008; Yu et al. 2008; Louviere et al. 2011; Carson et al. 2009;
Bush et al. 2012). The CE question approach includes choice sets such as those found in the Appendix of this paper. The choice set size, that is, the number of alternative, relates to the informational burden of choice sets for respondents (Bech et al. 2011; Schaafsma and Brouwer 2013). The opt-out option in choice sets has also been a major topic of research (Burton and Rigby 2009; Vermeulen et al. 2008; Fenichel et al.
2009; Hwang et al. 2014; Veldwijk et al. 2014). In a contingent valuation method, which is one of the stated preference approaches, Groothuis and Whitehead (2002) found that whether ‘don’t know’ responses are similar to ‘no’ responses depends on the scenario design, i.e., whether it is a willingness-to-pay study or a willingness-to-accept study.
Because CM/CE methods include social survey features, there is also the question of ordering or positional effects, which are known to
occur frequently in social survey instruments. In CM contexts, Chrzan (1994) suggested that there are three positional effects in the CM, these being the choice set order, the order of profiles or alternatives within choice sets, and the attribute order within profiles, and recommended that profile and attribute orders should be rotated. Scott and Vick (1999) conducted a CE study in Scotland to elicit patients’ preferences regarding doctor–
patient relationships, and found that one attribute (‘being able to talk’ with the doctor, which was assumed to be valued positively) was influenced by the attribute order effect. This suggests that the later the attribute is provided, the more preferred it is by respondents.
Farrar and Ryan (1999) elicited hospital consultant preferences for potential clinical service developments in the UK with CE. They employed CE questions without a certain price attribute, and found that there were no attribute order effects.
Kjær et al. (2006) implemented a CM study on Danish patient preferences for psoriasis treatment.
They suggested that respondents are more price-sensitive when the price attribute is placed at the bottom of the choice set, which leads to
‘conservative’ (that is, lower) willingness-to-pay (WTP) estimates. Ohdoko and Yoshida (2012) found no attribute order effects on nonprice attributes of Japanese residential CE questions concerning management of forest species diversity. As a whole, it would seem that we do not have to be concerned about the attribute order effect, apart from that concerning the price attribute.
Despite the fact that choice sets, profiles,
and attribute order effects have attracted attention
in many contexts, there are no known studies
focusing on the checkbox positioning effect on
CM questions. The only exception is Ohdoko
(2014), who examined the impact on best–worst scaling (BWS) in Japan, one of the CM techniques (Hess and Daly 2015). Ohdoko (2014) found that a certain checkbox positioning effect exists when estimating the coefficients of variation of item importance in the BWS, such that we should rotate checkbox position laterally in BWS questions as much as possible. Ohdoko (2014) indicated that the left-to-right Japanese lateral writing system influences BWS responses, citing Dobel et al.
(2007), who suggested that certain writing systems influence positioning bias. As the Japanese lateral writing system is left-to-right, and proceeds vertically in a top-to-bottom direction, it is almost certain that Japanese readers are accustomed to moving their eyes from left to right and from top to bottom. Especially in the context of survey research in Japan, survey instruments frequently employ a lateral writing system, therefore the lateral writing system seems to influence CE questions.
In addition, because it is common to place checkboxes for CM questions below the choice set (see the Appendix), eye movement or visual features can influence the CM response, which can lead to a certain design ‘flaw’ in CM survey instruments. Indeed, it is increasingly common to combine CM with eye-tracking techniques to examine eye movement or eye fixation in order to better understand survey responses and behavioral features relating to CM (Meißner and Decker 2010; Orquin et al. 2013; Vidal et al. 2013; Behe et al. 2014; Bialkova et al. 2014; Balcombe et al.
2015; Rasch et al. 2015). Because checkbox position can become a visual feature of CM questions and influence the eye movement of respondents, we should investigate whether there are positioning effects and if so, how they operate.
3. Materials and Methods
Nowadays, microalgae such as euglena are receiving increasing attention with regard to human consumption. While Mata et al. (2009) reviewed the development and generation of biofuels from microalgae, new food product development containing euglena is being increasingly investigated in Japan (Redmond 2015). Euglena contains many nutritional compounds, such as paramylon, vitamins, calcium, and so on. As functional food labeling has been permitted since April 2015 in Japan, there is substantial potential to diffuse or deploy euglena foods, especially in Japanese markets.
When it comes to developing brand-new food products, it is inevitable that there is a need to conduct marketing research. Krystallis et al.
(2010) suggested the usefulness of a hypothetical CE to predict the latent market structure or consumer preferences for new food products. In order to demonstrate this in the Greek market, Krystallis et al. (2010) utilized three kinds of functional children’s snacks: savory puffs, chips, and croissants. Larue et al. (2004) also conducted a CE survey on food with a functional health benefit along with genetically modified food production, suggesting that organic functional food will be profitable in Canada. In order to assess whether Japanese food consumers will accept brand-new Euglena foods, we decided to employ a CE technique to elicit consumer preferences. As a pilot study, we designed our survey using a sample of undergraduate students studying at Dokkyo University in Japan. To enable undergraduate respondents to easily understand our CE scenario, we employed the example of a hypothetical functional chewing gum.
We administered our survey at Dokkyo
University from April 4
thto 28
th, 2015. Before implementation, we conducted preliminary discussions with six undergraduates attending a Taro Ohdoko Seminar at Dokkyo University to design the questionnaire and to select the attributes of CE questions, and we conducted a pretest session to improve the quality of the questionnaire using 14 undergraduates in another Taro Ohdoko Seminar
1. We decided to conduct an in-person self-administered CE survey to elicit the preferences for attributes of chewing gum including type of nutritional content, recommendations from certain information sources, amount of nutritional content, and the price of the gum, attributes we assumed undergraduates would care about in selecting a chewing gum.
We then selected the levels of attributes, as shown in Table 1. For nutritional content, we selected calcium, vitamins, and Euglena. The levels of the first two were assumed to be familiar to Japanese undergraduates. As to recommendations from certain information sources, we selected three levels to mimic the actual situation of undergraduates, these being information on the Web such as Internet news and blogs, information from their friends, and information from the ‘tokuho’ (short for ‘tokutei hokenyou shokuhin’ or foods with special healthy qualities) label certified by the Japanese Ministry of Health, Labor, and Welfare
2. As to the amount of nutritional content and the price of the gum, we selected levels to mimic the actual situation in the Japanese market. It is clear that CE performance
1
There were 20 undergraduates in the Taro Ohdoko Seminar, of which we used 14 after excluding those with whom we had preliminary discussions in the pretest session.
2
http://www.mhlw.go.jp/topics/bukyoku/iyaku/syoku-anzen/h okenkinou/hyouziseido-1.html [Japanese only, retrieved on September 30
th2015].
depends on respondents interpreting the questionnaire correctly. Thus, we simplified our questionnaire as much as possible.
We organized our questionnaire as follows.
First, we collected demographic variables, including student gender, age, faculty, and department. Second, we provided information on Euglena, including its definition, nutritional content, and health benefits. We then asked respondents whether they had heard about these before participating in our survey, and whether they understood our interpretation. Third, we provide our hypothetical scenario (see the Appendix) and eight CE questions along with a sample answer. Finally, we collected attitudes on whether the respondents were prone to buying brand-new commodities and their ‘food-style’
scale (Satomi et al. 2006) as their lifestyle covariates with regard to food. In addition, we collected responses about whether they normally buy at least some gum.
In creating the CE choice sets, we eliminated any possible correlation with the attributes in the experimental design methodology, primarily by using the main effects of a fractional factorial design along with the attributes and levels given in Table 1 in order to reduce the number of combinations below the maximum factorial 3
4=81 (Lorenzen and Anderson 1993). We created 16 profiles, and randomly selected two of these to create our choice sets. For simplicity, we fixed the attribute order as nutritional content, recommendations, the amount of nutritional content, and price, from top to bottom. Including an opt-out option makes it possible to mimic real-world situations (Ryan and Skåtun 2004).
Thus, we provided two alternatives and one
opt-out option for each CE question, which
represented eight choices per respondent in
□ □
M N L
Type of nutritional content Euglena Vitamins I cannot choose
between the two alternatives.
Recommended by Web Friends
Amount of nutritional content
(mg) 300 mg 200 mg
Price (JPY/pack) JPY 110 JPY 130
Fig. 1: Example of Responses for Sample A
M N L
Type of nutritional content Euglena Vitamins I cannot choose
between the two alternatives.
Recommended by Web Friends
Amount of nutritional content
(mg) 300 mg 200 mg
Price (JPY/pack) JPY 110 JPY 130
□ □
Fig. 2: Example of Responses for Sample B
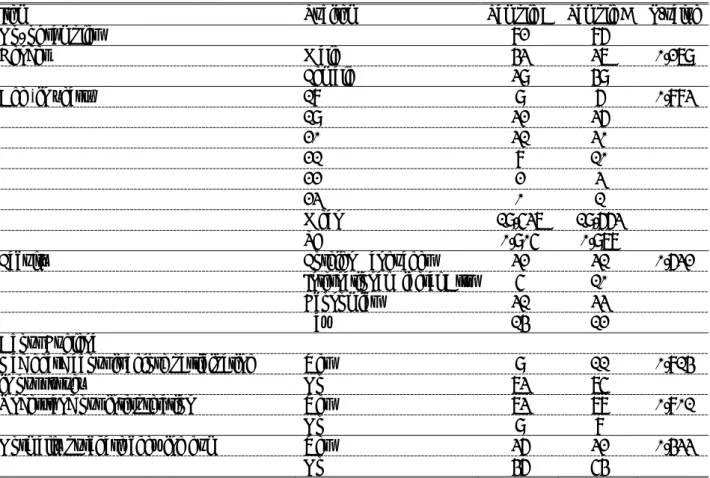
Table 1: Attributes and levels of CE
Attribute (unit) Levels
Type of nutritional content Calcium, Vitamins, Euglena
Recommended by Web, Friends, Tokuho
Amount of nutritional content (mg) 100, 200, 300
Price (JPY/pack) 90, 110, 130
accordance with incorporating a “too close to call option” as in Fenichel et al. (2009)
3.
We sampled as many undergraduates at Dokkyo University as possible using convenience sampling and campus street intercepts. We distributed our 8-item survey questionnaires to 200 undergraduates and obtained 168 effective responses incorporating 1,343 useful observations (the response rate was 84%). In order to test the checkbox positioning effect, we created two split samples: those who were provided with CE questions in which the checkboxes were placed above the choice sets (sample A), and those where they were placed below the choice sets (sample B).
In Figures 1 and 2, we provide examples of the items in samples A and B, respectively, that were
3
It is difficult to translate ‘too close to call’ in Japanese.
Instead, we utilized the expression ‘I cannot choose between the two alternatives.’
utilized in our questionnaires. Table 2 shows the demographics of our sample, while Table 3 shows the respondents’ attitudes
4.
To analyze the CE data, we employ a random utility model where we define the utility of the respondent choosing alternative i as:
U = V + ε = β x + ε , (Eq. 1) where V denotes the observable component, ε is the unobservable error component, and x
iis the attribute vector of alternative i , which has the marginal utility vector β (Louviere et al. 2000).
Previous studies have frequently employed an additively separable form for the observable component, which we also utilize
5.
4
In order to utilize every covariate of the respondents, we employed only fully answered responses. We could not identify which respondents were sampled using convenience sampling or campus street intercepts.
5
We also employed a linear form of the utility function with
regard to the attributes in the choice set.
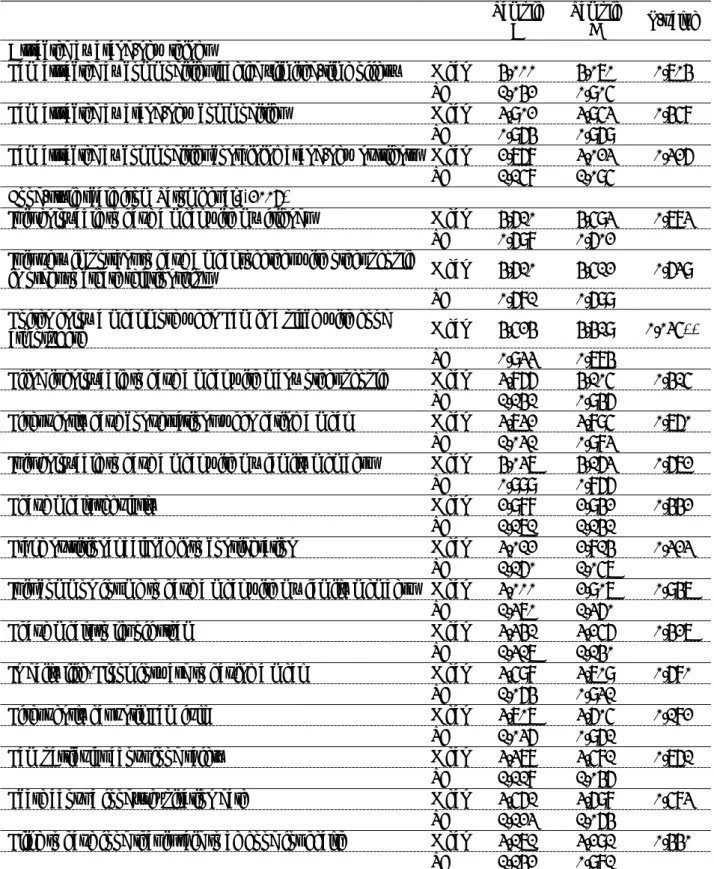
Table 2: Demographics
Item Subitem Sample A Sample B P-value
No. of samples 82 86
Gender Male 43 37 0.279
Female 39 49
Age (in years) 18 9 6 0.883
19 32 36
20 31 30
21 8 10
22 2 3
23 0 1
Mean 19.537 19.663
SD 0.905 0.978
Faculty Foreign Languages 32 31 0.632
International Liberal Arts 5 10
Economics 31 33
Law 14 12
About Euglena
Had heard about it before participating Yes 9 11 0.814
in our survey No 73 75
Understand our interpretation Yes 73 78 0.801
No 9 8
Normally purchase chewing gum Yes 36 32 0.433
No 46 54
Notes: SD is standard deviation. P-values estimated using Fisher’s exact test. The numbers in the third and fourth columns are the number of samples (except the mean and standard deviation of age).
McFadden (1974) showed that the choice probability of i among J alternatives becomes a conditional logit (CL) with random utility maximization given a Type I extreme value distribution for the error component, as follows:
6P = exp V ∑ exp V ⁄ . (Eq. 2) Revelt and Train (1998) demonstrated that a random parameter logit (RPL) with the use of repeat data to estimate the choice probability with preference heterogeneities could relax the assumptions of CL, i.e., preference homogeneity and the independence of irrelevant alternatives (IIA).
7The choice probability of respondent
6
This assumes a strictly increasing, continuous, and strictly quasi-concave utility function.
7
For any two alternatives i and k, the IIA property of CL in Eq. 2 is equivalent to the ratio of the probabilities not depending on any alternatives other than i and k (P P = ⁄ exp V exp V ⁄ , see, e.g., Train (2009)). With RPL, the ratio of the probabilities becomes:
n n = 1, ⋯ , N is given as follows within the parameter space Ω:
π = ∏ P f β|Ω dβ, (Eq. 3)
where t t = 1, ⋯ , T denotes the number of times the respondent answers, P is the form of CL, and f β|Ω is known as a mixing distribution. Previous studies have frequently employed the normal distribution for f β|Ω , which we also utilize.
When employing RPL, the marginal utility parameter vector, β, becomes:
β = β + σz, (Eq. 4)
where β and σ denote the mean and standard deviation parameter vector of β , while z is an independently and identically distributed vector, for which we assumed the standard normal
P P ⁄ = ∏ exp V ⁄ ∑ exp V f β|Ω dβ /
∏ exp V ⁄ ∑ exp V f β|Ω dβ. Then, the ratio
depends on all alternatives other than i and k, and IIA is
totally relaxed by RPL.
distribution. We can capture preference heterogeneities by the standard deviation parameter vector σ. In this article, we assume that z is uncorrelated across individuals, as is frequently assumed for simplicity.
In order to test the checkbox positioning effect, we pooled samples A and B, and then incorporated the sample B dummy variable in the cross-terms of attribute variables in the choice set when estimating the observable utility component, V , as follows:
V = β x + γ x × D , (Eq. 5)
where D is the sample B dummy variable and takes a value of one if the respondent belongs to sample B and 0 otherwise, and γ denotes the coefficient vector of the checkbox positioning effect.
We employ R 3.2.2 (R Core Team 2015) and the procedure ‘mlogit’ when estimating RPL. We set alternative specific constants (ASCs) for the leftmost and middle options in the choice set to test for alternative positional effects, as pointed out by Chrzan (1994)
8. As the rightmost option in the choice set denotes the opt-out option, this option is not preferred when every ASC is positively and significantly estimated. We employed effects coding for the qualitative variable in our choice sets in accordance with Louviere et al. (2000) and Bech and Gyrd-Hansen (2005)
9. We decided to estimate two models. In Model 1, we treated as numerical variables the attributes amount of nutritional content and price. In Model 2, we treated every level of attribute as a qualitative
8
Scarpa et al. (2005) suggested that the error component model, which is a random parameter logit model, displays robustness along with the status quo effect. Although we decided to estimate simply by introducing the maximum number of ASC to capture the effect of our opt-out option, it remains a topic for future research.
9