Proposal for the Awakening Behavior Detection System Using Images and Adaptation for
Fluctuation of Brightness Quantity in the Captured Image
著者 Satoh Hironobu, Ohkura Takayuki, Takeda Fumiaki
journal or
publication title
IEEE International Conference on Modeling, Simulation and Applied Optimization
(ICMSAO‑2011)
year 2011‑04
URL http://hdl.handle.net/10173/654
Proposal for the Awakening Behavior Detection System Using Images and Adaptation for Fluctuation of Brightness Quantity
in the Captured Image
Hironobu Satoh 1, Takayuki Ohkura 2, Fumiaki Takeda 3
1, 2, 3 Kochi University of Technology
185 Miyanokuchi Tosayamada-cho Kami-shi Kochi 782-8502 Japan
1satoh.hironobu@kochi-tech.ac.jp
2145026w@gs.kochi-tech.ac.jp
3takeda.fumiaki@kochi-tech.ac.jp
Abstract
Recently, accidents such that seniors fall down from the bed in care facilities or hospitals are increased. To prevent these accidents, we have developed the awakening behavior detection system using Neural Network.
In this paper, it is a problem that the detection success rate of the current system using captured image in the clinical site is not enough.
So, we analyze the captured image in the clinical site. From the result of the histogram analysis, it proves that the fluctuation of brightness quantity makes decrease the detection capability. Therefore, to decrease the influence of the brightness quantity, the histogram of the captured image should be equalized.
Finally, we show that the histogram equalization reduces fluctuation of brightness quantity, numerically.
1. Introduction
Recently, accidents such that seniors fall down from the bed in care facilities or hospitals are increased [1], [2]. To prevent these accidents, caregivers or nurses have to always observe them.
However, it is difficult for caregivers or nurses to keep observing them all time. To aid caregivers or nurses, there are some detecting systems in the field. One is the detection system using pressure sensing mat.
Another is the detection system using an infrared sensor. However, these systems have some problems.
First, the previous system detects senior’s behavior when the senior have just fallen. Second, the system detects senior’s behavior when they only sit up on the bed. To solve the problem, we propose an awakening detection system using Neural Network (NN) [3]-[6]
in hospital use. The purpose of this research is detecting the objective person’s behavior such as falling down from the bed. In this research, the system classifies the objective person’s behavior into five states. Namely, they are lying in the bed, being sitting up in the bed, sitting in the bed, almost falling from the bed, and having fallen from the bed, respectively. First of all, an image of the objective person in the bed is captured by the Web camera. Then, the captured
images are detected into five states using the NN, respectively.
In this paper, until now, the captured image in the laboratory is used for the experiment. (The captured image in the laboratory is abbreviated to a lab image.) In addition, we make experiment using the awakening behavior detection system in the clinical site. So, the detection capability of the awakening behavior detection system using the captured image in the clinical site for the detection is verified. (The captured image in the clinical site is abbreviated to a clinical image.) From the result of the experiment using the clinical image, it shows that the detection success rate of the system is not enough. As a cause, it is considered that this reason is fluctuation of the brightness quantity in the captured image according to the capturing environment. For this reason, the histogram of the captured image such as the lab image and the clinical one are analyzed. From the result of histogram analysis, it is proved that the brightness distribution is different, respectively. To solve the problem, the histogram of the captured image should be equalized. Finally, we show the effectiveness of the new feature extractive method such as the histogram equalization for fluctuation of brightness quantity.
2.SYSTEM CONSTRUCTION 2.1 Hardware
The detection apparatus is shown in Fig. 1. It is consists of a camera unit and a pedestal unit. The Web camera is set in a camera unit. It can be adjusted from 120 cm to 175 cm above the floor. A pedestal unit, which includes a Personal Computer, must be set as near as possible around the bed. As shown in Fig. 2, the apparatus is set beside the bed.
2.2 Software
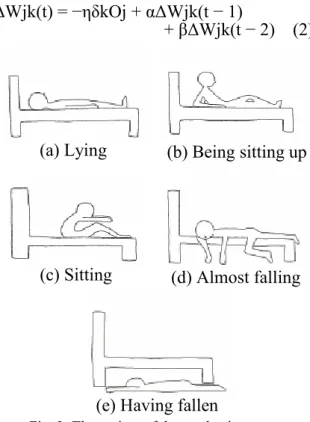
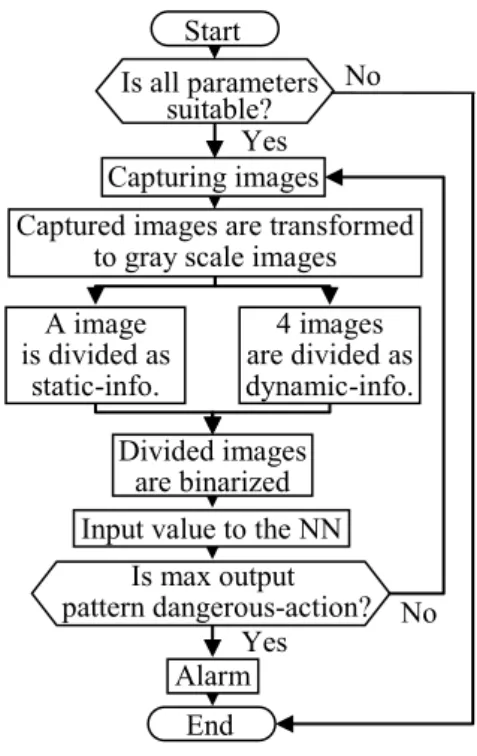
In this research, the system classifies the objective person’s behavior into five states. Variety of awakening states is shown in Fig. 3. The NN Construction of the proposed method is shown in Fig.4. Figure 5 shows detection procedure. In this system, the captured image of the objective person’s behavior on the bed is captured by the Web camera.
Next, to make input value of the NN, the feature extraction is executed from the captured images.
Then, a transition of the transformation from the color image to blocked binary image via the gray scale one is shown in Fig. 6.
In the feature extractive method, the captured image is transformed into gray scale image with equation (1). Where V means transformed after value of average brightness, R means red value of average brightness, G means green value of average brightness, B means blue value of average brightness.
V = (R × 30 + G × 59 + B × 11) / 100 (1)
Figure 7 shows the making method for the NN input value. Each image is captured every one second.
Four images among five captured images are used as dynamic information. Another image is used as static information. Five images are defined one data set for the detection and the learning. In the first, the feature extraction method of the dynamic information is shown in Fig. 7. The gray-scale image are divided into 36 (6×6) blocks. Then, each block’s values are averaged on each line and each column. Next, averaged values are binarized using a fixed threshold value. Finally, these values are input to the NN. In the second, the feature extraction method of the static information is shown in Fig. 7. The gray-scale image is divided into 200 (20×10) blocks. Then, each block’s values are averaged. Next, averaged values are binarized using a fixed threshold. Finally, these values are inputted into the NN. Fig. 8 shows the dividing method of the input data for the dynamic information and static information. We use the improved back propagation algorithm [7]-[10] as a learning algorithm.
Equation (2) shows the equation of the improved back propagation algorithm. Where W means weight, t means the sample, η means the positive learning coefficient, α means the proportional coefficient of inertia term, and β means the proportional coefficient of oscillation term. This algorithm makes it possible to converge faster than usual back propagation algorithms, and easier to escape from local minima.
ΔWjk(t) = −ηδkOj + αΔWjk(t − 1)
+ βΔWjk(t − 2) (2)
3. Influence of the brightness quantity and analysis
Until now, the learning and the detection are executed using the lab image to verify the effectiveness of the awakening detection system. In the lab image, the setting position of the awakening detection apparatus, the brightness quantity is almost constant.
Fig. 1: The Detection apparatus Camera unit
Pedestal unit
Fig. 2: Setting feature of the detection apparatus The apparatus
Fig. 3: The variety of the awakening states
(e) Having fallen
(c) Sitting (d) Almost falling (a) Lying (b) Being sitting up
Input
layer Hidden
layer Output layer
NN input value Select max output value Detection result
NN
Fig. 4: NN Construction of the proposed method.
On the other hand, in the clinical image, the awakening detection apparatus and the height of the WEB camera is same to that of the lab image.
However, the brightness quantity in the clinical site is not constant. The brightness quantity in the clinical site is changed according to the time. There is some difference about the brightness quantity between the clinical image and the lab image. In this paper, to confirm the detection capability by the difference of the environment between the lab image and the clinical image, the detection experiment using the clinical image is executed.
The detection experiment using the clinical images is shown as follow. First, the captured image is divided into two awakening states. Figure 9 shows two awakening states. As the Fig. 9 indicates, it is defined that the objective person is lying on the center of the bed as safety action. Also, it is defined that the objective person is getting out of the bed as dangerous action. We define result (a) Lying, (b) Being sitting up, and (c) Sitting as safety action using the proposed systems shown in Fig. 10. Otherwise, we define result (d) Almost falling as dangerous action using the proposed system as shown in Fig.10.
Start
Is all parameters suitable?
Capturing images Captured images are transformed
to gray scale images A image
is divided as static-info.
4 images are divided as dynamic-info.
Yes
Yes No
No Alarm
End Divided images
are binarized Input value to the NN
Is max output pattern dangerous-action?
Fig. 5: The procedure of the awakening behavior detection
Fig. 6: Transition of the transformation from the captured image for the NN
(b) Dangerous action Fig. 9: Awakening states
(a) Safety action
200 6
6
tmp0 tmp1 tmp2
The static information NN input value The dynamic information
6 6
6 6
6 6 tmp3 tmp4
Fig. 7: The image of the making method for the NN input value
Fig. 8: Dividing method of the input data
20 10
(b)Static information (a)Dynamic information
Safety action
Dangerous action Output
layer
(c) Sitting (a) Lying
Being sitting up (b)
Almost falling (d)
Having fallen
(e) (Out of experiment) NN
Fig. 10: Treatment of safety action and dangerous one in the clinical site
In this experiment, 10 data sets of the lab image per appearance are used for the learning. Objective persons of the lab image for the learning are two male (male A and male B). 20 data sets the clinical image per appearance are used for the detection. Objective persons of the clinical images for the detection are one male and one female (male C and female A).
The NN construction is the input layer with 248 neurons, the hidden layer with 30 neurons, and the output layer with 5 neurons.
The detection success rate of this experiment is shown in Table 1. From the experimental result, detection success rate is not enough. The difference of the environment is suspected as a cause.
Safety
action Dangerous action Detection
success rates (success/
trials)
55.0%(11/20) 70.0%(14/20)
Thus, in this section, we discuss about the fluctuation of brightness quantity of the captured image, because it is considered that the detection capability is most heavily affected by the fluctuation of brightness quantity in the difference of the environment. Therefore, the brightness range of a detection area (the skin-colored of the objective person in the captured image is defined as the detection area.) is confirmed. The detection area of the captured image is shown in the Table 2. In the Table 2, the brightness quantity of the clinical image A is almost same to that of the lab image. The brightness quantity of the clinical image B is lower than that of the lab image. Still more, the clinical image C is higher than that of the lab image.
Average of brightness quantity
in each image
Brightness range of detection area(0~255) Lab
image 87 50~90
Clinical
image A 91 60~90
Clinical
image B 23 10~30
Clinical
image C 189 190~220
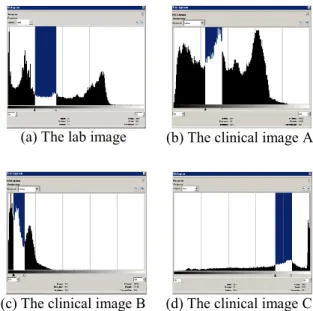
As the Table 2 indicates, it is proved that the detection area has much difference among the clinical image. Additionally, the histogram is made to confirm the detection area. The histogram is shown in the Fig.
11. In these histograms, the inverted color part shows the detection area. The brightness distribution and the brightness range of the detection area are different as show in the Fig. 11. Consequently, there are difference between the converted binary image from the captured image with the high brightness and the converted binary image from the captured image with the low brightness, because the only one threshold value is used to convert from the captured image to the binary image. As a result, it is the reason that the detection success rate is not enough.
To decrease the influence of fluctuation of brightness quantity, the captured image should be equalized by equation (3).
Equation (3) shows the processing of the histogram equalization. Where LEVEL means maximum brightness value, SIZE means the pixel number of a target image, i means brightness value, p(i) means the frequency of each brightness value, dl means processed brightness value by the histogram equalization.
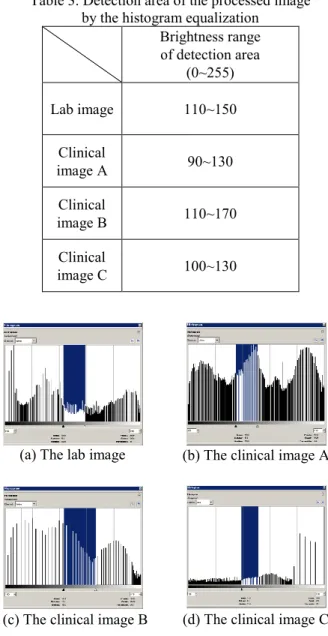
Therefore, it is supposed that the histogram equalization has a beneficial effect to decrease the influence of fluctuation of brightness quantity in the clinical site. The detection area and the brightness distribution of processed image by histogram equalization are shown in Table 3 and Fig. 12. In these histograms, the inverted color part shows the detection area. As the Table 3 and the Fig. 12 indicate clinical images processed by the histogram equalization, the brightness range of the detection area of clinical images are similar to that of the lab image.
Table 1. The experimental results using the clinical image
Table 2. The brightness range of Detection area
∑
d
0
= i
) i ( SIZE P
LEVEL
=
dl (3)
Fig. 11: Histograms and Detection area (c) The clinical image B (d) The clinical image C
(b) The clinical image A (a) The lab image
Table 3. Detection area of the processed image by the histogram equalization
Brightness range of detection area
(0~255)
Lab image 110~150
Clinical
image A 90~130
Clinical
image B 110~170
Clinical
image C 100~130
Next, to verify decreasing the influence of fluctuation of brightness quantity, detective experiment is executed. First, the objective person image with artificially decreased lighting intensity to 3.5 lux is captured (abbreviated as verification image A). The objective person image with normal lighting intensity (abbreviated as verification image B) is captured.
Next, in the verification image A and the verification image B, the original image and the processed image, which are processed by the histogram equalization, are converted to the binary image. At this time, the threshold value is changed from 127 to 168. Because, in the histogram after equalizing, the brightness distribution is shifted from low brightness to high brightness. Then, in the processed image, we show a comparison between binarized verification image A and binarized verification image B as show in Fig. 13 and Fig. 14 respectively.
The binary image converted from the original image of the verification image A and the verification image B is shown in Fig. 13. Also, the binary image converted from the processed image of the verification image A and the verification image B is shown in Fig.
14. As Fig. 13, it is confirmed that binarized original image of verification image A is different to binarized original image of verification image B. As shown in Fig. 14, it is confirmed that binarized processed image of verification image A is similar to the binarized processed image of verification image B. It is considered that the histogram equalization has an excellent beneficial effectiveness on the feature extractive method.
Verification image B (Lighting intensity
is 443 lux) Verification image A
(Lighting intensity is 3.5 lux)
Mosaic silhouette image
of verification image A Mosaic silhouette image of verification image B Fig. 13: Mosaic silhouette images by current
feature extractive method
Fig. 14: Mosaic silhouette images transformed by new feature extractive method
Mosaic silhouette image
of verification image A Mosaic silhouette image of verification image B Verification image A
(Lighting intensity is 3.5 lux)
Verification image B (Lighting intensity
is 443 lux) (c) The clinical image B (d) The clinical image C
(b) The clinical image A (a) The lab image
Fig. 12: The histogram and Detection area of the processed image by the histogram equalization
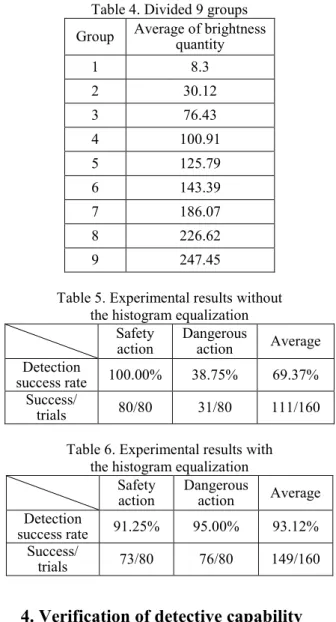
Table 4. Divided 9 groups Group Average of brightness quantity
1 8.3
2 30.12
3 76.43
4 100.91
5 125.79
6 143.39
7 186.07
8 226.62
9 247.45
Table 5. Experimental results without the histogram equalization
Safety
action Dangerous
action Average Detection
success rate 100.00% 38.75% 69.37%
Success/
trials 80/80 31/80 111/160
Table 6. Experimental results with the histogram equalization
Safety
action Dangerous
action Average Detection
success rate 91.25% 95.00% 93.12%
Success/
trials 73/80 76/80 149/160
4. Verification of detective capability for the histogram equalization
4.1 Simulation
In this section, the detective capability of the histogram equalization is confirmed by simulation. In this simulation, the objective person are 2 male (male A, male B). Here, it is needed that between from low brightness image to high brightness image is saved. So, the brightness of the room and exposure of the camera are changed while detecting. Therefore, the light in a laboratory and the exposure of the WEB camera are changed while capturing images. Next, captured image are classify into 9 groups according to the difference of the brightness. Table 4 shows each group. For the learning, 20 images each person and each pattern in the group 5, whose average of the brightness is 125.79, is used.
The detection success rate of this experiment without the histogram equalization is shown in Table 5.
The detection success rate of this experiment with the histogram equalization is shown in Table 6.
As a result, the detection success rate with the histogram equalization is better than that of without the histogram equalization. Therefore, effectiveness of the histogram equalization is confirmed.
4.2 Experiments using online data
In section 4.1, usefulness of the proposed feature extraction is confirmed. In this section, the detective capability of the awaking behavior detection system is verified using online data. As an experimental condition, detection pattern and subjects are same to the condition of section 4.1. It is needed that from low brightness image to high brightness image is saved. The brightness of the room and exposure of the camera are changed while detecting. Table.7 shows the average of the brightness of the captured image for detective every 7 category. In the experiment for the detection of the dangerous action, subjects behave the dangerous action while one minute. The behavior of the subject is detected every one second. When the subject’s behavior is detected dangerous action more than 6 times in 10, this result is judged as correct detection. On the other hand subjects behave the safety action while one minute.
When the subject’s behavior is detected safety action lower than 6 times in 10, this result is judged as correct detection. The detection while one minute is defined as one set. In dangerous action and safety action, 30 sets is executed every action.
Table 8 shows the average rate of the detection in every action. The detection rate of the safety action is 97.61%.
Moreover, the rate of the dangerous action is 91.42%.
From this result, the usefulness of the awaking behavior detection system using proposed feature extraction is confirmed.
Table 7. Average brightness in images using for detection
Group Brightness quantity in each group
1 2.23
2 63.82
3 88.28
4 107.78
5 141.46
6 188.77
7 223.78
Table 8. Detection success rate Safety
action Dangerous action Detection
success rate 97.61% 91.42%
Success/
trials 205/210 192/210
Conclusion
In this paper, the awakening behavior detection system was proposed. This system had a problem that the detection success rate of an experiment using clinical images was not enough.
Therefore, the captured image in the clinical site of fluctuation of brightness quantity was analyzed.
From the result of this analysis, it was considered that the histogram equalization has a beneficial effect to the influence of fluctuation of brightness quantity.
In the feature, to confirm the detection capability using the new feature extractive method, we will show the detection success rate in real hospitals.
References
[1] T. Yamazaki, Y. Sugawara, M. Hoshino, F. Ozaki, “Risk Factors Related to Falls from
Beds and a Study on Preventing Patient’s Fall”, Ozaki Journal of the Japan Society of Nursing 12(1), 2003, 2-12.
[2] N. Okada, Y. Hamamoto, K. Okamura,
“A method for understanding patient’s behavior by image recognition”, Institute of Electronics, Information and Communication Engineers Technical Report Vol.103 No.738, 2004, 31-36.
[3] S. Haykin, “Neural Networks a comprehensive foundation”, New jersey, USA 1998, pp. 161-173.
[4] H. Satoh and F. Takeda, “Development of DSP Unit for Online Tuning and Application to Neural Pattern Recognition System,” 8th International Conference on Knowledge-Based Intelligence Information & Engineering Systems, Wellington, New Zealand 2004, pp. 866-873.
[5] B. Sun and F. Takeda, “Application of a Neural Network with Gaussian Function on Currency Recognition System,” 6th the Society of Instrument and Control Engineers Annual Conference 2005, Okayama, Japan 2005, pp. 601-605.
[6] R. Ikeda, H. Satoh and F. Takeda, “Development of Awakening Behavior Detection System Nursing Inside the House,” International Conference on Intelligent Technology 2006, Taipei, Taiwan 2006, pp.
65-70.
[7] L. Mi and F. Takeda, “Research on Individual Recognition System with Writing Pressure Based on Customized Neuro-template with Gaussian Function,”
9th Knowledge Intelligent Information and Engineering System 2005 Part2, Melbourne, Australia 2005, pp. 263-269.
[8] F. Takeda, “Dish Extraction Method with Neural Network for Food Intake Measuring System on Medical Use,” IEEE International Symposium on Computational Intelligence for Measurement Systems and Applications, Lugano, Switzerland 2003, pp.
56-59.
[9] R. Ikeda. H. Satoh, F. Takeda, “Development of Awakening Behavior Detection System Nursing Inside the House”, International Conference on Intelligent Technology, 2007, pp65-70
[10] T. Matsubara, H. Satoh, F. Takeda” Proposal of an Awaking Detection System Adopting Neural
Network in Hospital Use”, IEEE SoSE 2008, Hawaii, 2008, CD-ROM(IFMIP328.pdf)