Volume 2014, Article ID 219038, 14 pages http://dx.doi.org/10.1155/2014/219038
Clinical Study
A New Surgical Technique of Pancreaticoduodenectomy with Splenic Artery Resection for Ductal Adenocarcinoma of the
Pancreatic Head and/or Body Invading Splenic Artery: Impact of the Balance between Surgical Radicality and QOL to Avoid Total Pancreatectomy
Ryosuke Desaki, Shugo Mizuno, Akihiro Tanemura, Masashi Kishiwada, Yasuhiro Murata, Yoshinori Azumi, Naohisa Kuriyama, Masanobu Usui, Hiroyuki Sakurai, Masami Tabata, and Shuji Isaji
Department of Hepatobiliary Pancreatic and Transplant Surgery, School of Medicine, Mie University, 2-174 Edobashi, Tsu, Mie, 514-0001, Japan
Correspondence should be addressed to Shugo Mizuno; [email protected] Received 14 March 2014; Accepted 18 April 2014
Academic Editor: Masahiko Hirota
Copyright © 2014 Ryosuke Desaki et al. This is an open access article distributed under the Creative Commons Attribution License, which permits unrestricted use, distribution, and reproduction in any medium, provided the original work is properly cited.
Aim. When pancreatic ductal adenocarcinoma (PDAC) of the head and/or body invades the splenic artery (SA), we usually cannot avoid total pancreatectomy (TP). For such tumors, we developed a new surgical technique of proximal subtotal pancreatectomy with splenic artery and vein resection, so-called pancreaticoduodenectomy with splenic artery resection (PD-SAR). Method. We retrospectively reviewed a total of 84 patients with curative intent pancreaticoduodenectomy (PD) for PDAC of the head and/or body. These 84 patients were classified into the two groups: conventional PD (𝑛 = 66) and PD-SAR (𝑛 = 18). Most patients were treated by preoperative chemoradiotherapy (CRT). Result. Postoperative MDCT clearly demonstrated enhancement of the remnant pancreas at 1 and 6 months in all patients examined. There were no patients with pancreatic cut margin positive in both groups. Overall survival rates were very similar between PD and PD-SAR (3-year OS: 23.7% versus 23.1%, 𝑃 = 0.538), despite the facts that the tumor size and the percentages of UICC-T4 determined before treatment were higher in PD-SAR. The remnant pancreatic volume by CT volumetry was significantly smaller in PD-SAR than in PD at 1 month but showed no significant difference at 6 months. Total daily insulin dose was significantly higher in PD-SAR than in PD at 1 month, while showing no significant differences between the two groups thereafter. As compared to TP, the dose in PD-SAR was significantly lower. The prediction studies of postoperative pancreatic functions using several markers revealed no significant differences between PD and PD-SAR.
Glucagon stimulating test confirmed enough insulin secretion ability from the remnant pancreas after PD-SAR. Conclusion. PD- SAR with preoperative CRT seems to be promising surgical strategy for PDAC of head and/or body with invasion of the splenic artery, in regard to the balance between operative radicality and postoperative QOL.
1. Introduction
1 2 3
When pancreatic ductal adenocarcinoma (PDAC) of the head and/or body invades the origin of splenic artery (SA), we usually cannot be able to avoid total pancreatectomy (TP) because the blood supply of distal pancreas becomes scarce after dividing the origin of splenic artery. Prognosis of PDAC patients following TP, however, has not overcome that of
pancreaticoduodenectomy (PD) [1–3]. Moreover, TP causes
insulin dependent diabetes mellitus (DM) and exocrine
insufficiency, leading to a poor quality of life (QOL). DM
after TP means a complete lack of endogenous insulin and
glucagon, leading to uncontrollable frequent and deep states
of hypoglycemia with hyperglycemic episodes (brittle dia-
betes) [3]. Recently, favorable perioperative control of blood
glucose levels for patients with TP has been reported by using
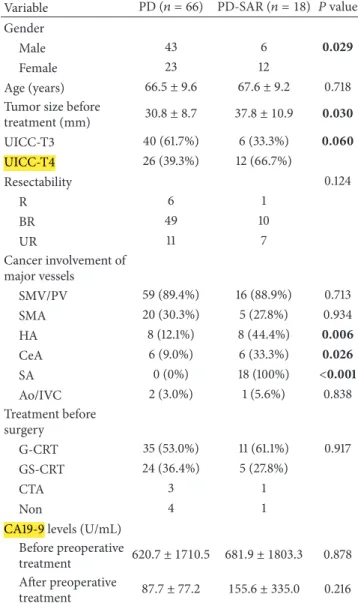
Table 1: Comparison of preoperative characteristics between PD and PD-SAR.
Variable PD (𝑛 = 66) PD-SAR (𝑛 = 18) 𝑃 value Gender
Male 43 6 0.029
Female 23 12
Age (years) 66.5 ± 9.6 67.6 ± 9.2 0.718
Tumor size before
treatment (mm) 30.8 ± 8.7 37.8 ± 10.9 0.030
UICC-T3 40 (61.7%) 6 (33.3%) 0.060
UICC-T4 26 (39.3%) 12 (66.7%)
Resectability 0.124
R 6 1
BR 49 10
UR 11 7
Cancer involvement of major vessels
SMV/PV 59 (89.4%) 16 (88.9%) 0.713
SMA 20 (30.3%) 5 (27.8%) 0.934
HA 8 (12.1%) 8 (44.4%) 0.006
CeA 6 (9.0%) 6 (33.3%) 0.026
SA 0 (0%) 18 (100%) <0.001
Ao/IVC 2 (3.0%) 1 (5.6%) 0.838
Treatment before surgery
G-CRT 35 (53.0%) 11 (61.1%) 0.917
GS-CRT 24 (36.4%) 5 (27.8%)
CTA 3 1
Non 4 1
CA19-9 levels (U/mL) Before preoperative
treatment 620.7 ± 1710.5 681.9 ± 1803.3 0.878 After preoperative
treatment 87.7 ± 77.2 155.6 ± 335.0 0.216 UICC: International Union for Cancer Control; R: resectable; BR: borderline resectable; UR: unresectable; SMV: superior mesenteric vein; PV: portal vein; SMA: superior mesenteric artery; HA: hepatic artery; CeA: celiac artery; SA: splenic artery; Ao: aorta; IVC: inferior vena cava; G-CRT:
gemcitabine-based chemoradiotherapy; GS-CRT: gemcitabine plus S1-based chemoradiotherapy; CTA: chemotherapy alone; Non: no treatment before surgery.
an artificial endocrine pancreas during the perioperative term [4] or at an outpatient clinic by using continuous subcu- taneous insulin infusion pumps [5]. Nevertheless, inevitable insulin therapy, presence of brittle DM, and malabsorption after TP leads to poor QOL. Therefore, if the surgical margin status could be a microscopically negative (R0), TP should be
avoided.
4
For the tumors with invasion of the SA, we had developed a new surgical technique of proximal subtotal pancrea- tectomy with splenic artery and vein resection, so-called pancreaticoduodenectomy with splenic artery resection (PD- SAR), usually in consideration of the balance between oper- ative radicality and postoperative QOL. Blood flow to the
Table 2: Comparison of surgical outcomes between PD and PD- SAR.
PD (𝑛 = 66) PD-SAR (𝑛 = 18) 𝑃 value Blood loss (g) 1967 ± 1874 1605 ± 1215 0.340 Operation time (min) 587 ± 118 607 ± 127 0.429 Combined resection
SMV/PV 58 (87.9%) 18 (100%) 0.271
Colon 7 (10.6%) 0 0.336
Total gastrectomy 1 (1.5%) 2 (11.1%) 0.219
HA 3 (4.5%) 1 (5.6%) 0.656
SA 0 (0%) 18 (100%) <0.001
Type of P-J anastomosis
PWST 65 (98.5%) 12 (61.1%) <0.001
Dunking 1 (1.5%) 6 (38.9%)
Blood transfusion (mL) 400 ± 420 320 ± 406 0.660 Postoperative
complication
C-D grade ≥ III 13 (19.7%) 3 (16.7%) 0.790
DHS (days) 40.2 ± 17.9 38.2 ± 13.5 0.980
P-J: pancreaticojejunostomy; PWST: pair-watch suturing technique (16); C- D: Clavien-Dindo classification (18); DHS: duration of hospital stay.
pancreas tail can be obtained by the left gastroepiploic artery (LGEA) and/or posterior epiploic artery (PEA) even if we have to resect the left gastric artery (LGA) combined with total gastrectomy and splenectomy [6]. Previously, proximal subtotal pancreatectomy was performed by preserving SA to maintain blood supply of the pancreatic tail [7, 8]. Our procedure of PD-SAR was inspired by Sutherland et al. 5 [9] and Warshaw [10] technique for distal pancreatectomy with preservation of the spleen which resects the SA and vein along with the pancreas but with careful preservation of the vascular collaterals in the splenic hilum.
The aim of the present study was to evaluate the sig- nificance of PD-SAR by examining surgical outcomes, RPV, and prognosis in comparison with those of conventional PD, paying special attention to postoperative pancreatic functions, total daily insulin dose, and nutritional status using
TP as a control. 6
2. Patients and Methods
We retrospectively reviewed a total of 84 patients who had consecutively undergone curative intent pancreatico- duodenectomy (PD) for PDAC of the head and/or body at the Mie University Hospital between January 2008 when we experienced the first case with PD-SAR and December 2013. These 84 patients were classified into the two groups: 7 conventional PD (𝑛 = 66) and PD-SAR (𝑛 = 18).
Most patients were treated by preoperative chemoradio-
therapy (CRT): gemcitabine-based CRT (G-CRT) (40 Gy
radiation in 25 fractions with weekly intravenous infusion
of gemcitabine 800 mg/m2 for 5 weeks including one-week
break) [11, 12] or gemcitabine plus S1-based CRT (GS-CRT)
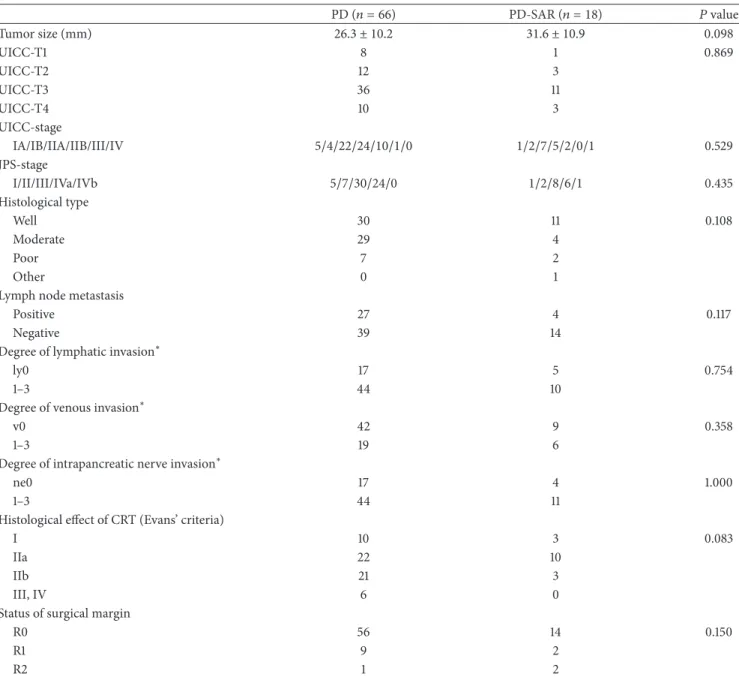
Table 3: Comparison of pathological findings of resected specimen between PD and PD-SAR.
PD (𝑛 = 66) PD-SAR (𝑛 = 18) 𝑃 value
Tumor size (mm) 26.3 ± 10.2 31.6 ± 10.9 0.098
UICC-T1 8 1 0.869
UICC-T2 12 3
UICC-T3 36 11
UICC-T4 10 3
UICC-stage
IA/IB/IIA/IIB/III/IV 5/4/22/24/10/1/0 1/2/7/5/2/0/1 0.529
JPS-stage
I/II/III/IVa/IVb 5/7/30/24/0 1/2/8/6/1 0.435
Histological type
Well 30 11 0.108
Moderate 29 4
Poor 7 2
Other 0 1
Lymph node metastasis
Positive 27 4 0.117
Negative 39 14
Degree of lymphatic invasion
∗ly0 17 5 0.754
1–3 44 10
Degree of venous invasion
∗v0 42 9 0.358
1–3 19 6
Degree of intrapancreatic nerve invasion
∗ne0 17 4 1.000
1–3 44 11
Histological effect of CRT (Evans’ criteria)
I 10 3 0.083
IIa 22 10
IIb 21 3
III, IV 6 0
Status of surgical margin
R0 56 14 0.150
R1 9 2
R2 1 2
UICC: International Union for Cancer Control; JPS: Japan Pancreatic Society; ly: degree of lymphatic invasion; v: degree of venous invasion; ne: degree of intrapancreatic nerve invasion; R0: negative surgical margin; R1: positive microscopic margin; R2: positive gross margin.
∗Excluding 8 cases in which histological assessment could not be determined.
(50.4 Gy radiation in 28 fractions with biweekly intravenous infusion of gemcitabine 600 mg/m2 for 8 weeks and oral S-1, active combination of tegafur, gimeracil, and oteracil, 60 mg/m2/day from day 1 to day 21 and from day 29 to day 49). We compared the two groups with respect to prognosis, postoperative pancreatic functions, and nutritional status.
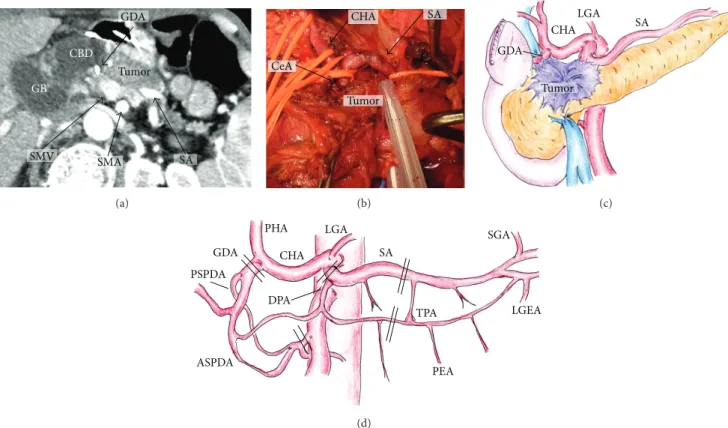
2.1. Indication and Surgical Procedure of PD-SAR. We deter- mined the indication for PD-SAR for PDAC patients as follows: pancreatic head and/or body tumor invading the proximal site of SA as well as gastroduodenal artery (GDA)
according to preoperative multidetector computed tomog- raphy (MDCT) and intraoperative findings (Figures 1(a)–
1(c)). MDCT was performed according to a defined pancreas protocol as four-phasic contrast-enhanced MDCT with thin slices at intervals of 1 mm [12]. We usually determined the 8 indication of PD-SAR according to initial MDCT findings.
After CRT, tumor abutment of SA was almost unchanged on MDCT even when the tumor size decreased. Therefore, indication of PD-SAR did not change before and after CRT.
However, one patient who was scheduled to perform PD- SAR underwent conventional PD, because SA could be easily
dissected from the tumor. 9
GDA
CBD GB
SMV SMA
Tumor
SA
(a)
CHA SA
CeA
Tumor
(b)
GDA
CHA
LGA SA
Tumor
(c)
PSPDA GDA
PHA CHA
LGA
DPA
ASPDA
SA
TPA
PEA
SGA
LGEA
(d)
Figure 1: Indication of PD-SAR according to MDCT findings (a), intraoperative findings ((b) dotted circle indicates tumor border and schema of intraoperative findings) (c), and the arterial anatomy around the pancreas ((d) double line indicates cutting sites of artery). GB:
gallbladder. CBD: common bile duct. SMV: superior mesenteric vein. SMA: superior mesenteric artery. SA: splenic artery. CeA: celiac artery.
PHA: proper hepatic artery. LGA: left gastric artery. CHA: common hepatic artery. GDA: gastroduodenal artery. PSPDA: posterior superior pancreaticoduodenal artery. ASPDA: anterior superior pancreaticoduodenal artery. DPA: dorsal pancreatic artery. TPA: transverse pancreatic artery. SGA: short gastric artery. LGEA: left gastroepiploic artery. PEA: posterior epiploic artery.
Table 4: Comparison of tumor recurrent sites between PD and PD- SAR.
PD
(𝑛 = 66) PD-SAR
(𝑛 = 18) 𝑃 value
Recurrence 44 (66.7%) 11 (68.8%) 0.873
Local
Remnant pancreas
∗2 (3.0%) 3 (18.8%) 0.109 Remnant pancreas alone 0 (0%) 1 (6.3%) 0.483
Others 4 (6.1%) 2 (12.5%) 0.825
Metastasis
Liver 15 (22.7%) 3 (18.6%) 0.817
Lung 10 (15.2%) 2 (12.5%) 0.957
Lymph node 2 (3.0%) 1 (6.3%) 0.838
Dissemination 9 (13.6%) 3 (18.6%) 0.957
∗
Recurrence of remnant pancreas associated with metastasis of other organs.
Since 2005, in our institution, surgical procedures of PD for PDAC of the head had been standardized for resection technique as anterior approach to the superior mesenteric artery [13, 14] according to the concepts of radical antegrade modular pancreatosplenectomy by Strasberg et al. [15] and no-touch isolation technique by Hirota et al. [16], and for
pancreaticojejunostomy as pair-watch suturing technique
[17]. 10
Surgical procedures of PD-SAR are similar to those of PD except for combined resection of SA and vein, and total gastrectomy and splenectomy if necessary. As shown in Figure 1(d) indicating arterial anatomy around the pancreas and cutting sites of artery, the blood supply of the remnant pancreas is provided by the short gastric arteries (SGA), LGEA, and PEA. At surgery, adequacy of blood supply of the pancreatic tale and spleen is confirmed by the presence of arterial bleeding from the cut surface of the remnant pancreas and by color change of the spleen. If the spleen color becomes dark, splenectomy is performed with carefully preserving LGEA. When the tumor additionally invades the LGA, we perform combined resection of LGA followed by total gastrectomy and splenectomy if curative-intent resection is possible. In such case, the blood supply of the remnant
pancreas is provided by PEA alone. 11
Figure 2(a) shows intraoperative findings after PD-SAR.
As of reconstruction procedures, end-to-side pancreaticoje-
junostomy is performed using the pair-watch suturing tech-
nique (PWST) [17], and hepaticojejunostomy is performed
by interrupted or continuous suture, followed by gastroje-
junostomy and Braun’s anastomosis (Figure 2(b)). The blood
supply of the remnant pancreas is clearly demonstrated on
SA
GDA
CHA
PV
SA
SMA SV
Rem P
(a)
SP
Rem P
(b)
SP Rem P
(c)
Rem P
(d)
Rem P
(e)
Figure 2: Intraoperative findings after PD-SAR (a) and schemas of reconstruction after PD-SAR and postoperative MDCT showing clear enhancement of the remnant pancreas (b)–(e). (b) and (c): schema of reconstruction after subtotal stomach preserving PD-SAR and postoperative MDCT. (d) and (e): schema of reconstruction after PD-SAR with total gastrectomy and splenectomy and postoperative MDCT.
PV: portal vein. SMA: superior mesenteric artery. SA: splenic artery. CHA: common hepatic artery. GDA: gastroduodenal artery. SV: splenic vein. Rem P: remnant pancreatic parenchyma. SP: spleen.
postoperative MDCT (Figure 2(c)). Figure 2(d) shows the schema of reconstruction after PD-SAR with total gastrec- tomy and splenectomy, and Figure 2(e) clearly demonstrates enhancement of the remnant pancreas on postoperative MDCT. When the pancreatic duct is too small to perform duct-to-mucosa pancreaticojejunostomy because the rem- nant pancreas becomes very small, we perform dunking pancreaticojejunostomy.
12
The arterial supply of the remnant pancreas after PD-SAR is demonstrated in Figure 3. MDCT (Figure 3(a)) and 3D CT angiography (Figure 3(b)) after subtotal stomach preserving PD-SAR show that SA is clearly enhanced from SGAs anastomosing with LGA. Pre- (Figure 3(c)) and postoperative MDCTs (Figure 3(d)) in PD-SAR with total gastrectomy and splenectomy demonstrate that SA and the remnant pancreas are enhanced probably via PEA. As of feeding artery for
PEA, our previous report demonstrated on postoperative angiography that the middle colic artery was the source of blood supply of PEA which fed SA [6].
2.2. Preoperative Characteristics, Surgical Outcomes, and
Pathological Findings. We compared various factors in the
patients between PD and PD-SAR, including (1) preoperative
characteristics such as gender, age, size of tumor before
treatment, International Union for Cancer Control (UICC)-T
factor, resectability according to National Comprehensive
Cancer Network guideline 2010 [18], cancer involvement of
major vessels, and treatment before surgery and preoperative
CA19-9 level, (2) surgical outcomes such as intraoperative
blood loss, operation time, combined resection of major
SA
SP
Rem P
(a)
LGA
SGA
SMA SA
(b)
SP SA
(c)
Rem P
SA
(d)
Figure 3: The arterial supply of the remnant pancreas after PD-SAR. MDCT (a) and 3D CT angiography (b) after subtotal stomach preserving PD-SAR showing SA clearly enhanced from SGAs anastomosing with LGA. Pre- (c) and postoperative MDCTs (d) in PD-SAR with total gastrectomy and splenectomy: SA and Rem P are enhanced even after PD-SAR with total gastrectomy and splenectomy, probably from PEA.
LGA: left gastric artery. SGA: short gastric artery. SMA: superior mesenteric artery. SA: splenic artery. SP: spleen. Rem P: remnant pancreas.
PEA: posterior epiploic artery.
vessel or other organ, type of pancreaticojejunostomy anas- tomosis, intraoperative blood transfusion, degree of postop- erative complications according to the Clavien-Dindo (C-D) classification [19], and duration of hospital stay (DHS), and (3) pathological findings of the resected specimen such as size of tumor, UICC-T factor, histological type, lymph node metastasis, degree of lymphatic invasion, venous invasion and intrapancreatic nerve invasion according to classification of pancreatic carcinoma of Japan Pancreatic Society [20], histological effect according to Evans’ grading system for chemoradiation treatment effect [21], and surgical margin status (R0, R1, and R2).
13
2.3. Postoperative Chemotherapy and Follow-Up. From 6 weeks after operation, we made arrangement to start the adjuvant chemotherapy, consisting of gemcitabine at a dose of 800 mg/m2 biweekly or S1 60 mg/m2/day for 4 weeks followed by 2-week break for at least 6 months. All patients were evaluated as follows: physical examination every month;
laboratory tests including CEA serum levels (normal <
5 ng/mL) and CA19-9 levels (normal < 37 U/mL) every 2 or 3 months; and MDCT every 3 months within 2 years, and thereafter every 6 months. All patients after PD, PD- SAR, and TP were given pancreatic enzyme, but the time of initiating and dosage of pancreatic enzyme supplemen- tation were determined by each surgeon. The pancreatic enzyme supplementation was performed by pancreatin of 6 to 12 g/day or pancrelipase of 1800 or 3600 mg/day. The time of initiating and type of diabetes mellitus (DM) treatment were determined by each surgeon or DM specialist.
2.4. Measurement of the Remnant Pancreatic Volume. We
measured the remnant pancreatic volume (RPV) by CT
volumetry at 1 and 6 months after pancreatectomy. Serial
transverse enhanced CT scan images were obtained at 1
and 1.25 mm interval. Each slice of the remnant pancreatic
parenchyma was traced, and the corresponding area was
(%) 100
80
60
40
20
0
0 12 24 36 48 60
MST 1 Y 2 Ys 3 Ys PD
PD-SAR 22.1 M 20.9 M
87.3 % 62.5 %
43.0 % 34.7 %
23.7 % 23.1 %
PD-SAR ( n = 18 )
PD ( n = 66 )
P = 0.538
(months) (a) Overall survival
(%)
100
80
60
40
20
0
0 12 24 36 48 60
MST 1 Y 2 Ys 3 Ys PD
PD-SAR
PD-SAR ( n = 18 )
PD ( n = 66 )
(months)
P = 0.652 13.1 M
14.8 M 60.6 % 50.8 %
30.0 % 21.8 %
20.5 % 10.9 %
(b) Recurrence-free survival
Figure 4: Comparisons of overall survival (OS) and recurrence-free survival (RFS) rates after pancreatectomy between PD and PD-SAR. (a) Overall survival. There were no significant differences in survival rates of two groups (𝑃 = 0.538). (b) Recurrence-free survival. There were no significant differences in survival rates of two groups (𝑃 = 0.652). MST: median survival time.
calculated as the sum of pancreatic tissue area. Splenic vein and dilated pancreatic duct (3 mm or more) were excluded.
2.5. Prediction of Postoperative Pancreatic Functions Using Several Markers. Because exact methods for evaluation of pancreatic endocrine and exocrine functions are expen- sive and labor intensive, and, furthermore, insulino-acinar- ductal-incretin gut hormonal axis influences endo- and exocrine functions each other, which in turn makes it 14
difficult to discriminate each other [22], there has been an increased need in clinical practice for a simple and widely available screening tool for detection of pancreatic functions.
Lindkvist et al. [23] reported significance of nutritional mark- ers such as albumin, prealbumin, magnesium, HbA1C, and cholesterol to predict the probability of pancreatic exocrine insufficiency. Furthermore, Yadav et al. [24] have recently suggested that decreased levels of serum amylase in type 2 DM are associated with decreased pancreatic function. To predict the remnant pancreatic functions in the present study, therefore, we examined type of DM treatment, total daily insulin dose, fasting blood sugar (FBS) level, HbA1c, serum amylase level, degree of body weight loss, serum albumin level, serum cholesterol level, and frequency of evacuation before and 1, 3, 6, and 12 months after pancreatectomy. In the present study, the patients were diagnosed as DM when either one of fasting blood sugar of 126 mg/dL or more or HbA1c of 6.5% or more was found or when DM treatment had been introduced preoperatively. As a control for PD and PD-SAR, we measured the same parameters in the 6 patients who underwent total pancreatectomy (TP) during
the study period: PD-SAR was converted to TP in 2 and remaining 4 underwent resection of the remnant pancreatic head due to tumor occurrence (PDAC in 2 and intraductal papillary mucinous adenocarcinoma in 2) in the pancreatic head after distal pancreatectomy for PDAC in 1 and for intraductal papillary mucinous neoplasm in 3. The reason why the number of TP was very small as a control group was because we had been avoiding TP as much as possible by aggressively employing the procedure of PD-SAR.
2.6. Glucagon Stimulation Test. Because the blood supply of the remnant pancreas become scarce after PD-SAR, it is crucial to determine whether islets cells are functional or not.
Oral glucose tolerance test (OGTT) provides a stimulus for the release of C-peptide from the islet cells which is equally as effective as intravenous glucagon injection test, that is, glucagon stimulation test (GST) [25]. OGTT after PD or PD-SAR is highly influenced by the types of gastrointestinal reconstruction, while GST is not. Therefore, GST was per- formed in the morning after an overnight fast: serum levels of C-peptide immunoreactivity (CPR) were measured in blood sample taken before (pre-CPR) and 10 minutes (post-CPR) after 1 mg of glucagon was intravenously injected. Δ CPR was calculated as (post-CPR-pre-CPR).
2.7. Statistical Analyses. All continuous values were presented as mean ± SD according to results of Fisher’s distribution.
Continuous variables were compared using Student’s 𝑡-test,
and categorical variables were compared using Pearson’s chi-
squared test.
(cm
3) 12
10
8
6
4
2
0 PD PD-SAR PD PD-SAR
At 1 month
∗
10.4
5.8
8.5
5.4
At 6 months (a) Remnant pancreas volume
(%)
70.0 60.0 50.0 40.0 30.0 20.0 10.0 0.0
22.7 16.7
6.0 26.3
19.3
7.0 20.4 10.2 10.2
15.7 9.4 6.3
7.4 3.7 3.7 Before 1 3 6 12
(months)
1 3 6 12
(months) PD
PD-SAR
27.8
22.2
5.6 62.6
∗50.0
∗45.5
∗56.3
6.3 35.7
14.3 36.4
9.1 33.3
22.2
11.1
Insulin therapy Oral agent therapy
operation Before
operation
(b) Type of DM treatment
Figure 5: Comparisons of remnant pancreas volume (a) and type of postoperative DM treatment (b) between PD and PD-SAR.
∗𝑃 < 0.05 versus PD.
In all patients, the date of the initial treatment was chosen as the starting point for the measurement of survival time.
Recurrence-free survival time was defined as the time from the date of initial treatment to the date of first relapse or death. Overall and recurrence-free survival were calculated using the Kaplan-Meier method and was compared between the groups using the log rank test. The day of final follow- up was January 31, 2014, and there was no loss of follow-up.
All statistical analyses were performed using SPSS version 21 (SPSS Inc., Chicago, IL) software. A 𝑃 value < 0.05 was considered as being statistically significant.
3. Result
3.1. Preoperative Characteristics. The patients’ background and preoperative clinical findings in the two groups are listed in Table 1. The mean size of tumor before treatment and the percentages of UICC-T4 and involvement of hepatic artery (HA), celiac artery (CeA), and splenic artery (SA) were markedly higher in PD-SAR than in PD, although the status of resectability according to NCCN guideline showed no difference between two groups. The rate of female was significantly higher in PD-SAR than in PD (𝑃 = 0.029), while there was no difference in the mean age of patients between two groups. Basically, our institutional policy to treat UICC-T3 and T4 PDAC patients, especially BR and UR, is to undergo CRT before surgery, as we previously reported [11, 12]. Among the total of 84 patients, we performed CRT before surgery in 75 patients (89.3%), chemotherapy alone in 4 (4.8%), and no treatment before surgery in 5 (5.9%). Among 18 patients with PD-SAR, 16 (88.9%) underwent preoperative
CRT, and the remaining 2 who did not receive CRT had multiple (two) tumors in the head and body, of which body tumor invaded SA. Between the two groups, however, there were no differences in the type of preoperative treatment.
Serum CA19-9 levels before and after preoperative treatment did not differ between the two groups.
3.2. Surgical Outcomes. Between PD and PD-SAR, there were no significant differences in surgical outcomes including blood loss, operation time, blood transfusion, degree of postoperative complications, and DHS, except for the rates of combined resection of SA and dunking pancreaticojejunos- tomy (Table 2).
3.3. Pathological Findings of Resected Specimen. As shown
in Table 3, pathological tumor size was larger in PD-SAR
than in PD, although there was no statistical difference in
the two groups (𝑃 = 0.098). Pathological T classification
did not differ between the two groups, although preoperative
T classification was significantly different. As of histological
effect of CRT, the incidence of grade IIb or more was higher
in PD than in PD-SAR: 27/59 (45.8%) versus 3/16 (18.8%)
(𝑃 = 0.083). The remaining factors such as UICC-stage, JPS-
stage, histological type, lymph node metastasis, degrees of
lymphatic, venous and intrapancreatic nerve invasions, and
status of surgical margin showed no significant differences
between the two groups. As of surgical margin, there were no
patients with pancreatic cut margin positive in both groups,
and the sites of R1 were unexceptionally dissected margins
around SMA and/or HA and/or CeA in both groups. The
causes of R2 in 2 cases with PD-SAR were macroscopic
(U ni ts/da y) 45 40 35 30 25 20 15 10 5 0
PD PD-SAR
TP
Before 1 M 3 M 6 M 12 M
(months) PD ( n ) PD-SAR ( n )
TP ( n ) 66 18 6
57 16 6
49 13 5
32 9 4
27 9 2
∗ #
#
#
1M 3M 6M12M
operation
Before operation
(a) Total daily insulin dose
PD PD-SAR
TP
1 M 3 M 6 M 12 M
(months) PD ( n ) PD-SAR ( n )
TP ( n )
1M 3M 6M12M
(m g/dL)
350 300 250 200 150 100 50
66 17 5
65 60 17 15 5 5
45 10 5
24 7 3
Before operation
Before operation
(b) Fasting blood sugar level
PD PD-SAR
TP
1 M 3 M 6 M 12 M
(months) PD ( n ) PD-SAR ( n )
TP ( n )
1M 3M6M12M
(%)
12 11 10 9 8 7 6 5 4
37 10 4
13 7 4
15 6 5
17 5 4
14 3 3
∗
Before operation
Before operation
(c) HbA1c level
PD PD-SAR
TP
1 M 3 M 6 M 12 M
(months) PD ( n ) PD-SAR ( n )
TP ( n )
1M 3M 6M 12M
250
200 150 100 50 0
(U/L)
41 6 5
43 8 4
40 8 3
31 10 3
17 5 1
Before operation
Before operation
(d) Serum amylase level
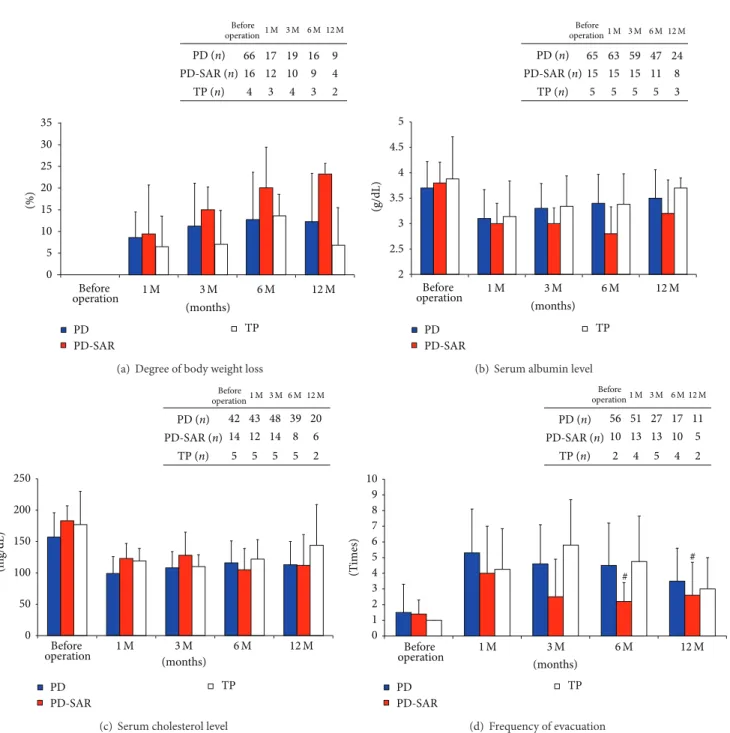
Figure 6: Markers for prediction of pancreatic functions before and after PD, PD-SAR, and TP.
∗𝑃 < 0.05 versus PD.
#𝑃 < 0.05 versus TP.
positive dissected margin around the common hepatic artery and solitary liver metastasis which was palliatively resected by partial hepatectomy, respectively. The cause of R2 in 1 case with PD was solitary liver metastasis which was palliatively resected by partial hepatectomy.
3.4. Overall Survival and Recurrence-Free Survival Rates.
Median survival time (MST) and overall survival rates (OS) were almost similar between PD and PD-SAR: MST: 22.1 months versus 20.9 months and 3-year OS: 23.7% versus 23.1% (𝑃 = 0.538). Recurrence-free MST and recurrence-free rates (RFS) were also similar between PD and PD-SAR: MST:
13.1 months versus 14.8 months and 3-year RFS: 20.5% versus 10.9% (𝑃 = 0.652).
3.5. Sites of Tumor Recurrence. Recurrence after operation occurred in 44 patients (66.7%) in PD and in 11 (68.8%) in PD-SAR, showing no significant difference. Although there were no significant differences in distant metastases between the two groups, the rate of local recurrence in the remnant pancreas was significantly higher in PD-SAR than in PD:
3/18 (18.8%) versus 2/66 (3.0%) (𝑃 = 0.030). The rate
of recurrence in the remnant pancreas alone showed no
(%) 35 30 25 20 15 10 5 0
PD PD-SAR
TP
1 M 3 M 6 M 12 M
(months) PD ( n ) PD-SAR ( n )
TP ( n ) 66 16 4
17 12 3
19 10 4
16 9 3
9 4 2
1M 3M 6M12M
Before operation
Before operation
(a) Degree of body weight loss
PD PD-SAR
TP
(g/dL)
1 M 3 M 6 M 12 M
(months) PD ( n ) PD-SAR ( n )
TP ( n ) 65 15 5
63 15 5
59 15 5
47 11 5
24 8 3
1M 3M 6M12M
5 4.5 4 3.5 3
2 2.5
Before operation
Before operation
(b) Serum albumin level
PD PD-SAR
TP
1 M 3 M 6 M 12 M
(months) PD ( n ) PD-SAR ( n )
TP ( n )
1M 3M 6M12M
250 200 150 100 50 0
(m g/dL)
42 14 5
43 12 5
48 14 5
39 8 5
20 6 2
Before operation
Before operation
(c) Serum cholesterol level
PD PD-SAR
TP
1 M 3 M 6 M 12 M
(months) PD ( n ) PD-SAR ( n )
TP ( n )
1M 3M 6M12M
56 10 2
51 13 4
27 13 5
17 10 4
11 5 2 10
9 8 7 6 5 4 3 2 1 0
(T imes)
#
#
Before operation
Before operation
(d) Frequency of evacuation
Figure 7: Nutritional markers for prediction of pancreatic functions and frequency of evacuation before and after PD, PD-SAR, and TP.
∗