Dynamics and sustainability of a tropical forest fragment surrounded by an urban sea: Findings from the Bukit Timah
Nature Reserve, Singapore
Kang Min NGO 2017
Acknowledgements
This three-year journey would not have begun without my mentor and teacher Dr Shawn Lum.
Thank you for recommending me for this study programme and for your support and
encouragement throughout my career. I am very grateful to my supervisor Dr Shinya Numata for accepting me as a student, and for tolerating my wilfulness and stubbornness at times. To my mentor Dr Tetsuro Hosaka for the helpful comments on all my work, and the interesting field trips.
To Ben Turner, thank you for all your help with soil analysis and comments on my manuscript.
Your speed in replying emails never fails to amaze me. To Stuart Davies, thank you for your patience in guiding me through the various manuscripts with your critical comments. I appreciate them very much. I thank the Asian Human Resource Fund and Tokyo Metropolitan University for awarding the scholarship to me.
I would like to thank past colleagues who helped in my field surveys – Nik, Fairoz, and the many temporary and part-time helpers – Holly, Grace, Axel, Trina, Anne, Kim, Evelyn, Henrietta, Wen Qing, Wei Ching, Wai Kit, Hui Ying, Thomas, Kelvin, Chin Yang, Ho Hin, Rayson, Kun Tat, Yi Lin, Yi Yong, Nicholas, and Denise. Thank you for the fun times spent in the forest. I also thank National Parks Board for granting permission to conduct field work in Bukit Timah.
To the fellow students in the department – Huda, Muna, Laili, Foo, Karn, Nabila, Nico, Truong, Ayaka, Ayana, Kinari, Ai, Kei and many others – thank you for the parties, sports, and fun times in Japan. To my friends, Irene, Yee Wei, Jieying, Yue Ying, Mindy, and many others, thank you for your encouragement and company through the ups and downs, especially the downs. Finally, I thank my family for allowing me to embark on this journey.
Table of Contents
CHAPTER 1 – INTRODUCTION ... 4
1.1TROPICAL FORESTS, THE THREATS THEY FACE AND THEIR IMPORTANCE TO HUMANS ... 4
1.2TROPICAL FORESTS IN SINGAPORE ... 6
1.3PURPOSE AND ORGANISATION OF THESIS ... 9
CHAPTER 2 – RESEARCH FIELD SITE AND METHODS ... 11
2.1BUKIT TIMAH NATURE RESERVE ... 11
2.2PLOT SET-UP AND TREE SURVEYS ... 12
2.3FIGURES ... 14
CHAPTER 3 – RESILIENCE OF THE BUKIT TIMAH PRIMARY FOREST TO FRAGMENTATION ... 15
3.1INTRODUCTION ... 15
3.2METHODS ... 18
3.2.1 Study site ... 18
3.2.2 Field data collection ... 19
3.2.3 Data analysis ... 19
3.3RESULTS ... 21
3.3.1 Stand structure and dynamics ... 21
3.3.2 Floristic composition and dynamics ... 21
3.3.3 Demography ... 22
3.4DISCUSSION ... 23
3.5CONCLUSION ... 28
3.6TABLES AND FIGURES ... 29
CHAPTER 4 – RECOVERY AND TREE DYNAMICS OF THE BUKIT TIMAH SECONDARY FOREST ... 37
4.1INTRODUCTION ... 37
4.2METHODS ... 41
4.2.1 Field data collection ... 41
4.2.2 Soil sampling, ion exchange, and chemical analyses ... 42
4.2.3 Data analysis ... 43
4.3RESULTS ... 43
4.3.1 Plot-level dynamics ... 43
4.3.2 Dynamics of species types ... 44
4.3.3 Distance from primary forest ... 44
4.3.4 Dynamics of dominant species ... 45
4.3.5 Species shared between primary and secondary forests ... 45
4.3.6 Soil nutrients and ion exchange ... 46
4.4DISCUSSION ... 46
4.5TABLE AND FIGURES ... 52
CHAPTER 5 – GROWTH RATES OF TREES IN PRIMARY AND SECONDARY FORESTS OF BUKIT TIMAH ... 60
5.1INTRODUCTION ... 60
5.2METHODS ... 63
5.3RESULTS ... 64
5.3.1 Rainfall patterns ... 64
5.3.2 Tree growth rates ... 65
5.3.3 Tree growth rates before mortality ... 65
5.2.4 Relationship between tree growth and rainfall ... 65
5.4DISCUSSION ... 66
5.5TABLES AND FIGURES ... 69
CHAPTER 6 – GENERAL DISCUSSION AND CONCLUSIONS ... 75
6.1GENERAL SUMMARY ... 75
6.2BUKIT TIMAH AND NATURE RESERVES IN SINGAPORE’S SOCIETY ... 77
6.3CONCLUSION ... 81
REFERENCES ... 83
Chapter 1 – Introduction
1.1 Tropical forests, the threats they face and their importance to humans
Tropical forests are important resources to humans and an essential component of Earth’s terrestrial ecosystems. Although they cover only about 10% of Earth’s land area, they harbour 50–70% of Earth’s biodiversity (Lewis 2006). Among the tangible goods that tropical forests provide to
humans include timber, as well as many other non-timber products such as rattan and fruits. Forests also provide numerous intangible ecosystem services, such as rainwater interception and
purification, climate regulation and carbon sequestration (Costanza et al. 1997; Ehrlich and Mooney 1983).
Tropical forests are changing rapidly from global and local anthropogenic influences that alter their capacity to provide ecosystem services. Global influences include climate change, global warming and nutrient deposition caused by human burning of fossil fuels (Townsend et al. 1996;
Wuebbles and Jain 2001), while local influences include forest fragmentation, hunting of animals, and the introduction of invasive species (Wright 2005). There is still considerable variability and sometimes conflicting results from some studies concerning the responses of tropical forests to climate variations, both between and within regions. For example, trees in the Amazon forest were observed to have increased growth rates averaged over three decades (Lewis et al. 2004a), while trees in a Panamanian forest and Malaysian forest had decreasing growth rates (Feeley et al. 2007).
Another study used satellite images of the Amazon to show that the forest became greener during the 2005 drought (Saleska et al. 2007), but a subsequent re-analysis showed that this did not happen (Samanta et al. 2010). Nevertheless, some global trends in changes to forests have been detected.
Allen et al. (2010) found that some forests were experiencing higher-than-normal tree mortality
and death due to hydraulic failure. Climate models also predict that tropical forests will mitigate global warming through evaporative cooling and carbon sequestration (Bonan 2008), but tend to produce net carbon release into the atmosphere during warm and dry El Niño years, and are susceptible to burning during land clearing (Randerson et al. 2005) due to drier conditions (Malcolm 1998). An additional point to note is that events that occur in one region can affect another region far away, highlighting the global nature of these environmental problems. For example, a simulation model predicted significant changes in rainfall in temperate zones that would have been caused by widespread deforestation in the tropics (Avissar and Werth 2005).
As global climate changes, it is now recognised that society needs to adapt to these changes, and forests have an important role to play here. The relationship between adaptation and forests can occur at two levels – first, by forests adapting to climate change, and second, by forests playing a role in the adaptation of society (Locatelli et al. 2010). The first role is a work-in-progress of monitoring the state of forests as the climate changes. The second role is performed by forests via the ecosystem services mentioned above, which reduce social vulnerability (Locatelli et al. 2010).
However, pressures from a burgeoning world population has increased the demand for agricultural goods and led to reductions in forest area (DeFries et al. 2010; FAO 2006; Foley et al. 2007).
Tropical forest loss was 7 million ha from 2000 to 2010 (FAO 2016), including pristine forests (FAO 2006). This poses a large threat to wildlife (Gibson et al. 2011), but more importantly their loss decreases the amount of ecosystem services that humans receive, such as buffering against extreme weather events.
Besides the physical, climatic and biodiversity values that tropical forests provide, many of these forests, often found in reserves and nature parks, also bring economic benefits in the form of tourist receipts. A study found that foreign visitors to forest reserves in Costa Rica valued them
higher than what they actually paid (Menkhaus and Lober 1996), while conservation of a rainforest reserve in Sumatra was found to generate higher net values than removal of the forest, one of the reasons being tourism (van Beukering et al. 2003). Tropical forests are important destinations for nature-based tourism, ecotourism and wildlife tourism and this hinges on sustainable development of the destination to ensure minimal environmental degradation and maintain economic value (Prideaux 2014).
1.2 Tropical forests in Singapore
Among tropical countries, Singapore has experienced one of the greatest losses of primary rainforest. Before British colonisation in 1819, the main island was almost fully forested, but the development of Singapore as a port meant that forest had to be cleared for building infrastructure.
The early residents also cleared much land for crops such as pepper, gambier, and rubber (Corlett 2013). By the 1990, forest cover in Singapore had been reduced to 4.6% (Kong and Yeoh 1996).
The areas that were left untouched were either not profitable to harvest due to steep topography, or were located in the protected water catchments. Currently, about 20% of Singapore is covered in forest, and only 0.16% is primary rainforest (Yee et al. 2011).
The first forest reserves in Singapore in the 1890s consisted of mostly mangroves and some inland forests, although these eventually gave way to agriculture and development (Corlett 1995).
Large areas of forests were cleared at various points of time for timber and cash crops. These early years under colonial government saw forests as a resource for only economic gains and other utilitarian needs, as evidenced by the 1894 Annual Report of the Forest Department about the remaining forests in Singapore, “their utility as a source of revenue was subordinated to their climatic and hygenic uses” (Corlett 1995). It was not until 1951 when forests were protected under legislation by the Nature Reserves Act, “for the purposes of propagation, protection and
preservation of the indigenous fauna and flora of Singapore and for the preservation of objects and places of arsthetic, historical or scientific interest” (Corlett 1995). However, the years following independence also saw much urbanisation and further loss of forests and swamps (Wong 1989, from Kong and Yeoh 1996).
The impetus to conserve forests for the sake of its biodiversity, aesthetic and health values only began after Singapore had attained economic success and social stability. Singapore ratified the Convention on Biological Diversity (CBD) in 1995 (U.N. 2017), and launched a National Biodiversity and Strategy and Action Plan for Singapore in 2009 (NParks 2009). The Nature Reserves Act had been renamed the Parks and Trees Act, and lists four functions of nature parks and reserves (Law Revision Commission 2006):
1. The propagation, protection and conservation of the trees, plants, animals and other organisms of Singapore, whether indigenous or otherwise;
2. The study, research and preservation of objects and places of aesthetic, historical or scientific interest;
3. The study, research and dissemination of knowledge in botany, horticulture, biotechnology, or natural and local history; and
4. Recreational and educational use by the public.
Singapore has often been touted as an ecological ‘worst-case scenario’ (Koh and Sodhi 2004;
Sodhi et al. 2004). The huge areas of forest loss caused local extinctions of plants and many animal groups, especially large mammals and birds (Sodhi et al. 2004). Despite these losses, the remaining flora and fauna are still surprisingly high in diversity, with >2000 species of vascular plants, 57 mammal species, 98 reptile species, 25 amphibian species, 355 bird species and >282 butterfly species (NParks 2009). Tree diversity in Bukit Timah Nature Reserve, a primary rainforest in
Singapore, has survived and persisted (Ngo et al. 2016). A mammal, reptile and amphibian survey from 1993 to 1997 in the nature reserves of Singapore found that the Bukit Timah reserve, only 164-ha in size, harboured the highest number of species for all the three animal groups (Teo and Rajathurai 1997), even though other reserves were bigger and continuous with one another.
Besides being biodiversity havens, the remaining forests in Singapore provide other benefits and ecosystem services that parallel those of rural forests in other countries, and their proximity to the city provides even more benefits. They play an important role in reducing the urban heat island (UHI) effect (Solecki et al. 2005), thereby reducing electricity costs and carbon emissions spent on cooling (Akbari 2002; Brack 2002). Forests cool the environment with their shade and when they transpire (Pataki et al. 2011), a process of water loss from leaves during photosynthesis. A study done on the physical environment inside and around the Bukit Timah Nature Reserve showed that temperatures within the forest were 3 degrees cooler than the forest buffer and 7 degrees cooler than the forest exterior (Chatterjea 2014). Similar results of warmer built areas and cooler forests were also found in various parts of Singapore (Chow and Roth 2006). Although the extent of forest cooling effect has not been well-studied in Singapore, Upmanis et al. (1998) found that the cooling effect of a Swedish urban park extended more than 1 km. Forests in urban areas help filter and clean surface water in cities (Dudley and Stolton 2003). In Singapore, an assessment of water quality from two urban watersheds, one containing ca. 25% forest, the other predominantly residential, found that the watershed with forest produced water with higher quality (Chui 1997). Forests help to store and sequester carbon, and trees are often the only significant carbon sinks in cities (NEA 2016a). A study on carbon stocks in Bukit Timah Nature Reserve found that the primary forests store a comparable amount of carbon per unit area as other primary forests in the region (Ngo et al.
2013), highlighting their important role as carbon sinks in the city.
In the early 1990s, Singapore sought to use its forest reserves as tourist attractions, after they had been exhausted of their tangible income sources such as timber (Kong and Yeoh 1996).
Singapore was marketed as “one of only two cities in the world to have a genuine rainforest” (The Straits Times, 16 Aug 1991). The Singapore Tourism Board included the theme “Nature Trail”
among a list of 11 in its Tourism 21 strategy (STPB, 1995, from Henderson 2000) that could be used to promote tourism in the 21st century, and had plans to expand the marketing of Singapore’s natural heritage (Kong and Yeoh 1996). Given the multiple functions that forests in Singapore perform, maintaining their integrity over time is important, not only for their economic benefits, but also for the perpetuation of biodiversity and aesthetic values.
Although the government recognises the importance of forest reserves, land scarcity remains the largest constraint during land use planning. By 1991, 10% of the total area of Singapore was reclaimed (Glaser 1991), and above ground and belowground spaces were planned and used in such a way that every piece of public land was used effectively (Lui and Tan 2001). Nature reserves are no exception, serving multiple roles of biodiversity conservation, recreation, and nature education.
1.3 Purpose and organisation of thesis
As mentioned in 1.1, tropical forests can help in the mitigation and adaptation of climate change. In 1.2 the spotlight was on Singapore, a high-urbanised tropical country that has lost >99% of its original forests. To what extent and in what condition will the remaining forests survive in the future and continue to provide their numerous ecosystem services to the residents of Singapore?
This thesis aims to answer this question by examining the ecology of a forest reserve in Singapore – the Bukit Timah Nature Reserve. The thesis is arranged as follows. Chapter 2 describes the field and study site and the general methods used. Chapter 3 looks at the primary forest in Bukit Timah from a fragmentation perspective, asking whether the primary forest has degenerated over a period
of 19 years. Chapter 4 examines recovery of an old secondary forest over a period of eight years.
Chapter 5 is about tracking short-term growth rates in both primary and secondary forests over seven years and correlating them with weather observations. Chapter 6 is a summary and conclusion of all the previous chapters.
Chapter 2 – Research field site and methods
2.1 Bukit Timah Nature Reserve
The reserve is 164-ha in area, and includes the 164 m hill, Bukit Timah, Singapore’s highest natural point. The hill was left forested by the British for “climatic” reasons as a cooling retreat (Sharp and Lum 1996), and it currently has Singapore’s largest remaining patch of primary forest (48-ha; Ngo et al. 2016). In 2011, Bukit Timah was designated an ASEAN Heritage Park (ASEAN Centre for Biodiversity 2017).
At 1°17’24.97” N 103°51’7.05” E, Singapore has a tropical climate with abundant rainfall and high uniform temperatures all year round. There are two monsoon seasons in a year, each lasting several months, separated by two inter-monsoonal periods, also lasting several months (NEA 2016b), but these are not considered distinct seasons like in other parts of the tropics. El-Niño and La Niña, weather events that occur once every few years, influence Singapore’s weather by altering rainfall patterns and creating the inter-year variation in rainfall (NEA 2017a).
Soils in the tropics are generally very deep and acidic (Bardgett 2005). Soils in primary forest of Bukit Timah were found to be very acidic, with pH 3.5 – 3.8 at 0 – 5 cm depth, similar to other hill dipterocarp forests (Chandler 1985; Grubb et al. 1994). Soil nutrient levels were low, but were even lower in the Bukit Timah secondary forest, especially nitrogen and phosphorus (Grubb et al. 1994). Nutrient levels are typically low because of leaching from the high rainfall, and any available nutrients would be rapidly taken up by vegetation or soil microbes.
Bukit Timah was one of the first forests to be protected by law in the country since the
continued to be rampant, and two granite quarries at the western edge of Bukit Timah also encroached the forest until the mid 20th century (Corlett 1988; Corlett 1995). From 81-ha in the 1990s (Corlett 1995), the reserve expanded in later years to incorporate some of the connecting secondary forests and scrubland from the surrounding areas to the current area of 164-ha.
Bukit Timah still contains remarkable biodiversity despite the massive forest loss and continued human impacts. Although many mammal and bird species have gone locally extinct (Lim 1997; Sodhi et al. 2004), other taxa, such as flowering plants (Ngo et al. 2016; Turner et al. 1994) and pteridophytes (Wee 1995), are still surprisingly diverse. Small birds, such as the Greater Racket-Tailed Drongo (Dicrurus paradiseus), Crimson Sunbird (Aethopyga siparaja), Common Emerald Dove (Chalcophaps indica) (Lim 1997; pers. obs.), and small mammals such as the Plantain Squirrel (Callosciurus notatus singapurensis) and Long-tailed Macaque (Macaca
fascicularis fascicularis) (Sha et al. 2009; Teo and Rajathurai 1997) are abundant in Bukit Timah.
2.2 Plot set-up and tree surveys
Data were collected from two 2-ha (200 m × 100 m) long-term monitoring plots in Bukit Timah – one in primary and one in secondary forest. The two plots lie within 20 m of each other with no physical barriers between them (Fig. 2.1). A public walking trail runs through the long side of the primary forest plot and also cuts through a corner of the secondary forest plot. Part of the trail near the start of the secondary forest plot once marked the boundary of the Bukit Timah Forest Reserve, the forerunner of today’s Nature Reserve. PVC pipes were planted into the ground at 5 m intervals to mark out the plot subquadrats.
The diameters of trees within the plots were measured at 1.3 m height (diameter at-breast- height; dbh), but only trees that were ≥1 cm dbh were recorded, identified to species whenever
possible, tagged with unique numbers, and mapped within the plot. The primary forest plot was set up in 1993, and trees in the plot were measured in 1993, 1995, 2003, 2008 and 2012. The secondary forest plot was set up in 2004, and the trees were measured in 2004, 2008 and 2012. A total of 12687 trees were surveyed in the primary forest plot in 1993, while 3051 trees were surveyed in the secondary forest plot in 2004.
2.3 Figures
Figure 2.1. Map of Bukit Timah Nature Reserve (164-ha) and its position within Singapore (inset). The positions of the two 2-ha plots are also shown.
Chapter 3 – Resilience of the Bukit Timah primary forest to fragmentation
3.1 Introduction
Tropical forests are important habitats for biodiversity, and are also large carbon reserves. Tropical forests are rapidly being cleared for various uses such as plantations (FAO 2001; Achard et al.
2002), or degraded. Vast tracts of tropical forest have now been reduced to forest fragments (Skole and Tucker 1993), and fragments are different from the original forest in many ways.
Forest fragments typically experience species loss (Turner 1996; Fahrig 2003). Species richness is generally lower in smaller fragments (Hill and Curran 2003; Castelleta et al. 2005;
Cagnolo et al. 2006), and some fragments experience rapid invasion by exotic species (Dislich and Pivello 2002). Forest fragments tend to be influenced by altered environmental conditions near their edges (Murcia 1995; Malcolm 1998). Forest edges experience increased light levels, which
promotes the rapid growth of pioneer species (Laurance et al. 2006a) and the decline of shade- tolerant or primary forest species (Cramer et al. 2007; Michalski et al. 2007). Edge effects seem to characterize most forest fragments (Tabarelli et al. 2008). Experimental fragments created in the Amazon showed that fragments experience higher turnover rates than continuous forests, i.e.
fragments are ‘hyper-dynamic’ (Laurance et al. 1998, 2002, 2006b, 2017; Mesquita et al. 1999).
Large trees in fragments have also been reported to have higher mortality rates (Laurance et al.
2000; Arroyo-Rodriguez and Mandujano 2006; Oliveira et al. 2008), leading to loss of stand biomass (Laurance et al. 1997; Nascimento and Laurance 2004; Pütz et al. 2011).
Not all fragments suffer the same level of degradation-related changes. Some fragments experience increases in shade-tolerant species (Werneck and Franceschinelli 2004; Higuchi et al.
(Cayuela et al. 2006, Sánchez-Gallen et al. 2010). Small forest fragments in Mexico contained high tree species richness (Arroyo-Rodríguez et al. 2008), making small fragments potentially valuable for conservation. Within South-east Asia (SEA), Slik et al. (2011) observed limited edge effects in an old growth tropical forest in Borneo, despite it being adjacent to a burnt forest for seven years. In Peninsular Malaysia, fragments were found to be structurally similar to primary forest, and had few pioneer species (Thomas 2004).
In researching factors that contribute to the resistance of forest fragments to degradation, Thomas (2004) found that a range of traits such as relative density in primary forest, dispersal mode, and low photosynthetic capacity correlated well with persistence in Malaysia. Species that are
common in the landscape would have a higher chance of remaining when that landscape becomes fragmented (Thomas 2004). Ballistically-dispersed primary forest species were found in higher proportions in fragments than in primary forest (Thomas 2004). This could result from the fact that loss of animal dispersers from fragments does not affect ballistically-dispersed species, while some animal-dispersed species become disadvantaged (Cordeiro and Howe 2001, 2003). Wind and gyration dispersal is a typical dispersal strategy of old growth canopy trees (e.g., Dipterocarpaceae) in many South-east Asian forests (Corlett 1997; Lee et al. 2002; Davies et al. 2003), unlike other tropical regions where it is usually associated with a pioneer strategy (Slik et al. 2011). In Borneo, the canopy structure of old growth forests is tall and relatively open, possibly making these forests more resilient to edge effects (Slik et al. 2011).
Forests in Singapore have undergone a major transformation since the early 1800s (Corlett 2013; LaFrankie et al. 2005). Less than 0.2% of the original primary forest remains, with secondary forest now covering about 20% of the island (Yee et al. 2011). The largest remaining patch of primary forest, found in Bukit Timah Nature Reserve, is surrounded by secondary forest, where the
original forest used to be exposed to various disturbances, such as timber extraction and agriculture (Corlett 1988, 2011). Large vertebrates, e.g., tigers, have been extirpated from the island (Sodhi et al. 2004). Despite the high number of large vertebrate extinctions in Singapore, some of the surviving small vertebrate fauna are thriving, mainly in the ca. 3000-ha forest mosaic in the centre of the mainland. For example, there are abundant populations of long-tailed macaques, Macaca fascicularis Raffles (Lucas and Corlett 1998; Sha et al. 2009; Riley et al. 2015), and plantain squirrels, Callosciurus notatus Boddaert (Corlett 1995). A floristic survey of a small forest fragment (4-ha) in Singapore found that 228 plant species had gone extinct, and 174 previously unrecorded species recruited, within a century at the site (Turner et al. 1996). The new records, 94 native and 80 non-native species, constituted about 44% of total species richness during the later inventory (Turner et al. 1996). However, given that the exact sampling locations of the old collections (dating back to the 1890s) could possibly have come from a bigger area before it was reduced to its current size, the floristic changes may not be the result of ‘fragmentation effects’
alone (Fahrig 2003). In primary forest at Bukit Timah, plant diversity has remained relatively intact (Corlett 1995). Corlett (1988) suggested the possibility of a delayed ‘collapse’ of the plant
community, and a consequent opening up of the forest and decline in mesic habitat-dependent species.
The impacts of forest fragmentation on the stand dynamics of a permanent forest plot in Bukit Timah from five censuses, spanning 19 years, were investigated. The findings from this study were compared with the structure and dynamics of similar lowland primary forests elsewhere in South-east Asia. Based on findings from other forest fragmentation studies (e.g., Laurance et al.
2006a, 2006b), I hypothesized that: (1) pioneer species would become dominant, and continue to dominate due to altered disturbance dynamics; (2) shade-tolerant primary forest species would decline; (3) the number of large-statured trees would decrease, leading to a decline in basal area; (4)
zoochorous species would decline due to the loss of animal dispersers; and, (5) population turnover rates would be high owing to disturbances associated with the fragment edges.
3.2 Methods
3.2.1 Study site
Bukit Timah Nature Reserve (hereafter Bukit Timah) is a 164-ha forest reserve in central Singapore (LaFrankie et al. 2005). Soils of Bukit Timah are nutrient-poor Typic Paleudults of the Rengam series formed on Bukit Timah Granite (Ives, 1977). The forest is coastal hill dipterocarp forest, with a core unlogged area of 48-ha (MS Khoo and S Lum, unpubl. data), dominated by Shorea curtisii Dyer ex King, a dipterocarp species usually found at higher elevations in Peninsular Malaysia (Symington et al. 2004). This primary forest is surrounded by two abandoned granite quarries to the west and south, and secondary forest of different successional stages to the east. The secondary forest colonised agricultural land abandoned in the 1950s (Chua et al. 2013). The northern section of the Reserve is dominated by the exotic African Tulip tree (Spathodea campanulata), which established following cattle pasture abandonment in the 1970s. A detailed account of the history of Bukit Timah can be found in Corlett (1988, 1995).
The climate is aseasonal, with a wetter period from November to December and a drier period from May to July. Weather data were taken from the nearest weather station with long-term rainfall and temperature records, 8.5 km northwest of Bukit Timah. Mean annual rainfall between 1980 and 2012 was 2688 mm with all months receiving more than 150 mm on average; average daily temperature was 27.0 °C. There have been significant increases in both mean annual rainfall (augmented Dickey-Fuller [ADF] test statistic = -3.51; P = 0.059; 1980-2012) and mean minimum
census period, two years (1997 and 2009) had annual rainfall more than 1 SD lower than the long- term mean, while four years (1995, 2003, 2007 and 2011) had annual rainfall more than 1 SD greater than the long-term mean.
3.2.2 Field data collection
A 2-ha (200 m × 100 m) plot was established in 1993 by the Centre for Tropical Forest Science (CTFS) within the unlogged primary forest (Figure 3.2) following standard CTFS methods (Manokaran et al. 1990; Condit 1998), where all trees ≥1 cm diameter at breast height (dbh) were measured to the nearest 1 mm, tagged, mapped and identified to species. The plot is located within 10 m of a historical forest boundary. The secondary forest immediately outside of the plot used to be crop plantations, and these were abandoned by 1962 and left to regenerate naturally (Chua et al.
2013). A full description of the plot can be found in LaFrankie et al. (2005). The plot was re- censused in 1995, 2003, 2008 and 2012.
3.2.3 Data analysis
Trees were split into three dbh classes, 1.0 – 1.9 cm, 2.0 – 9.9 cm, and ≥ 10.0 cm for stem
abundance and mortality analyses. Kolmogorov-Smirnov tests were used to test for differences in tree size distributions among censuses. Adult stature of species with ≥10 individuals in 2012 (158 species) were classified into three stature classes – understorey (1.0–19.9 cm dbh), canopy (20.0–
49.9 cm dbh) and emergent (≥50.0 cm dbh), by taking the mean of the second, third and fourth largest individuals of each species. Where adult trees of known canopy or emergent species were not present in the plot, species were assigned to the correct adult stature using Whitmore and Ng (1972–1989). Dispersal modes of species were classified as biotic or abiotic. Differences in species abundance changes were tested between the three adult stature classes using ANOVA, and between the two dispersal modes using t-test.
Mortality was calculated as (ln (n1) – ln (S2))/t, and recruitment as (ln (n2) – ln (S2))/t, where t is the census interval, n1 and n2 are the population sizes at census 1 and census 2 respectively, and S2 is the number of survivors at census 2. Mortality and recruitment were corrected for differing census intervals using λcorr = λ × t0.08, where λ is mortality or recruitment rate, and t is census interval in years (Lewis et al. 2004b). This correction reduces the bias that arises during
comparisons of mortality and recruitment rates from non-homogenous populations when census intervals differ (Lewis et al. 2004b). In order to take spatial autocorrelation into account, 99.9%
confidence intervals (CIs) for mortality and recruitment rates were calculated from 1000 bootstraps of 50 20 m × 20 m squares. This is because spatial autocorrelation generates CIs that are more narrow than they would be if the data were spatially independent (Legendre 1993), therefore non- overlapping CIs at 99.9% level would most likely represent real differences in the mean. Changes in mortality and recruitment between intervals were tested with repeated measures analysis of variance, using 20 m × 20 m squares as sampling units.
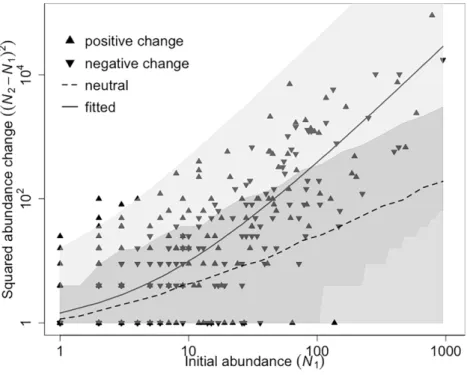
To test whether abundances of individual species were increasing or decreasing more than expected given the plot-wide changes, the method developed in Chisholm et al. (2014) was used.
This method compares observed changes in the abundance of species against abundance change estimated from a neutral model that includes only demographic variance. By plotting squared species abundance changes versus initial abundance, both species that increased and decreased more than expected given the overall plot-wide changes in abundance were identified.
All tree dynamics analyses were carried out using functions from the CTFS R Package (http://ctfs.si.edu/Public/CTFSRPackage/).
3.3 Results
3.3.1 Stand structure and dynamics
In 1993, stem density was 6344 ha-1 and basal area was 36.5 m2 ha-1 in the 2-ha plot at Bukit Timah (Table 3.1). Over the entire 19 years there were no significant differences in stem density or basal area. However, decreases in stem density and basal area were observed in censuses immediately following the two drought years, 1997 and 2009. Changes in total basal area largely followed the same pattern as stem density, where decreases coincided with both drought-affected intervals, and increases followed in wetter periods. Basal area fell to the lowest level in 2012 after the second drought.
Although there were no significant changes in total stem density, there were significant differences in tree size distribution between consecutive census intervals, as well as between the first and last census (P < 0.01; Kolmogorov-Smirnov test). The first census in 1993 had the highest number of 1.0–1.9 cm trees and lowest number of trees ≥2.0 cm (Table 3.1). Subsequent
recruitment into the ≥2.0 cm size classes caused stem abundances of these size classes to increase.
3.3.2 Floristic composition and dynamics
A total of 338 species were recorded in the plot in 1993 (Table 3.1). The 10 most abundant species were all primary forest species − two emergent, six canopy, and two understorey species (Table 3.2).
These species represented nine different families. There were no exotic individuals ≥1.0 cm dbh in the plot.
Pioneer trees made up 3.8-4.6% of all stems among the five censuses (Table 3.1), and none of the pioneer species were common. Fourteen pioneer species were recorded in the plot, with
Archidendron contortum, Pternandra echinata and Timonius wallichianus being the most common.
Among saplings 1.0-1.9 cm dbh, there were 53 pioneer trees from four species in 1993, and this increased to 59 trees from 11 species in 2012. Pioneer saplings made up only 0.8% and 1.1% of all saplings in 1993 and 2012 respectively.
Of the 158 species with ≥10 individuals, 18 were emergent, 62 were canopy, and 78 were understory species. One hundred and forty-one species were biotically and 17 species were
abiotically-dispersed. There were no significant differences in percentage species abundance change (1993 to 2012) between the three adult statures (F(2,155) = 0.97, P = 0.38; ANOVA) and the two dispersal modes (t = -0.53, P = 0.60; t-test).
Floristic composition changed significantly over the 19 years. The abundance of 86 species changed more than expected under a neutral model of demographic change (Figure 3.3); 58 species increased and 28 species decreased more than expected. Of the 10 most abundant species, four had significant decreases in abundance over the 19 years, three increased significantly, and the
abundance of three species did not differ from neutral expectations (Table 3.2). Streblus elongatus (Moraceae) and Shorea curtisii (Dipterocarpaceae) had 39% and 20% increases in abundance respectively, with Streblus becoming the most abundant species in the plot in 2012. In contrast, Santiria apiculata (Burseraceae), Gluta wallichii (Anacardiaceae) and Gynotroches axillaris (Rhizophoraceae) had declines in abundance of 14%, 23%, and 34% respectively.
3.3.3 Demography
Plot-wide mortality over 19 years was 3.3% year-1 with significant variation among census intervals (F3,147 = 3.635, P = 0.014; repeated measures ANOVA). Pairwise t-tests showed that annual
mortality was significantly higher in the last census interval (2008-2012) than the 2003-2008
interval (P = 0.022). Although there were no significant changes in mortality ratewhen trees were split into size classes, the mortality rate of large trees tended to mirror the drought intervals (Table 3.3).
Annual recruitment into the ≥1.0 cm dbh size class varied significantly among census intervals (F3,147 = 19.08, P < 0.001; repeated measures ANOVA), and fluctuated even more than mortality (Table 3.3). Recruitment rates were significantly lower in the two census intervals that experienced drought.
3.4 Discussion
Despite a long history of fragmentation and isolation, the patch of primary rain forest at Bukit Timah shows no evidence of ‘collapse’ or dramatic transformation that might be attributed to fragmentation (Fahrig 2003; Kupfer et al. 2006; Laurance et al. 2011). Stand structure, basal area and the abundance of large trees were similar to those in primary forests in Malaysia (Table 3.4) and did not change significantly through the 19 years of monitoring (Hypothesis 3). The most common species in the plot were all typical shade-tolerant primary forest species, and none of them were pioneer or exotic species (Hypotheses 1 and 2). The proportion of pioneer species in the plot was similar to that found in Pasoh, a Malaysian primary forest (Davies et al. 2003), and there was no significant increase in pioneer species during the study (Condit et al. 1999). The proportion of biotically-dispersed trees did not decline through time (Hypothesis 4), and was similar to other intact forests in the region (Seidler and Plotkin 2006; Harrison et al. 2013). Although population turnover was relatively high compared to Malaysian forests (Table 3.5; Hypothesis 5), the Bukit Timah forest exhibits considerable resistance to the effects of being extremely isolated and surrounded by human activities.
The low numbers of pioneer species in the Bukit Timah forest was unusual compared to other forest fragments. Even though pioneer species were found in gaps in Bukit Timah, and were also present in other forested parts of Singapore, they were not increasing in numbers in the plot.
Pioneer trees that were <20.0 cm dbh consistently made up ≥88% of all pioneer trees, evidence that the existing pioneers were not remnants of a more degraded forest. The number of pioneer species decreased after the two droughts, suggesting that pioneer species also responded to drought stress like other species. In a Panamanian forest, the abundance of pioneers also declined more often than shade-tolerant species over a 13-year period that included a run of dry years and long dry seasons (Condit et al. 1996a). In a Bornean forest, the predominantly pioneer genus, Macaranga, had very high mortality after the 1997 drought, but also high seedling recruitment caused by the increased canopy openness (Slik 2004). Pioneer seedlings from a Bolivian forest had traits that maximised above-ground light capture and efficient root extension for below-ground resource capture (Markesteijn and Poorter 2009), but the high resource demand of pioneers may also predispose them to drought mortality (Reich 2014).
Abundance changes of biotically-dispsersed species did not differ from that of abiotically- dispersed species. In Amazonian fragments, old-growth taxa that declined in abundance tended to be sub-canopy trees that were animal-dispersed and had obligate outbreeding systems (Laurance et al. 2006b). A study made in a Bornean rainforest found that the extirpation of all animals with a body mass >1 kg increased stem density and decreased the species diversity of saplings (Harrison et al. 2013). Such trends were not found in Bukit Timah. The large population of macaques (Sha et al.
2009) and small rodents may have acted as seed dispersers even for large seeds (Lucas and Corlett 1998; Brewer and Rejmánek 1999), while fulfilling their usual role as seed predators. There are no immediate threats to these animals, except for the trapping of macaques in areas surrounding the reserve (Sha et al. 2009). Fourteen percent (206 individuals) of the total macaque population was
removed in 2007 (Sha et al. 2009), but this does not seem to have had much effect on their role as seed dispersers.
The abundance of 86 tree species in the Bukit Timah plot changed more than expected by chance over the 19-year study. There were no obvious patterns in the characteristics of species that increased and decreased in abundance. Both the increasing group and decreasing group had a mix of canopy, emergent and understorey species, as well as primary forest and pioneer species. On the 50- ha plot at BCI in Panama, species varied in their response to an intense El Niño-associated drought event (Condit et al. 1996b). At least 16 species of shrubs and small trees affiliated with moist habitats declined close to extinction within the plot, and drought-tolerant species increased in abundance (Feeley et al. 2011). Results from another forest in Costa Rica monitored for 20 years showed that deciduous, compound-leaved canopy species increased in abundance at the expense of evergreen, simple-leaved understory species (Enquist and Enquist 2011). These changes were attributed to increasingly dry years as well as longer and stronger dry seasons (Condit et al. 1996a;
Enquist and Enquist 2011). These patterns were absent at Bukit Timah, despite the occurrence of two droughts over 19 years. In a lowland primary forest in Sabah, Malaysia, Newbery and Lingenfelder (2004) also found mixed responses of the 19 most abundant species to an intense drought, similar to our findings at Bukit Timah. Given the contrasting responses of species despite similarities in life history, examining their functional traits and drought tolerances may help to explain their differential abundance changes.
Seven of the 10 most abundant species on the plot had significant changes in abundance throughout the 19 years – four had decreases and three had increases. Six of these seven species were canopy and emergent species, while one was an understorey species. Of the declining species, only Gynotroches axillaris had very low recruitment (0.6%) over the 19 years. The other declining
species, Santiria apiculata, Gluta wallichii, and Calophyllum ferrugineum, had average to higher- than-average recruitment rates but mortality always exceeded recruitment. The most abundant species in 2012, Streblus elongatus, had large increases in trees <10.0 cm dbh, predominantly due to low mortality of these trees. Starkly different outcomes were also observed in two emergent species, S. curtisii and G. wallichii. Both species had similar starting abundances (426 for S. curtisii and 435 for G. wallichii), and both are abiotically-dispersed, but S. curtisii had 177 more
individuals than G. wallichii after 19 years. Interestingly, C. ferrugineum, which was found to have proliferated in the Botanic Gardens Jungle fragment in Singapore (Turner et al. 1996), experienced a 17.5% reduction in Bukit Timah (10th rank in plot). In a lowland forest in Sabah, Malaysia, Dacryodes rostrata had greatly elevated mortality after an intense drought (Newbery and
Lingenfelder 2004), while abundance change of this species in Bukit Timah (4th rank in plot) was not different from the neutral expectation. Future on-site or common garden eco-physiological experiments could help elucidate whether these differences in abundance change might be related to differential levels of drought tolerance among the common species.
Overall tree turnover in the plot was higher than values observed in forests from other tropical Asian sites in Malaysia and Sri Lanka (Manokaran and Swaine 1994; Condit et al. 2006).
Mortality rates were 1-2% above the rates recorded in lowland and hill forests in South-east Asia (Table 3.5). Is this a result of fragmentation, or is it a characteristic of coastal hill forests? In a Bornean old growth forest, creation of a forest edge by fire did not lead to large changes in species composition and light conditions, but mortality of larger trees increased towards the forest edge (Slik et al. 2011). High turnover in fragments is usually a result of edge effects, where trees experience increased wind-throw in Amazonia and microclimatic changes (Laurance et al. 1998).
Mean annual tree turnover has been found to correlate positively with species richness in tropical forests (Phillips et al. 1994). However, Bukit Timah (Fisher’s alpha = 67.3) has lower tree diversity
than Pasoh (Fisher’s alpha = 125.8; Davies et al. 2003), Malaysia, so species richness is unlikely to be the explanation for elevated turnover rates at Bukit Timah. Given the lack of evidence for edge effects, a possible reason for the higher turnover rates is that Bukit Timah, being a hill emerging from the lowlands, is exposed to higher light levels and wind, and therefore higher turnover rates might have been inherent.
Turnover rates fluctuated among censuses in this study in relation to the timing of drought events. Even in undisturbed forests, turnover rates change over time. Long-term inventory data showed that tree turnover has been increasing across Neotropical tropical forests (Phillips 1996;
Lewis et al. 2004a), possibly due to an increase in resource availability such as CO2 (Lewis et al.
2004a). Mortality rates increased significantly after severe droughts in Amazonian, Panamanian and Bornean primary rainforests (Condit et al. 1995; Nakagawa et al. 2000; Slik 2004; Phillips et al.
2009). There was a significant increase in overall mortality rate at Bukit Timah after the 2009 drought, but not after the 1997 drought. However, recruitment rates decreased significantly during both droughts. This, together with the stand structure of Bukit Timah, suggests that the forest is more susceptible to drought stress than to fragmentation effects. Nonetheless, effects of
fragmentation could interact with and exacerbate drought effects through cumulative stresses, such as forest desiccation and fire occurrence (Cochrane and Laurance 2008; Briant et al. 2010). For example, tree turnover and liana abundance in Amazonian forest interior increased over a 32-year period, with the magnitude of these changes being higher at fragment edges, and this was attributed to the synergistic effects of fragmentation and large-scale environmental drivers (Laurance et al.
2014).
Our results show that small forest fragments can retain high tree diversity and resilience against fragmentation effects. This is the first published long-term study of a tropical forest
fragment, even though other short-term studies have also recorded fragment resilience (e.g. Cayuela et al. 2006; Arroyo-Rodríguez et al. 2008). Although the preservation of large areas of forest is still the best scenario for biodiversity conservation, fragments should not be overlooked for their
biodiversity potential. As large areas of forest in the region are removed (Miettinen et al. 2011), even in protected areas (Curran et al. 2004), the conservation of the hundreds of thousands of forest fragments must be a priority for local governments and NGOs.
3.5 Conclusion
Observed changes in Bukit Timah seem to be driven by the effects of climatic fluctuations at
decadal time scales, rather than a directional degradation of the forest associated with fragmentation.
Despite the long-term anthropogenic disturbances that Bukit Timah has been exposed to, the tree flora still holds considerable diversity. The 10 most abundant trees in Bukit Timah were primary forest species, and the number of pioneer species and individuals were low. Many species had varying abundance changes despite similarities in adult statures and dispersal modes. Species abundance change of biotically-dispersed species were not lower than those of abiotically-dispersed species, suggesting that the faunal species loss did not adversely affect recruitment of these species.
Tree mortality and recruitment rates were higher than other comparable tropical Asian rainforests, but the contribution of fragmentation effects to this observation is uncertain. Turnover rates also fluctuated over time and showed evidence of response to the two drought events. Our results from 19 years of monitoring did not indicate that Bukit Timah had or was undergoing systematic degradation. However, given the high turnover rates and drought-related responses observed in Bukit Timah, changes in climate patterns, such as an increased frequency and intensity of dry periods, could have a stronger impact on this fragment compared to intact forests.
3.6 Tables and figures
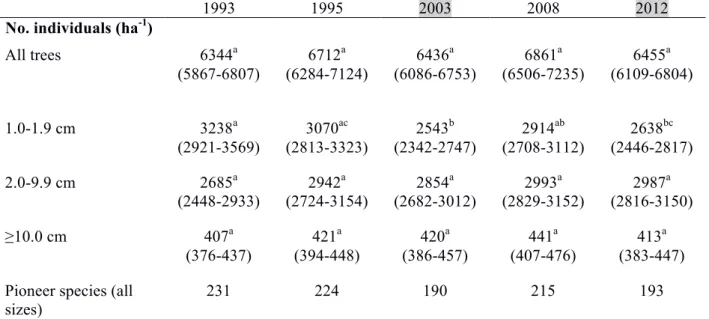
Table 3.1. Summary of stand dynamics of the 2-ha primary forest plot. Figures in parentheses represent 95% confidence intervals calculated from 1000 bootstrap samples over 20×20m squares. Figures with the same superscript letters have overlapping confidence intervals. Broken trees were not included in the size classes. Censuses immediately following the 1997 and 2009 drought years are highlighted.
1993 1995 2003 2008 2012
No. individuals (ha-1)
All trees 6344a
(5867-6807)
6712a (6284-7124)
6436a (6086-6753)
6861a (6506-7235)
6455a (6109-6804)
1.0-1.9 cm 3238a
(2921-3569)
3070ac (2813-3323)
2543b (2342-2747)
2914ab (2708-3112)
2638bc (2446-2817)
2.0-9.9 cm 2685a
(2448-2933)
2942a (2724-3154)
2854a (2682-3012)
2993a (2829-3152)
2987a (2816-3150)
≥10.0 cm 407a
(376-437)
421a (394-448)
420a (386-457)
441a (407-476)
413a (383-447) Pioneer species (all
sizes) 231 224 190 215 193
No. species
All trees 338 345 345 351 354
‘Extinct’ from plot 2 10 11 6
‘New’ recruits in the
plot 9 10 17 9
Pioneer species 11 12 11 12 12
Basal area (m2.ha-1)
All trees 36.5
(32.0-41.5)
37.2 (33.0-41.4)
35.1 (30.8-39.8)
36.6 (32.0-41.1)
30.4 (26.4-34.7)
Pioneer species 1.5 1.4 1.1 1.0 0.9
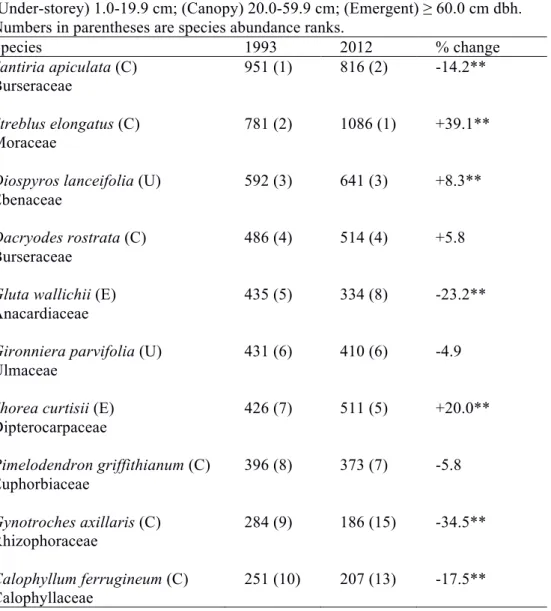
Table 3.2. Abundance changes of the 10 most common species in Bukit Timah.
Species with abundance changes significantly greater than neutral model expectations are indicated by **. The letter codes are adult stature classes:
(Under-storey) 1.0-19.9 cm; (Canopy) 20.0-59.9 cm; (Emergent) ≥ 60.0 cm dbh.
Numbers in parentheses are species abundance ranks.
Species 1993 2012 % change
Santiria apiculata (C) 951 (1) 816 (2) -14.2**
Burseraceae
Streblus elongatus (C) 781 (2) 1086 (1) +39.1**
Moraceae
Diospyros lanceifolia (U) 592 (3) 641 (3) +8.3**
Ebenaceae
Dacryodes rostrata (C) 486 (4) 514 (4) +5.8 Burseraceae
Gluta wallichii (E) 435 (5) 334 (8) -23.2**
Anacardiaceae
Gironniera parvifolia (U) 431 (6) 410 (6) -4.9 Ulmaceae
Shorea curtisii (E) 426 (7) 511 (5) +20.0**
Dipterocarpaceae
Pimelodendron griffithianum (C) 396 (8) 373 (7) -5.8 Euphorbiaceae
Gynotroches axillaris (C) 284 (9) 186 (15) -34.5**
Rhizophoraceae
Calophyllum ferrugineum (C) 251 (10) 207 (13) -17.5**
Calophyllaceae
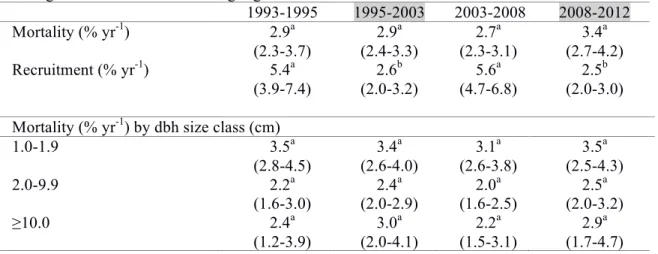
Table 3.3. Annual mortality and recruitment rates during census intervals. Values in parentheses indicate 99.9% confidence intervals from 1000 bootstrap samples of 20×20m squares. Figures with the same superscript letters have overlapping confidence intervals.
Drought-affected intervals are highlighted.
1993-1995 1995-2003 2003-2008 2008-2012 Mortality (% yr-1) 2.9a
(2.3-3.7)
2.9a (2.4-3.3)
2.7a (2.3-3.1)
3.4a (2.7-4.2) Recruitment (% yr-1) 5.4a
(3.9-7.4)
2.6b (2.0-3.2)
5.6a (4.7-6.8)
2.5b (2.0-3.0) Mortality (% yr-1) by dbh size class (cm)
1.0-1.9 3.5a
(2.8-4.5)
3.4a (2.6-4.0)
3.1a (2.6-3.8)
3.5a (2.5-4.3)
2.0-9.9 2.2a
(1.6-3.0)
2.4a (2.0-2.9)
2.0a (1.6-2.5)
2.5a (2.0-3.2)
≥10.0 2.4a
(1.2-3.9)
3.0a (2.0-4.1)
2.2a (1.5-3.1)
2.9a (1.7-4.7)
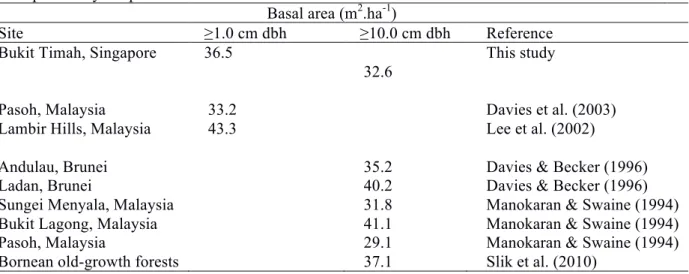
Table 3.4. Comparison of basal area with other tropical Asian forest sites. Figures are averages of multiple surveys or plots if available.
Basal area (m2.ha-1)
Site ≥1.0 cm dbh ≥10.0 cm dbh Reference
Bukit Timah, Singapore 36.5 This study
32.6
Pasoh, Malaysia 33.2 Davies et al. (2003)
Lambir Hills, Malaysia 43.3 Lee et al. (2002)
Andulau, Brunei 35.2 Davies & Becker (1996)
Ladan, Brunei 40.2 Davies & Becker (1996)
Sungei Menyala, Malaysia 31.8 Manokaran & Swaine (1994)
Bukit Lagong, Malaysia 41.1 Manokaran & Swaine (1994)
Pasoh, Malaysia 29.1 Manokaran & Swaine (1994)
Bornean old-growth forests 37.1 Slik et al. (2010)
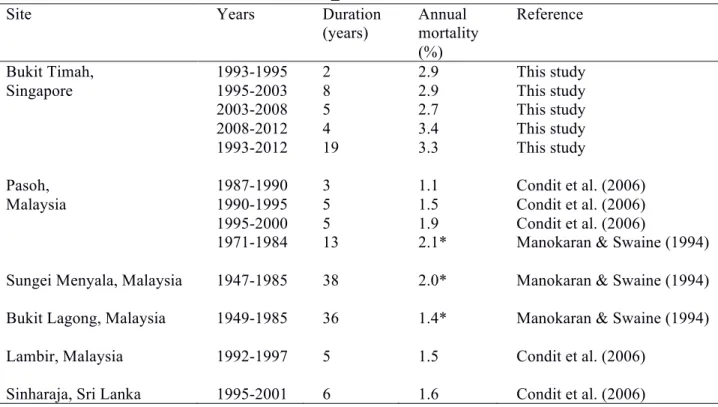
Table 3.5. Comparison of mortality rates from other tropical Asian forest sites. Only papers using the same calculation methods were included. *Trees ≥10cm dbh.
Site Years Duration
(years)
Annual mortality (%)
Reference
Bukit Timah, 1993-1995 2 2.9 This study
Singapore 1995-2003 8 2.9 This study
2003-2008 5 2.7 This study
2008-2012 4 3.4 This study
1993-2012 19 3.3 This study
Pasoh, 1987-1990 3 1.1 Condit et al. (2006)
Malaysia 1990-1995 5 1.5 Condit et al. (2006)
1995-2000 5 1.9 Condit et al. (2006)
1971-1984 13 2.1* Manokaran & Swaine (1994) Sungei Menyala, Malaysia 1947-1985 38 2.0* Manokaran & Swaine (1994) Bukit Lagong, Malaysia 1949-1985 36 1.4* Manokaran & Swaine (1994)
Lambir, Malaysia 1992-1997 5 1.5 Condit et al. (2006)
Sinharaja, Sri Lanka 1995-2001 6 1.6 Condit et al. (2006)
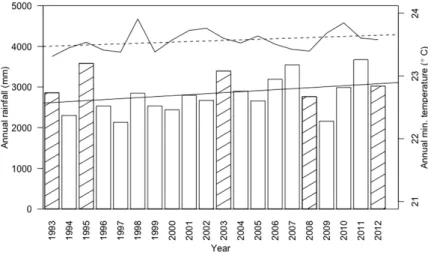
Figure 3.1. Annual rainfall (bars) and mean minimum annual temperature from a weather station 8.5 km northwest of Bukit Timah. Hatched bars represent census years. Solid and dashed straight lines represent the linear fits of annual rainfall and annual minimum temperature respectively. There were significant increases in both mean annual rainfall (augmented Dickey-Fuller [ADF] test statistic = -3.51; p = 0.059; 1980-2012) and mean minimum annual temperature (ADF test statistic = -2.72; p = 0.297; 1985-2012). Two drought (1997, 2009) and four ‘wet’ (1995, 2003, 2007, 2011) years occurred during the 19-year census period, when annual rainfall fell below and above 1 SD of mean rainfall respectively.
Figure 3.2. Map of Bukit Timah Nature Reserve (164-ha) showing the position of the 2-ha plot within the reserve.
Figure 3.3. Squared abundance changes in Bukit Timah over 19 years plotted against initial abundance. Each point represents one species. The dashed line with shaded dark gray 95%
confidence interval shows the neutral model prediction. The black curve with shaded light gray 95% confidence interval shows the fitted model. Species whose abundances did not change ((N2−N1)2 = 0) are not shown on the log axes (48 species).
Chapter 4 – Recovery and tree dynamics of the Bukit Timah secondary forest
4.1 Introduction
Half of tropical forests in the world are secondary (ITTO 2002), and this proportion continues to increase as primary forests are being converted to pastures or agricultural land (Gibbs et al. 2010) and subsequently abandoned (Lang & Knight 1983; Nepstad et al. 1996; Rivera & Aide 1998).
Although Brown & Lugo (1990) stated that secondary forests more than 60–80 years old were
“often indistinguishable from primary forests”, there is increasing evidence that these old secondary forests require an even longer time for species composition and forest structure to recover to levels resembling primary forest (Brearley et al. 2004; Chua et al. 2013; Riswan et al. 1985; Turner et al.
1997).
Secondary forest succession has been theorised to follow four phases (Oliver 1981). The first phase usually involves the rapid growth of herbaceous plants and colonising trees, also known as pioneer species. These trees are able to create a closed canopy layer within 5-10 years after land abandonment (Chazdon 2008). The next phase brings about forest structure development, as the pioneer trees grow further in diameter and height, thereby reducing the amount of light reaching the understorey. This in turn reduces the density of light-demanding herbaceous plants and the
seedlings of pioneer species (Capers et al. 2005), and favours the establishment of shade-tolerant species. This phase usually occurs 10-20 years after abandonment (Chazdon 2008), and is
succeeded by the third phase, also called the “understorey reinitiation stage” (Oliver 1981). This phase, occurring over decades to centuries, involves the establishment and growth of old-growth species in the understorey (Denslow and Guzman 2000, Guariguata et al. 1997) and a gradual
replacement of pioneer canopy trees with old-growth species (Chazdon 2008). The last phase, the
“old-growth stage”, is one of relatively stable composition (Peet 1992), containing a mix of canopy species that were not present during early succession (Chazdon 2008), and should have the greatest resemblance to old-growth forests in terms of forest structure and species composition.
Compared to studies that examined early tropical forest secondary succession (e.g. Ewel et al. 1983; Guariguata et al. 1997; Kammesheidt 1999; Nepstad et al. 1996; Rivera and Aide 1998), fewer studies have been done on older secondary forests (≥ 50 years; Brearley et al. 2004; Chua et al. 2013; Lang and Knight 1983; Saldarriaga et al. 1988). Secondary forests ≥ 50 years old usually already have a tree canopy, and are very likely to be in the understorey reinitiation stage. Forest structural variables of old secondary forests, such as basal area and stem density, were similar to or approaching those found in old-growth forests (Brearley et al. 2004; DeWalt et al. 2003). However, tree species composition in old secondary forests was often found to differ significantly from old- growth forests (Chazdon 2003; Finegan 1996; Guariguata and Ostertag 2001). Despite these differences, secondary forests often harbor high animal diversity, sometimes even in young secondary forests (Castro-Luna et al. 2007; DeVries et al. 1997; Heinen 1992; Raman et al. 1998;
Vasconcelos 1999), highlighting their importance for biodiversity conservation.
Besides changes to aboveground vegetation, secondary forest soils also often undergo changes in nutrient levels. Soil carbon (C) and nitrogen (N) usually escape the ecosystem temporarily after forest removal (Detwiler 1986; Houghton et al. 1991) via combustion and decomposition, while the levels of other nutrients like potassium, calcium and phosphorus vary depending on land use history and time elapsed since abandonment (Allen 1985; Certini 2005; Eden et al. 1991; McNabb et al. 1997). These changes are reversible if the forest is allowed to recover (da S. Martins et al. 1991; Reiners et al. 1994), or if disturbances are not repetitive over short periods of
time (Davidson et al. 2007; Don et al. 2011). The recovery of soil to pre-disturbance levels depends on the forest type, soil type, and land use, but once plants start growing in abandoned land, soil recovery processes also begin through plant-soil interactions (Guariguata and Ostertag 2001).
Being Southeast Asia’s country with the highest per capita gross domestic product (World Bank 2016), Singapore has, not surprisingly, lost much of its forests, both primary and secondary growth, to urban development. Beginning in the early 19th century, forest cover has dwindled to its current 22.6% of total land area, much of it being young secondary forest (Yee et al. 2011). Old secondary forests cover only 1.37% of total land area, and surround the small primary forest fragments remaining in Singapore (0.16%; Yee et al. 2011). Both primary and old secondary forests are currently located in protected nature reserves (Law Revision Commission 2006). Even after a century of natural recovery, the tree communities in these old secondary forests differed significantly from primary forests in species richness and composition (Turner et al. 1997).
However, Turner et al. (1997) only observed trees greater than 30 cm girth at breast height, or 9.5 cm diameter at breast height (dbh), excluding the sapling size classes which are indicators of future forest composition. A study comparing adjacent primary and secondary forests in Singapore also found that adult tree composition differed significantly, but saplings (≤3 cm dbh) were floristically more similar to primary forest with increasing proximity to primary forest (Chua et al. 2013). Other studies done in Bolivia and Costa Rica also found that sapling communities were more similar between secondary and primary forests than adult trees (Guariguata et al. 1997; Peña-Claros 2003).
These observations concur with the understory reinitiation stage of forest recovery, where one of the predictions is that primary forest species will recruit into the younger size classes as the pioneer trees mature (Oliver 1981).