water
Communication
Dissolved and Particulate Organic Matter Dynamics Relative to Sediment Resuspension Induced by the Tidal Cycle in Macrotidal Estuaries, Kyushu, Japan
Hiroyuki Takasu
1,2,* , Koji Uchino
3and Koichiro Mori
31
Faculty of Environmental Science, Nagasaki University, 1-14 Bunkyo-machi, Nagasaki 852-8521, Japan
2
Division of Marine Energy Utilization, Organization for Marine Science and Technology, Nagasaki University, 1-14 Bunkyo-machi, Nagasaki 852-8521, Japan
3
Graduate School of Fisheries and Environmental Sciences, Nagasaki University, 1-14 Bunkyo-machi, Nagasaki 852-8521, Japan; [email protected] (K.U.); [email protected] (K.M.)
* Correspondence: [email protected]; Tel.: +81-95-819-2752
Received: 31 July 2020; Accepted: 12 September 2020; Published: 13 September 2020
Abstract: The tide-induced resuspension of sediments plays important roles in the efflux of particulate organic carbon (POC) from rivers to the coastal sea. Although dissolved organic carbon (DOC) comprises more than half of the riverine flux of organic carbon to the ocean, the influence of sediment resuspension induced by the tidal cycle on DOC dynamics is largely unknown. This study examined the dynamics of POC, particulate organic nitrogen (PON), DOC, humic-like and protein-like fluorescent dissolved organic matter (DOM) in relation to the tidal cycle in the Chikugo and Hayatsue River Estuaries, Kyushu, Japan. This study is the first to show both the particulate organic matter (POM) and DOM dynamics in relation to the tidal cycle in the macrotidal estuaries. We found that the turbidity changed with the tidal cycle and that there were significant positive correlations of turbidity with POC and PON in the Chikugo River mouth, suggesting that tide-induced sediment resuspension supplied POM to the water column. The DOC concentration, humic-like and protein-like fluorescent DOM were not correlated with turbidity but were negatively correlated with salinity.
These results suggest that POM efflux, but not DOM efflux, can be accelerated by tide-induced sediment resuspension in the macrotidal estuaries.
Keywords: riverine organic matter; dissolved organic matter; tidal cycle; sediment resuspension;
Ariake Sea; Chikugo River
1. Introduction
Estuaries, as transition zones between terrestrial and marine environments, are the most dynamic regions in the biosphere [1]. The tidal cycle may strongly affect organic matter dynamics, especially in macrotidal estuaries (tidal range > 4 m). A strong tidal current suspends sediments, which provide high concentrations of particulate organic carbon (POC) [2,3]. A previous study reported that a part of POC in the tidal-influenced turbidity water mass was bioavailable [4]. Thus, the tide-induced resuspension of sediments may play important roles in the efflux of labile POC from rivers to the coastal sea. Allochthonously input organic carbon fuels both pelagic and benthic food webs [5,6], whereas an excessive input of labile organic carbon often causes environmental problems, such as hypoxia, in coastal ecosystems [7]. Coastal hypoxia has been a global phenomenon since the late 1950s, as it causes the deterioration of marine ecosystems [8]. Thus, understanding the mechanisms controlling riverine organic matter delivery to the ocean is essential to maintain healthy coastal ecosystems.
Although dissolved organic carbon (DOC) comprises more than half of the riverine flux of organic carbon to the ocean [9] and a part of riverine DOC is highly bioavailable [10,11], the influence of sediment
Water2020,12, 2561; doi:10.3390/w12092561 www.mdpi.com/journal/water
Water2020,12, 2561 2 of 10
resuspension induced by the tidal cycle on DOC dynamics is largely unknown. One study reported the infusion of DOC in the water column via active sediment resuspension [12]. In addition, high DOC concentrations in pore water were found in estuarine sediments [13]. The rapid production of DOC from particle decomposition in near-surface bottom sediments was also reported [14]. These processes may affect DOC dynamics via the active resuspension induced by tidal currents in macrotidal estuaries.
The Chikugo River, in Kyushu, southwestern Japan, is the largest river discharging into the Ariake Sea. Most riverine materials move from the Chikugo River to the northern part of the Ariake Sea, a semienclosed embayment with the largest tidal range in Japan. The Chikugo River Estuary is classified as a macrotidal estuary with tidal amplitudes of up to 5 m at its mouth. The Ariake Sea receives large amounts of organic carbon from the Chikugo River [15]. Recently, severe bottom-water hypoxia has occurred every summer in the northern part of the Ariake Sea, resulting in a marked ecosystem deterioration [16]. Thus, an understanding of the mechanisms supplying organic matter from the Chikugo River estuary is essential to prevent hypoxia in the northern part of the Ariake Sea.
Suzuki et al. [17] reported that a strong tidal current in a macrotidal estuary can result in a high POC concentration due to active sediment resuspension. Thus, the tidal current can accelerate a high POC outflow from the river into the northern part of the Ariake Sea. Although the importance of DOC as a potential driver of hypoxia in the northern part of the Ariake Sea is recognized [18], the influence of tide-induced sediment resuspension on DOC efflux from the Chikugo River is not known. Therefore, we examined the temporal variations in both POC and DOC concentrations in relation to the tidal cycle in the Chikugo River Estuary to understand the influence of tide-induced sediment resuspension on POC and DOC efflux from the estuary to the northern part of the Ariake Sea. Stable carbon isotope ratios of POC were measured to understand the source of particulate organic matter (POM). Humic substances make up one of the most refractory organic groups in seawater, whereas protein (amino acids) is one of the most labile organic groups in seawater [19]. Thus, humic-like and protein-like fluorescent dissolved organic matter (DOM), based on the fluorescence excitation-emission matrix (EEM), was also measured to understand the influence of tide-induced sediment resuspension on labile DOM efflux.
2. Materials and Methods
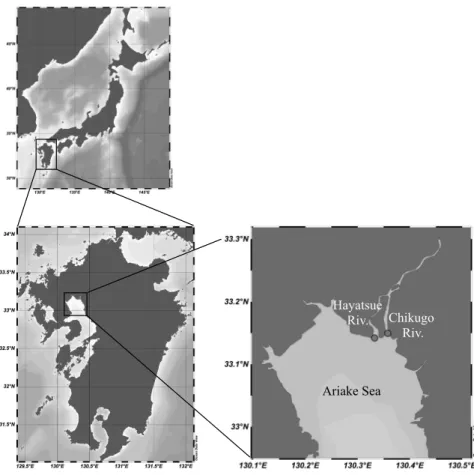
We conducted investigations in late June (early summer) because severe hypoxia occurs in the summer in the northern part of the Ariake Sea. In order to avoid extreme cases, samplings were performed midway through the lunar tidal cycle before the rainy season (July). One can expect that, in the river mouth, the near-bottom current, which is strong enough to facilitate resuspension of sediments, will be observable during a tidal cycle. Thus, water samples were collected at fixed stations in the Chikugo and Hayatsue (a branch of the Chikugo River) River mouths (Figure 1) from 6:00 (low tide) to 18:00 (low tide) on 22 and 23 June 2019 (middle tide). The sediment characteristics of the two river mouths were similar (e.g., mud content, >74%; total organic carbon content, approx. 18 mg g
−1dw) [20]. The current velocity and direction were measured continuously using an electromagnetic current meter (INFINITY-EM, JFE Alec, Kobe, Japan; sampling interval 0.1 s) at a 1 m depth. The salinity and turbidity were measured at the surface and 1 m above the bottom using a multiparameter water quality meter (WQC-24; DKK-TOA, Tokyo, Japan) at 90-minute intervals. Seawater samples were collected using a 3 L Van Dorn water sampler (RIGO, Tokyo, Japan) from the surface and 1 m above the bottom at each station at 90-minute intervals.
Samples for chlorophyll a (Chl. a) and POC analyses were filtered on board using precombusted
0.7- µ m GF/F filters (General Electric Company, Coventry, UK), and the filters were stored at − 20
◦C
until further analysis. Samples for the DOM analysis were filtered on board using precombusted
0.7-µm GF/F filters (General Electric Company) and were stored in acid-washed 125-mL high-density
polyethylene bottles at − 20
◦C until further analysis. Plastic gloves were worn during the sample
collection and processing to avoid contamination.
Water 2020, 12, x FOR PEER REVIEW 3 of 10
Figure 1. The study area and sampling locations.
To determine the Chl. a concentration, the samples collected on GF/F filters were extracted with N,N-dimethylformamide and analyzed by fluorometry (FP-8100; JASCO, Tokyo, Japan), according to the method of Welschmeyer [21]. To determine the POC and particulate organic nitrogen (PON) concentrations, and the stable carbon isotope ratios of POC, the samples collected on GF/F filters were fumed with HCl to remove carbonate salts, neutralized and dried in a desiccator, and were then analyzed using an elemental analyzer equipped with a stable isotope ratio mass spectrometer (Flash 2000/Conflo IV/DELTA V Advantage, ThermoFisher Scientific, Bremen, Gremany). Samples and standards were individually wrapped in tin foil (Tin foil Squares, Säntis Analytical AG, Teufen, Switzerland) before analysis. Stable isotope ratios are described as a per mil (‰) deviation from the international standard, using the following equation: δX = [(R
sample/R
standard) − 1] × 1000, where X and R represent the
13C and
13C/
12C ratio, respectively. Peedee Belemnite and DL-alanine were used as the reference materials. The DOC concentrations were determined using a total carbon analyzer (TOC-V; Shimadzu, Kyoto, Japan). A calibration curve was obtained by analyzing four distinct concentrations of a standard solution prepared from potassium hydrogen phthalate. As a procedural blank, ultrapure water (Milli-Q, Direct-Q UV3; Merck Millipore, MA, USA) was analyzed every 10 samples, and the average pooled peak area of the Milli-Q water analysis over the entire day was subtracted from the seawater sample peak areas.
Excitation (Ex)/emission (Em) matrices of fluorescence were measured for DOC samples using a fluorometer (FP-8100; JASCO, Tokyo, Japan). Bandwidths were set to 5 nm for excitation and 5 nm for emission. A series of emission scans (200−500 nm) were collected over excitation wavelengths ranging from 200−500 nm by 5 nm increments. To remove the Rayleigh scatter and the Raman signal, a Rayleigh- and Raman-normalized Milli-Q Ex-Em matrix was subtracted from the sample data. The fluorescent intensities were normalized with the quinine sulfate units (QSU), where 1 QSU is equivalent to the fluorescence emission at an Ex/Em = 350/450 nm wavelength of 1 µg L
−1quinine sulfate in a 0.1 M H
2SO
4solution. According to [22], the peaks from Ex/Em = 220/290 nm and Ex/Em
= 240/420 nm were determined as protein-like and humic-like components, respectively.
Chikugo Riv.
Hayatsue Riv.
Ariake Sea
Figure 1. The study area and sampling locations.
To determine the Chl. a concentration, the samples collected on GF/F filters were extracted with N,N-dimethylformamide and analyzed by fluorometry (FP-8100; JASCO, Tokyo, Japan), according to the method of Welschmeyer [21]. To determine the POC and particulate organic nitrogen (PON) concentrations, and the stable carbon isotope ratios of POC, the samples collected on GF/F filters were fumed with HCl to remove carbonate salts, neutralized and dried in a desiccator, and were then analyzed using an elemental analyzer equipped with a stable isotope ratio mass spectrometer (Flash 2000/Conflo IV/DELTA V Advantage, ThermoFisher Scientific, Bremen, Gremany). Samples and standards were individually wrapped in tin foil (Tin foil Squares, Säntis Analytical AG, Teufen, Switzerland) before analysis. Stable isotope ratios are described as a per mil (%) deviation from the international standard, using the following equation: δ X = [(R
sample/R
standard) − 1] × 1000, where X and R represent the
13C and
13C/
12C ratio, respectively. Peedee Belemnite and DL-alanine were used as the reference materials. The DOC concentrations were determined using a total carbon analyzer (TOC-V; Shimadzu, Kyoto, Japan). A calibration curve was obtained by analyzing four distinct concentrations of a standard solution prepared from potassium hydrogen phthalate. As a procedural blank, ultrapure water (Milli-Q, Direct-Q UV3; Merck Millipore, MA, USA) was analyzed every 10 samples, and the average pooled peak area of the Milli-Q water analysis over the entire day was subtracted from the seawater sample peak areas.
Excitation (Ex)/emission (Em) matrices of fluorescence were measured for DOC samples using a
fluorometer (FP-8100; JASCO, Tokyo, Japan). Bandwidths were set to 5 nm for excitation and 5 nm for
emission. A series of emission scans (200 − 500 nm) were collected over excitation wavelengths ranging
from 200 − 500 nm by 5 nm increments. To remove the Rayleigh scatter and the Raman signal, a Rayleigh-
and Raman-normalized Milli-Q Ex-Em matrix was subtracted from the sample data. The fluorescent
intensities were normalized with the quinine sulfate units (QSU), where 1 QSU is equivalent to the
fluorescence emission at an Ex/Em = 350/450 nm wavelength of 1 µ g L
−1quinine sulfate in a 0.1 M
Water2020,12, 2561 4 of 10
H
2SO
4solution. According to [22], the peaks from Ex/Em = 220/290 nm and Ex/Em = 240/420 nm were determined as protein-like and humic-like components, respectively.
Pearson’s correlation analysis was used to analyze the data. A p-value of less than 0.05 was considered statistically significant. All statistical analyses were performed using R ver. 3.3.3 [23].
3. Results and Discussion
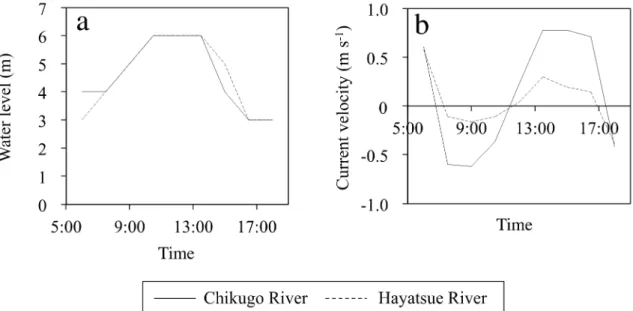
The water level reached a maximum at high tide (Figure 2a). The current velocity showed negative values from 7:30 to 11:30, indicating that seawater intrusion started and continued until high tide (Figure 2b). Then, the current velocity turned into positive values at 11:30, and this continued until 17:00. This means that river water kept outflowing until low tide. The salinity increased with time, reached a maximum at high tide, and then decreased until low tide (Figure 3a). The turbidity was higher at the bottom than at the surface in both rivers (Figure 3b). In both rivers, the turbidity tended to decrease from low to high tide and then increased until the next low tide. Although both ebb and flood tides induced sediment resuspension, it was greater during the ebb tide. A previous study reported that the transport of salinity and the river discharge in the Hayatsue River are weaker than those in the Chikugo River due to the thalweg topography of the Hayatsue River [24]. Consistent with the previous report, we found that the Chikugo River mouth was strongly influenced by the tidal current when compared to the Hayatsue River mouth (Figure 2b). A relatively high turbidity in the Chikugo River mouth (Figure 3b) can be caused by a high tidal current.
Water 2020, 12, x FOR PEER REVIEW 4 of 10
Pearson’s correlation analysis was used to analyze the data. A p-value of less than 0.05 was considered statistically significant. All statistical analyses were performed using R ver. 3.3.3 [23].
3. Results and Discussion
The water level reached a maximum at high tide (Figure 2a). The current velocity showed negative values from 7:30 to 11:30, indicating that seawater intrusion started and continued until high tide (Figure 2b). Then, the current velocity turned into positive values at 11:30, and this continued until 17:00. This means that river water kept outflowing until low tide. The salinity increased with time, reached a maximum at high tide, and then decreased until low tide (Figure 3a).
The turbidity was higher at the bottom than at the surface in both rivers (Figure 3b). In both rivers, the turbidity tended to decrease from low to high tide and then increased until the next low tide.
Although both ebb and flood tides induced sediment resuspension, it was greater during the ebb tide. A previous study reported that the transport of salinity and the river discharge in the Hayatsue River are weaker than those in the Chikugo River due to the thalweg topography of the Hayatsue River [24]. Consistent with the previous report, we found that the Chikugo River mouth was strongly influenced by the tidal current when compared to the Hayatsue River mouth (Figure 2b). A relatively high turbidity in the Chikugo River mouth (Figure 3b) can be caused by a high tidal current.
Figure 2. Variations in the (a) water level and (b) current velocity during the sampling period. A positive value of the current velocity means a southward velocity (outflow from rivers).
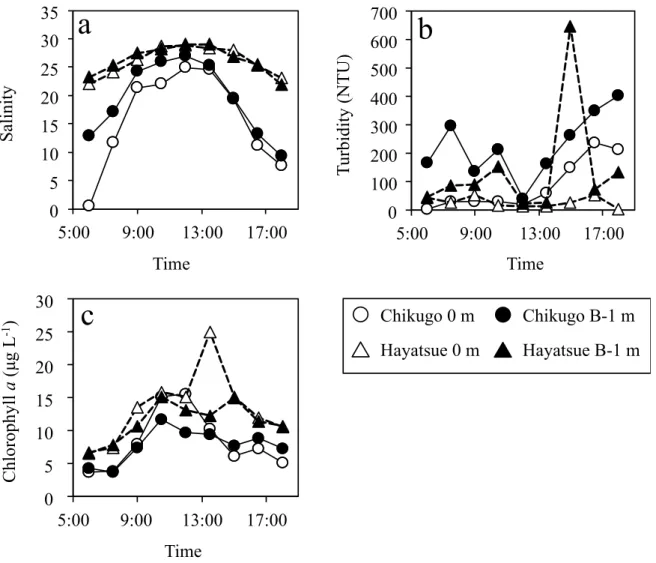
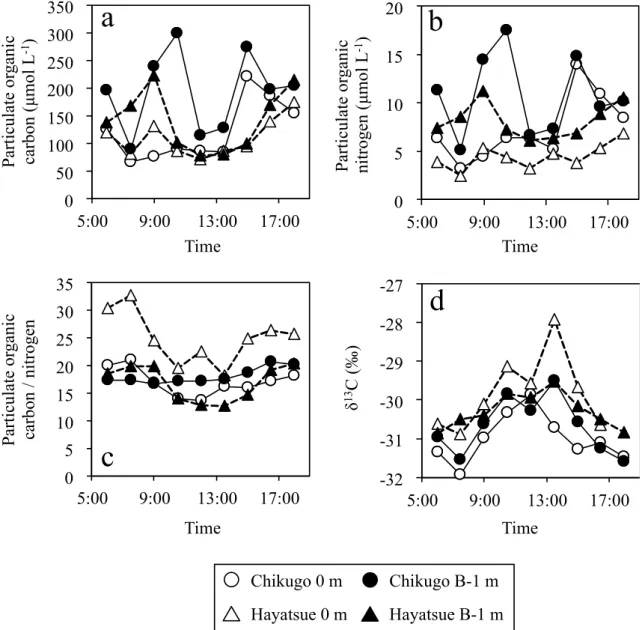
The Chl. a concentration, a proxy for the phytoplankton biomass, changed in a similar manner as the salinity (Figure 3c). The Chl. a concentration increased with time, reached a maximum at high tide, and then decreased until low tide. This indicates that the flood tide transports marine-phytoplankton-derived POM from the Ariake Sea into the Chikugo and Hayatsue River Estuaries. However, the POC and PON concentrations changed in a direction opposite to that of the Chl. a concentration (Figures 3c and 4a,b). The POC and PON concentrations tended to decrease toward high tide and then to increase toward low tide. In macrotidal estuaries, a water mass with a high POC concentration results from the active resuspension of sediments by the strong tidal current, and the ebb tide accelerates the suspended POC discharge from the river to the coastal sea [25]. In this study, we found turbidity changes in relation to the tidal cycle (Figure 3a,b) and significant positive correlations of the turbidity with POC and PON in the Chikugo River mouth (Table 1), suggesting that the tidal current induced the resuspension of sediments, supplying POC to the water column. However, such a relationship was not found in the Hayatsue River mouth (Table 2). A relatively weak tidal current in the Hayatsue River might not be enough to supply POC
Figure 2. Variations in the (a) water level and (b) current velocity during the sampling period. A positive value of the current velocity means a southward velocity (outflow from rivers).
The Chl. a concentration, a proxy for the phytoplankton biomass, changed in a similar manner
as the salinity (Figure 3c). The Chl. a concentration increased with time, reached a maximum
at high tide, and then decreased until low tide. This indicates that the flood tide transports
marine-phytoplankton-derived POM from the Ariake Sea into the Chikugo and Hayatsue River
Estuaries. However, the POC and PON concentrations changed in a direction opposite to that of the
Chl. a concentration (Figures 3c and 4a,b). The POC and PON concentrations tended to decrease
toward high tide and then to increase toward low tide. In macrotidal estuaries, a water mass with a
high POC concentration results from the active resuspension of sediments by the strong tidal current,
and the ebb tide accelerates the suspended POC discharge from the river to the coastal sea [25]. In this
study, we found turbidity changes in relation to the tidal cycle (Figure 3a,b) and significant positive
correlations of the turbidity with POC and PON in the Chikugo River mouth (Table 1), suggesting that
the tidal current induced the resuspension of sediments, supplying POC to the water column. However,
such a relationship was not found in the Hayatsue River mouth (Table 2). A relatively weak tidal current in the Hayatsue River might not be enough to supply POC to the water column from sediments.
The C/N ratios of POM changed in the opposite manner to the salinity (Figures 3a and 4c) and exhibited high values throughout the study (Figure 4c). Conversely, the δ
13C values of POM changed in a similar manner to the salinity (Figures 3a and 4d) and exhibited low values. The δ
13C values of POM are presented in relation to the C:N ratios in Figure 5. Previous studies have reported that each of the major sources of estuarine POM possesses distinctive δ
13C values and C:N ratios: − 30 to − 24% and 5–10 for river-estuarine phytoplankton, − 24 to − 18% and 5–10 for marine phytoplankton, and − 32 to
− 23% and higher than 20 for terrestrial C3 plants, respectively [26–31]. POM in both river mouths exhibited depleted δ
13C values and high C:N ratios, and most of the plots were scattered within the range of terrestrial plants (Figure 5). Thus, resuspended POM is probably poorly bioavailable, since it is mainly composed of refractory terrestrial material [32]. Alternatively, depleted δ
13C values and high C:N ratios might be a reflection of the presence of phytoplankton-derived detritus in POM [25].
A previous study reported a depletion of δ
13C values and elevation of C:N ratios associated with the bacterial decomposition of phytoplankton [33]. This notion is partly supported by the results of Saliot et al. [34], who found that the concentrations of bacterial biomarkers in POM were generally high in the maximum turbidity zone in a macrotidal estuary.
Water 2020, 12, x FOR PEER REVIEW 5 of 10
water column from sediments. The C/N ratios of POM changed in the opposite manner to the salinity (Figures 3a and 4c) and exhibited high values throughout the study (Figure 4c). Conversely, the δ
13C values of POM changed in a similar manner to the salinity (Figures 3a and 4d) and exhibited low values. The δ
13C values of POM are presented in relation to the C:N ratios in Figure 5. Previous studies have reported that each of the major sources of estuarine POM possesses distinctive δ
13C values and C:N ratios: −30 to −24‰ and 5–10 for river-estuarine phytoplankton, −24 to −18‰ and 5–
10 for marine phytoplankton, and −32 to −23‰ and higher than 20 for terrestrial C3 plants, respectively [26–31]. POM in both river mouths exhibited depleted δ
13C values and high C:N ratios, and most of the plots were scattered within the range of terrestrial plants (Figure 5). Thus, resuspended POM is probably poorly bioavailable, since it is mainly composed of refractory terrestrial material [32]. Alternatively, depleted δ
13C values and high C:N ratios might be a reflection of the presence of phytoplankton-derived detritus in POM [25]. A previous study reported a depletion of δ
13C values and elevation of C:N ratios associated with the bacterial decomposition of phytoplankton [33]. This notion is partly supported by the results of Saliot et al. [34], who found that the concentrations of bacterial biomarkers in POM were generally high in the maximum turbidity zone in a macrotidal estuary.
Figure 3. Variations in the (a) salinity, (b) turbidity, and (c) chlorophyll a concentration during the sampling period.
The DOC concentration changed in the opposite manner to the salinity (Figures 3a and 6a) and was less variable than the POC concentration (Figures 4a,d) in both river mouths. Both protein-like and humic-like components changed in a similar manner as DOC (Figure 6). A previous study suggested that DOC is supplied from the active resuspension of sediments induced by tidal currents
0 5 10 15 20 25 30
5:00 9:00 13:00 17:00
0 100 200 300 400 500 600 700
5:00 9:00 13:00 17:00 Time
T urbidity (NTU)
Salinity
Time
a b
Time
c
Chlorophyll a (µ g L
-1) Chikugo 0 m Chikugo B-1 m
Hayatsue 0 m Hayatsue B-1 m 0
5 10 15 20 25 30 35
5:00 9:00 13:00 17:00
Figure 3. Variations in the (a) salinity, (b) turbidity, and (c) chlorophyll a concentration during the sampling period.
The DOC concentration changed in the opposite manner to the salinity (Figures 3a and 6a) and
was less variable than the POC concentration (Figure 4a,d) in both river mouths. Both protein-like and
Water2020,12, 2561 6 of 10
humic-like components changed in a similar manner as DOC (Figure 6). A previous study suggested that DOC is supplied from the active resuspension of sediments induced by tidal currents through the infusion of DOC in pore waters and DOC release from suspended POM [35]. Nevertheless, in this study, the DOC concentration, protein-like and humic-like components were not correlated with turbidity but were negatively correlated with salinity (Tables 1 and 2). This conservative behavior of DOM suggests that sediment resuspension is not always a major determinant of DOM dynamics, including both labile and refractory fractions in macrotidal estuaries. Despite large differences in turbidity and DOM between the Chikugo and Hayatsue Rivers, consistent results were obtained.
In addition, we did not find a significant positive correlation between turbidity and DOM around the Chikugo River mouth throughout seasonal monitoring (authors unpublished data). Those facts give us some added confidence about the robustness of our conclusion. Our conclusion may also be supported by the results of Kang et al. [36], who found that DOC fluxes were, in general, controlled by the water discharge in estuary systems.
Water 2020, 12, x FOR PEER REVIEW 6 of 10
through the infusion of DOC in pore waters and DOC release from suspended POM [35].
Nevertheless, in this study, the DOC concentration, protein-like and humic-like components were not correlated with turbidity but were negatively correlated with salinity (Table 1,2). This conservative behavior of DOM suggests that sediment resuspension is not always a major determinant of DOM dynamics, including both labile and refractory fractions in macrotidal estuaries. Despite large differences in turbidity and DOM between the Chikugo and Hayatsue Rivers, consistent results were obtained. In addition, we did not find a significant positive correlation between turbidity and DOM around the Chikugo River mouth throughout seasonal monitoring (authors unpublished data). Those facts give us some added confidence about the robustness of our conclusion. Our conclusion may also be supported by the results of Kang et al.
[36], who found that DOC fluxes were, in general, controlled by the water discharge in estuary systems.
Figure 4. Variations in the (a) particulate organic carbon (POC) concentration, (b) particulate organic nitrogen (PON) concentration, (c) POC/PON, and (d) δ
13C values of POC during the sampling period.
0 5 10 15 20 25 30 35
5:00 9:00 13:00 17:00
0 5 10 15 20
5:00 9:00 13:00 17:00 0
50 100 150 200 250 300 350
5:00 9:00 13:00 17:00 Time
Particu late or gan ic carb on (µ m ol L
-1) Particulate or ganic nitrogen (µ mol L
-1)
Particulate or ganic ca rbo n / nitroge n
a b
c
Time
Time
Chikugo 0 m Chikugo B-1 m Hayatsue 0 m Hayatsue B-1 m
Time δ
13C (‰)
d
-32 -31 -30 -29 -28 -27
5:00 9:00 13:00 17:00
Figure 4. Variations in the (a) particulate organic carbon (POC) concentration, (b) particulate organic
nitrogen (PON) concentration, (c) POC/PON, and (d) δ
13C values of POC during the sampling period.
Water 2020, 12, x FOR PEER REVIEW 7 of 10
Figure 5. Scatter diagrams of stable carbon isotope ratios (δ
13C) against organic carbon-to-nitrogen atomic ratios (C:N). The δ
13C and C:N ranges for river-estuarine and marine phytoplankton, and for terrestrial plants, are derived from references [26–31].
Figure 6. Variations in the (a) dissolved organic carbon (DOC) concentration, (b) protein-like component, and (c) humic-like component during the sampling period.
-32 -30 -28 -26 -24 -22
5 15 25 35
Riv er- es tu ari n e ph yt op lan kt o n
Marine phytoplankton Terrestrial plants
Chikugo 0 m Chikugo B-1 m Hayatsue 0 m Hayatsue B-1 m
C:N δ
13C (‰ )
Time
Disso lve d or gan ic carbon (µ mol L
-1) Pro tein-lik e components (QSU )
H umic-lik e co m ponen ts (QSU)
a b
c
Time
Time
Chikugo 0 m Chikugo B-1 m Hayatsue 0 m Hayatsue B-1 m 0
50 100 150 200
5:00 9:00 13:00 17:00
0 20 40 60 80 100
5:00 9:00 13:00 17:00
0 100 200 300 400
5:00 9:00 13:00 17:00
Figure 5. Scatter diagrams of stable carbon isotope ratios (δ
13C) against organic carbon-to-nitrogen atomic ratios (C:N). The δ
13C and C:N ranges for river-estuarine and marine phytoplankton, and for terrestrial plants, are derived from references [26–31].
Water 2020, 12, x FOR PEER REVIEW 7 of 10
Figure 5. Scatter diagrams of stable carbon isotope ratios (δ13C) against organic carbon-to-nitrogen atomic ratios (C:N). The δ13C and C:N ranges for river-estuarine and marine phytoplankton, and for terrestrial plants, are derived from references [26–31].
Figure 6. Variations in the (a) dissolved organic carbon (DOC) concentration, (b) protein-like component, and (c) humic-like component during the sampling period.
-32 -30 -28 -26 -24 -22
5 15 25 35
River- estuarine phytoplankton