Acta med. Nagasaki. 12: 65-82
On the Visually Evoked Potentials in the Cerebral Visual, Somatosensory, Motor and Association Areas of Monkeys
(Maraca Cyclopis)
Nobuya OCHI*
The Second Department of Physiology
Nagasaki University School of Medicine, Nagasaki, Japan
Received for publication, March 4, 1968
Seventeen unanesthetized monkeys (sixteen macaca cyclopis and one macaca mulatta) were immobilized by galamine triiodoethylate (Flaxedil) and masspotentials (EEG and evoked potentials) before and during flashing light stimulation to atropinized eyes were led by grosselectrodes from the cerebral visual (occipital cortex), association (superior and inferior parietal, superior frontal cortex), motor and somatosensory areas. Simultaneously, masspoten- tials of six loci and one tracing of stimulation signals were recorded onto 1/4 inch magnetic tape. These magnetic records were fed into the computer (ATAC-401 or ATAC-501-20) and summation average evoked potentials and autocorrelograms of background EEG were obtained.
It was found that there were the following three response components in the visually evoked potentials of the cerebral visual area, i. e. (i) sharp or relatively sharp initial biphasic positive-negative deflections (P1 N1 , P2 N2 , P3 N3, etc.) , (ii) late biphasic slow components (p1 n1 , p2 n2, p3 n3) and (iii) wavelets superimposed on the sharp or relatively sharp deflections and sometimes on the late slow components. Similar response components were also observed in areas other than the visual area.
Though the above three components were combined with each other in a variety of extents to show considerably complex configurations in the summation average evoked potentials in the visual area, their config- urations could be classified into four groups. In the first group, the wave- lets were superimposed on the sharp or relatively sharp biphasic deflec- tions which were followed by the late slow components, wherein the first late slow negative deflection n1 was shown by moving average method to be masked in some instances by P3 N3 and P4 N,. In the second group, the wavelets were hardly observed so that the late slow components (p2 n2 and p3 n3) were evident. In the third group, negative deflections N2 and N3 were weak and in the fourth group, the peak latencies of each of the sharp or relatively sharp biphasic deflections, especially those of P3 and N3 were prolonged considerably, but the late biphasic slow components were observed in both of the above groups.
*越 智伸弥
When the wavelets in the visual cortex are superimposed promin- ently on the sharp or relatively sharp deflections and on the late slow
components of the evoked potentials to suggest high activity, not only was the fastwave in the background EEGs predominant, but also a regular oscillation of about 20c/s and irregular oscillations of slower frequencies were observed respectively in the autocorrelograms of the background EEGs in the visual and other cortices.
On the contray, when the sharp or relatively sharp deflections in the evoked potential of the visual cortex were the least and most pro- longed in their peak latencies, with complete absence of wavelets, slow waves were dominant in the background EEGs and slow irregular osci- llations were revealed in their autocorrelograms to suggest lowest ce- rebral activity.
In the instance of intermediate patterns between the above two evoked potentials, various variations and alterations in the above two properties were observed in the EEGs and their autocorrelograms to present considerable complexity.
Three response components similar to those observed in the occi- pital cortex were also found to be elicited by flashing light stimulus in the superior and inferior parietal, post- and precentral and superior frontal gyri of the cerebral cortex, though their sizes were from one third to one tenth of those in the occipital cortex. The onset and/or peak latencies of their initial positive deflections was almost the same or slightly longer than that observed in the occipital cortex.
INTRODUCTION
In spite of the many studies on the visually evoked potentials in the cerebral cortex of cats (1, 3, 4, 5, 6, 11, 14, 16, 17, 18, 19, 20, 21, etc.), considerably less work is available on monkeys (HUGHES 1964;
HUGHES and MAZUROVVSKI 1962; DOTY and KIMURA 1963; DOTY et al. 1963, 1964; COWEY 1964), in which hardly any response configurations have been demonstrated and "rhythmical oscillatory activities" have chiefly been observed. Far fewer observations have been made on the visually evoked potentials in areas other than the visual areas, i.e. the mesial supracallosal area (HUGHES'?)) and a portion of the superior temporal gyrus (DOTY et al. 9110)). Recently, BIGNALL and SINGER (1967)2) have found
"polysensory areas" in various "nonprimary areas"
, wherein evoked
potentials were elicited by flash, click and electric shock to skin. How-
ever, now observations were made on the response configurations. In
this study, therefore, not only were time-patterns of summation average
evoked potentials in the cerebral visual, somatosensory and other areas
obtained, but also those in the visual area were studied in relation to
the background EEG activity.
METHODS
Acute unanesthetized but immobilized experiments were carried out on seventeen adult monkeys (sixteen macaca cyclopis and one (NO.300- 25) macaca mulatta) weighing from 2.4 to 5.6 Kg.
The trachea was cannulated under ether anesthesia. After being mounted on JOHNSON'S type stereotaxic instrument, an opening as small as possible was made in the skull. After ether had been expelled by artificial respiration (24/minute) with oxygen-mixed air, gallamine tri- iodoethylate (Flaxedil) was injected intraperitoneally, first a dose of 20 mg/kg and then at a rate of 10-20 mg/kg/hour to immobilize the ani- mal. Silver ball tipped monopolar electrodes of 0.5 mm diameter were placed onto the dura or pia of the occipital, superior and inferior parie- tal, postcentral, precentral and superior frontal gyri of the cerebral cortices. Mono- and/or bipolar depth electrodes of steel or nicrome wire of 22 and 24 gauge insulated except at their tips were inserted into the lateral geniculate body, mesencephalic reticular formation, centrum medianum, etc. These were confirmed histologically after completion of the experiments by KLUVER-BARRERA'S staining method (1953)15' The reference silver wire electrode was inserted into the muscle of the nape or the bilateral temporal region.
All wound areas and pressure points were locally anesthetized with 2% procain to remove pain. Both pupils were dilated with 0.5% atropin sulphate. Flashing light stimulation was delivered binocularly at inter- vals of 0.5, 0.7 or 1.0 f/sec. The flash of about 6000°K daylight, 1 Watt/sec and about 100,us duration were from a stroboflash bulb (FT-
100, Mazda) attached to a photic stimulator (PS-101, San' ei-Sokki Co.). To diffuse the flasling light, a frosted glass plate, a round iris opening and a cotton white curtain were placed in front of the flash bulb, located 50 cm from the eyes. The diameter of the iris opening used was 100 mm in fifteen monkeys and 30 mm in two monkeys. The relative intensity of the light on a logarithmic scale was 2.6 and 1.7, respectively, when the intensity through the iris of 5 mm diameter was taken as 0.
Ink-records of mass potentials (EEG's and evoked potentials) and stimulation signals were prepared on a 8-channel polygraph (R M -150, Nihon Kohden Co.) or a 8-channel electroencephalograph (EG-803, San' ei Sokki Co.) and, at the same time, recorded on 1/4 inch magnetic tape by the PWM and FM methods, respectively, through a 8-channel data recorder (SPRA-48, Shiroyama Tsushin Co.) while monitoring on two four-beam cathode ray oscilloscopes (VC-6, Nihon Kohden Co.) and a one-beam synchroscope (SS-5022, Iwasaki Tsushin Co.).
The summation averaged response time-patterns (crosscorrelograms of the stimulus and masspotentials) were obtained by feeding the mag- netic tape records into the Digital Computer For Data Processing (AT- AC-401, Nihon Kohden Co.). Positivity of responses was indicated by a downward deflection.
The autocorrelograms (averaged time-patterns) of the 'background
EEGs of 2.6 seconds length (total delay) were obtained by the Com-
puter For Data Processing (ATAC- 501- 20, Nihon Kohden Co.) from
the magnetic EEG recording of 40 sec length (analysis time).
RESULTS
1) Photically evokek summated potentials in the visual cortex (occipital and lateral striate cortex).
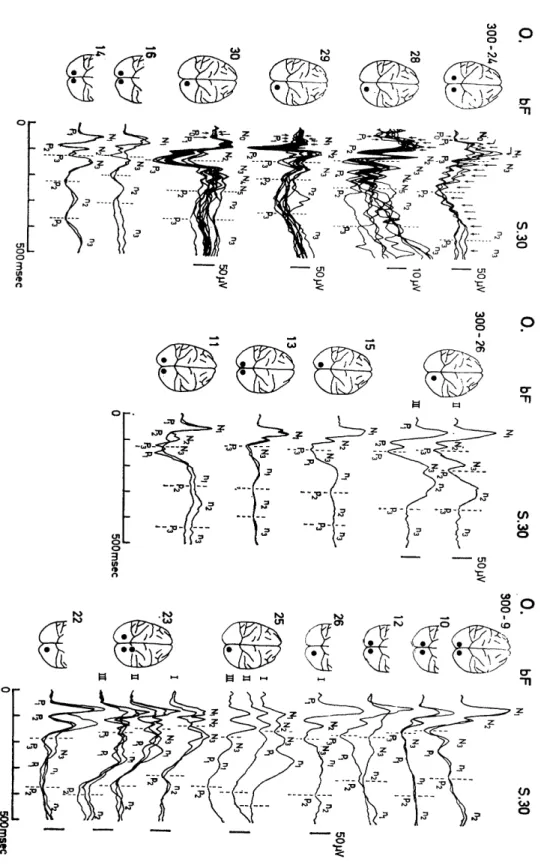
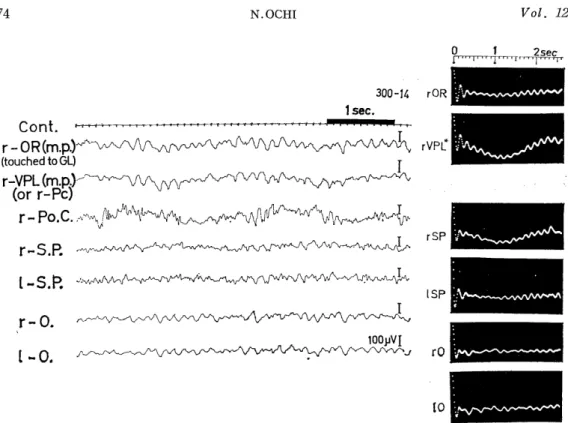
Photically evoked potentials in the cerebral visual area (lateral striate cortex) of monkey were obtained over a time length of 500 msec after flash stimulus by thirty times summation (Fig. 1.1). Though the evoked potentials were considerably complex and highly variable in their configurations from animal to animal, the following three response com- ponents were observed in the evoked potentials: (i) Along with the primary positive deflection (P1) with a peak latency of 25-60 msec, three to five sharp or relatively sharp Initial biphasic components of 30-60 msec duration were observed until 150-250 msec after delivery of the flash (P1 N1 , P2N2 , P3N3, etc.). This was followed by (ii) two or three slow biphasic potentials (pin, , P2 n2 , P3 n3) of about 150 msec duration which had longer peak latencies. In addition, (iii) about ten or fewer small, sharp deflection with a shorter duration of 10-25 msec were brought out which formed a time-pattern of wavelet superimposed on responses (i) and/or (ii) (Figs. 1.1 and 1.2) . The peak latencies of every response components except those in the wavelets (iii) were more consistent than their amplitudes. The peak latencies of PIN, and P.
N2 were relatively consistent, whereas that of P3N3 was inconsistent and those of the late slow components p1 n1 , p2 n2 and p3 n3 were more variable. It was found that the slow biphasic potentials (ii) were mas- ked in some instances by the initial biphasic potentials (i) since poten- tial (ii) couId be separated by taking the moving average over the length of response (i) (Fig. 1.3). Varying degrees of mixture of these three components were contained in each photically evoked potential of the seventeen monkeys to present complex configurations, which could be classified into the following four groups.
Group I . (Fig. 1.1; 300 - 24, - 28, - 29 and - 30). The wavelets were superimposed on each of the sharp or relatively sharp initial bi- phasic components, PIN,, P2N2, etc. Further, in one case they were sustained even longer to be superimposed on the late slow component p2n2 (Fig. 1.1, 300-24), and PIN, group, P2N2 group, etc. were ob- served. In addition, P4N4 and P5N5 were often brought out following P3N3 , and the late biphasic slow components were also elicited. In this group, the earlier n1 component preceeding the n2 component was masked by the P3N3 and P4N4 responses (Fig. 1.3). Group II. (Fig.
1.1, 300-16, -14). Almost none of the wavelets (iii) were brought out but the sharp or relatively sharp initial biphasic components (i) and the slow biphasic potentials (ii) were manifested consistently. Group III. (Fig. 1.1, 300-15, -13, -11). Though the components (i) and (ii) were elicited, P2N2 and P3N3 in the former components were not intense. Group IV. (Fig. 1.1, 300-9, -10, -12, -26 I, -25, -23 and -22) . The peak latencies of the response components in the sharp or relatively sharp initial biphasic components (i) were longer than those in other groups, especially that of the response P3N3 was considerably prolonged, and the components (ii) were also elicited.
2) Photically evoked averaged potentials in relation to the background EEGs
Fig. 1.1. Average photically evoked potentials in the cerebral visual cortex of mon-
keys.
Black circles in monkey brains indicate loci of lead electrodes. Each tracing of average evoked potentials was obtaided by summations of thirty times.
Fig. 1.2. Peak latencies of each component in the photically evoked potentials in the cerebral visual cortex of sixteen monkeys.
Numerals on the left are numbers of monkeys. Abscissa: time of peak latency Black and white circles: negative and positive deflections in the evoked potentials in Fig. 1.1 respectively. Shown from top to bottom are, group I (No. 24, 28, 29 and 30), group II (No. 16 and 14), group III (No. 15, 13, 11) and group IV (No. 9, 10, 12, 26-I, 25, 23 and 22). Broken and chain lines show respectively the dominant negative peaks and predominant positive peaks in each component.
Fig. 1.3. Slow response components masked by the sharp components.
By taking the moving average of the pho-
tically evoked potential (full line) twice, the
sharp or relatively sharp responses (N1, P2N2
and P3N3) were eliminated and two succssive
slow diphasic responses emerge. The former
and latter were masked respectively by respon-
ses N1, P2N2 and P3N3.
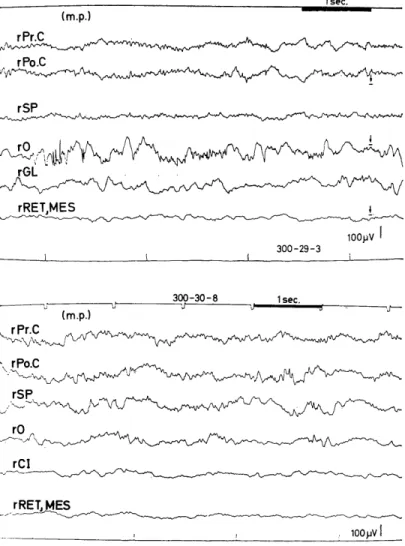
Fig. 2.1-1. Background EEGs of Group I visually evoked potential- s in the visual cortex.
r: right. 1: left. 0: occipital cortex. IP: inferior parietal cor- tex, SP: superior parietal cortex, Po.C: postcentral cortex, Pr.C:
precentral cortex, SF: superior frontal cortex, OR: optic radiation, GL: lateral geniculate body, CS: colliculus superior, RET. MES:
mesencephalic reticular formation, CI: capsula interna, m.p.: mo
ncpolar lead. See text.
and their autocorrelograms.
As the above variability in the averaged evoked potentials seemed to be related more or less to background cerebral activity, background EEGs and their autocorrelograms were observed in relation to the evo- ked potentials in the visual cortex. In the animals showing Group I average evoked potentials (Fig. 1.1, 300-24, -28, -29 and -30), fast waves of 15-21 c/s were seen in the background EEGs of the visual areas, from which the evoked potentials also were obtained. In some animals, these waves of varying amplitude were superimposed on the slower EEG waves of 5-8 c/s of the visual and other areas, including the superior frontal (SF), pre-(Pr.C, motor area) and postcentral areas (Po.C, somatosensory area), and subcortical sites (optic radiation OR, lateral geniculate body GL, superior colliculus CS, midbrain reticular formation RET. MES) . (Fig. 2.1-1).
In the instance of considerable wavelets in the average evoked potential (Fig. 1.1, 300-24), the fast wave was predominant in the
Fig. 2.1-2. An example of autocorrelo- grams of background EEGs.
Analysis time 40 sec. Maximum delay 2.6 sec (see left top). Each autocorrelo- gram of EEG was calibrated by the height of pulse at the time origin of the auto- correlogram of pulse series over the same
length of time as the EEG. Slow wave of 0.4 c/s is the artifact caused by artificial respiration. A regular oscillation of about 20 c/s was superimposed on a slow wave
of about 2.2 c/s in the left occipital cor- tex (1-0 and bottom), while irregular oscillations were seen in other areas. This animal (300-24) showed the most prom- inent wavelets in the visually evoked po- tential of the occipital cortex (Fig. 1.1) and its background EEGs (Fig. 2.1-1) showed fast wave patterns of 20-21c/s in the visual cortex (1-0), while low vol- tage fast waves of 24-25c/s and fast wa- ves were superimposed on slow waves of 5-8c/ s in subcortical sites (rOR, CS).
The bottom autocorrelogram was recorded
by the Eletronic Polyrecorcer (EPR-10A,
Toa Elect. Ltd.). Calibration: 500/V.
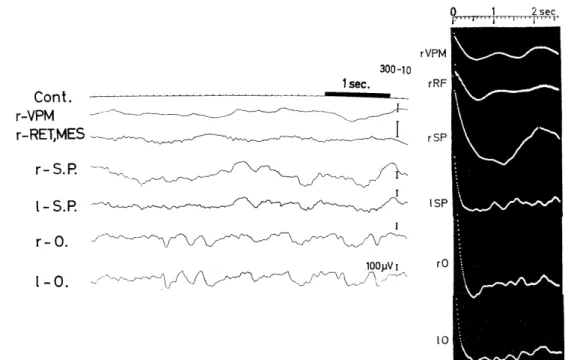
background EEG (Fig. 2.1-1, 1-0), and its autocorrelogram (Fig. 2.1 -2) showed a regular oscillation of about 20 c/s frequency superimposed on a slow oscillation of about 2.2 c/s. On the other hand, in the case where the wavelets (iii) were entirely absent and in which the evoked sharp or relatively sharp responses (ii) were the weakest with the most prolonged peak latencies in the visual area (Fig. 1.1, 300-10), the background EEG in this area showed a pattern of irregular slow waves of about 1.4, 2.5 and 3 c/s and small waves of about 9 and 12.5 c/s (Fig. 2.2, left). The former waves were also seen in other cerebral areas (r-SP, 1-SP), whereas slower fluctuations of about 1 c/s were observed in subcortical sites(VPM and RET. MES). In their autcorrelograms(Fig.2.2,
Fig. 2.2. Background EEGs and their autocorrelograms of an animal (300-10) showing visually evoked potentials of Group IV.
Slow wave of about lc/s were dominant in the background EEGs of sudcortical sites (r-VPM, r-RET. MES), which were verified in their autocorrelograms, while
in EEGs in the cortical sites (SP, 0) irregular slow waves of about 1.4, 2.5 and 3c/s were dominant, onto which low waves of about 9, 12.5c/s etc. were superimposed and their autocorrelograms depicted irregular slow fluctuations of these low cycles.
Slow wave of about 0.5c/ s (about 2 sec period) in EEG and in its autocorrelogram of rSP is the artifact derived from artificial respiration. VPM: n. ventralis postero- medialis.
right), the above irregular slow waves were seen in the occipital and sup-
erior parietal cortices while a slow wave of about 1c/s was noted in the
subcortical sites. In the intermediate type between the above two average
evoked potentials, a considerable variety of background EEG patterns
were observed. In a representative animal (Fig. 1.1, 300-14), waves
of about 6-7 c/s were manifested in the background EEGs of the oc-
Fig. 2.3. Background EEGs and their autocorrelograms of an animal(300-14) show- ing visually evoked potentials of Group II.
Background EEGs showed waves of 6-7c/s in the cerebral cortex (Po.C, SP, 0) and subcortical sites (OR, VPL), and further spindle like waves of 12-14 c/s were seen in the somatosensory area (rPo.C). In their autocorrelograms regular oscillation of 6.6c/s was manifested in all regions. See text. VPL: n. ventralis posterolateralis.
cipital area (0), optic radiation adjacent to the lateral geniculate body (OR), nucleus ventralis posterolateralis (VPL), or nucleus paracentralis (Pc) while waves of 12-14 c/s were interposed in the above waves in the EEG of the postcentral area (Po. C .) or superimposed on that of the superior parietal area (SP) (Fig. 2.3, left). In their autocorrelograms (Fig. 2.3, right), a mixed pattern of about 3.3 and 6.6 c/s was exhi- bited in the occipital areas (0), and another wave of about 12 c/s was intermingled with these slow waves in the superior parietal areas (SP), whereas a regular wave of about 6.6 c/s was manifested in the sub- cotical sites (OR and VPL).
In the background EEGs of various areas of such monkeys that ex-
hibited visually evoked potentials of Group III (Fig. 1.1, 300-13),
irregular slow waves of 5-6 c/s were superimposed on large slow
waves of 1-1.5 c/s (Fig. 2.4, left). Their autocorrelograms, on the
average, demonstrated the above pattern (Fig. 2.4, right). On the
contray, the background EEGs (Fig. 2.5, left) which demonstrated
visually evoked potentials of Group IV (Fig. 1.1, 300-25-15) may be
a slow wave pattern of about 2 c/s, since the waves of about 10-30 c/s
superimposed on the slow wave in the EEGs did not appear and only
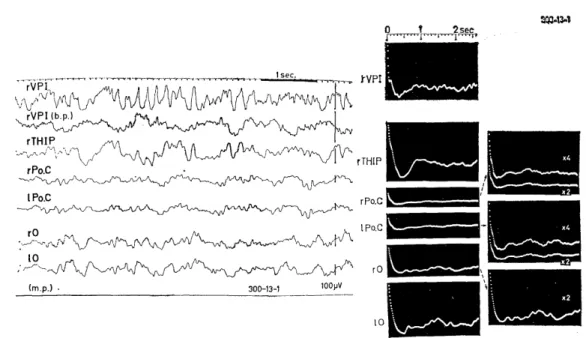
Fig. 2.4. Background EEGs and their autocorrelograms of an animal (300-13) show- ing visually evoked potentials of Group 111.
Irregular slow waves of 5-6 c/s were superimposed on large and slow waves of 1-1.5 c/s in background EEGs of all regions and irregular patterns were seen in their autocorrelograms. VPI: n. ventralis postero-nferior. THIP: tractus habenulo- interpeduncularis. b.p.: bipolar lead.
Eig. 2.5. Background EEGs and their autocorrelograms of an animal (300-25) show- ing visually evoked potentials of Group IV.
Background EEGs of cortical (0, SP, SF) and subcortical sites (CI, etc.) showed predominant large waves of 2c/s, upon which waves of 10-30 c/s were superimposed.
In their autocorrelograms, regular waves of 2.2 c/s were manifested in rSF, 1SP and 1SF and irregular slow waves were depicted in other regions. The wave of 0.4 c/s
(2.5 sec period) is the artifact caused by artificial respiration,
the wave of 2 c/s was seen in the autocorrelograms of the EEGs (Fig.
2.5, right).
3) Evoked potentials elicited by flash to the cerebral somatosensoyy, motor and association areas.
Although no sign was manifested in the electroencephalographic ink records during stimulation, summation averaging with the computer revealed evoked potentials in response to binocular single flash stimulus not only in the superior and inferior parietal cortex (SP, 1P), which are considered as the association areas, but also even in the more rostral portion (superior frontal cortex, SF) (Figs. 3.1, 2,3,4,5,6). On
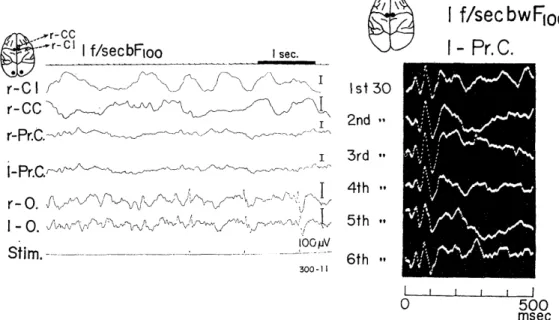
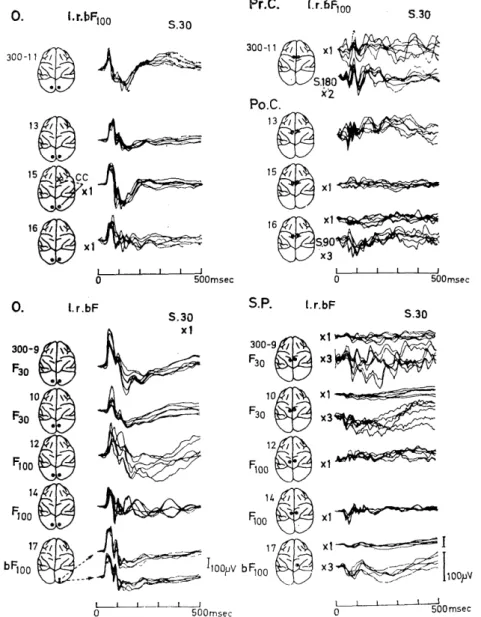
Fig. 3.1. EEGs and photically evoked potentials in the motor cortex.
Though no significant deflection time-locked to the signals (slim.) of binocular flash stimulation of t f/sec was observed in EEGs of the motor cortices (r-Pr. C and 1-Pr.C), clear cut average evoked potentials were manifested by summation of thirty times. C1: capsula interna. CC: corpus callosum.
the right of Fig. 3.1 are shown six evoked potentials successively ob- tained by summation of thirty responses in the motor cortex (Pr. C) . Within 100 msec after the flash stimulus, two sharp positive-negative deflections followed by a deep positive swing were manifested. This was
a fixed pattern with a slight variation in their magnitudes, whereas later responses were more variable both in their pattern and size. By summation of 180 responses, however, the later responses were con- verted to a relatively fixed pattern (Fig. 3.2). Initial sharp components
((i) PIN,, P2N2 and P3) and late slow ones were found in the motor
cortex. As depicted in Fig. 3.3, not only the late slow response, but
also the wavelets composed of repetitive biphasic small deflections of
Fig. 3.2. Visually evoked potentials in the motor cortex.
Six average evoked potentials, each of which were brought out in bilateral motor cortices by left and right monocular and binocular flashing light stimulation, were traced used the same
base line. Top and bottom: thirty and one
hundred eighty summations, respectively. Ca-
libratian of the bottom traces is two-fold of that of top traces.
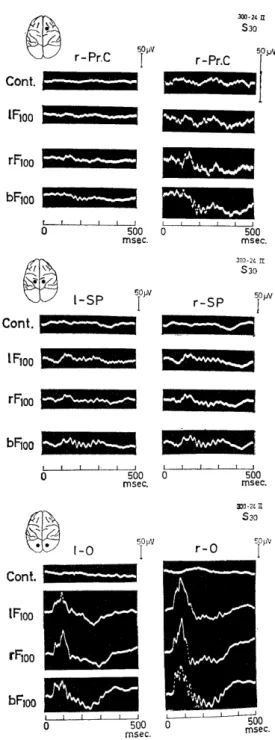
Fig. 3.3. Wavelets in the average evoked potentials in various cerebral areas.
Cont: summation of backgraund EEG with- out the stimulation by the same interval of each flash stimulus. l.r.b Fin: left, right monocular and binocular flashing light stimu- lation through an iris of 100mm diameter. The evoked potential in the visual cortex is of Group I and high wavelets (Fig. 1.1, 300-24).
about 25 msec duration were also found superimposed on the slow re- sponse in the superior parietal (SP) and the motor cortex (Pr.C).
These responses due to binocular stimulus were more prominent than those due to monocular stimulus as observed in the occipital cortex.
Hence, it was found that the same three kinds of photically evoked
potentials as those verified in the occipital cortex are elicited in the
somatosensory, motor and association cortices, though less in size,
The duration of each component in the above three kinds of evo- ked responses was similar to that of each corresponding component `in the evoked responses in the occipital cortex. Every one of the above three responses were brought out in varying extent to manifest a var- iety of patterns different from that of the response in the occipital cor- tex (Figs. 3.4, 5) . However, they were less in their magnitudes being from one third to one tenth in amplitude and show considerably greater fluctuations. The onset and/or peak latencies of the initial positive de- flection (P1) was almost the same or slightly longer than that observed in the occipital cortex (Figs. 3.4, 5). Though the above observations
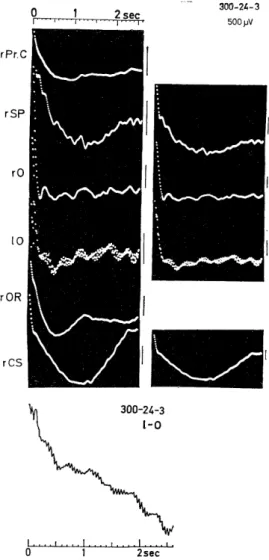
Fig. 3.4. Visually evoked potentials in the motor, somatosensory, and superior
parietal cortex in comparison with that in the visual cortex,
Fig. 3.5. An example of the visually evoked potentials in various cerebral cortices in comparison with that in the visual cortex.
Initial positive response (P1) was verified in every cortices. Their peak latencies were similar to or slightly longer than that of visual cortex.
were obtined by monopolar lead, summation average responses were also obtained by bipolar lead, wherein the paired electrodes were placed 3mm apart and parallel to the parieto-occipital sulcus. These also in- dicated that similar initial sharp componets, which were composed of
3-5 biphasic deflections with durations of about 30 msec and onset la- tency of about 50 msec, and the two (late) slow components with peak latencies of about 130 and 260 msec and duration of about 130 and 240 msec respectively were also elicited. These slow components corres- ponded to the nl and n2 components manifested by monopolar lead.
These responses were distinct especially in the superior parietal cortex (SP, association cortex), and also were exhilited in the somatosensory
(Po.C), motor (Pr.C) and superior frontal cortices (SF) (Fig. 3.6).
Hence, the responses manifested in areas other than the occipital
cortex were not induced by volume conduction of the responses in
the occipital cortex but had been elicited and this suggests some co-
operative integration of visual inflows in these areas,
Fig. 3.6. Bipolarily evoked potentials in various cortices in relation to monopolar potentials in the visual cortex.
Initial sharp and late slow components were verified also by bipolar lead, in which those obtained in the superior parietal cortex were especially prominent.
DISCUSSION
Summation average response in the visual cortex and background EEG activities.
Though photically evoked cerebral potentials in monkey were comp- licated in their configuration (Fig. 1.1), as pointed out by DOTY et al."' and BIGNALL and SINGER2) , the author was able to classify them into four groups, each of which seemed to be derived from a characteristic combination of three response components.
These three components were the first sharp or relatively sharp initial biphasic components (PIN,, P2N2, P3N3, etc.), the late biphasic slow components (pin,, p2n2 and p3n3) and the wavelets. Wavelets occuring every 5 - 7 msec in the early portion and every 10 -14 msec in
the later portion of the evoked potential have been demonstrated by HUGHES and MAZUROWSKI13). In addition, "the prominent rhythmical activity" of 5-30 msec duration noted by HUGHES12) and "the oscillatory response" of 160-210/sec frequencies of DOTY and KIMURA8) and Doty et al. 10) may be the same as the wavelets of the author, since they were brough out more markedly during higher brain activity and superim- posed on the slower deflection with approximately the same duration as those of the wavelets of the author.
The more slowly developing positivity with peak latency of about
25-40 msec lasting about 50 msec and "the major response" with posi-
tive peak latencies of about 50-90, 120-140 msec and about 40-80 msec duration of DOTY and KIMURA8) and DOTY et al. 10) may correspond to the sharp or relatively sharp initial biphasic components. The more slow negativity noted by HUGHES12) seemed to be the first negative deflection N1 in the above initial biphasic sharp component.
Though HUGHES and DOTY et al. have done on a study mainly on the wavelets, they have not mentioned the late slow components found in this paper.
Photically evoked potential in the cerebral solnatosensory, motor and association
areas.