REACTION MECHANISM OF METHANATION ON IRON CATALYST
Hiroshige MATSUMOTO
(Received April 6, 1983)
Abstract
Transient experiments were carried out at 250℃ under atmospheric pressure in
order to elucidate qualitatively the reaction mechanism of methanation on a commer‑
cial fused iron catalyst. After the catalyst in the steady state was treated by helium for certain periods, a reaction mixture of 10% carbon monoxide in hydrogen was again introduced to the catalyst. These helium‑treated catalysts showed no substantial in‑
duction period for methane formation, whereas the freshly reduced catalyst showed a 60‑minute period of induction. With increasing period of the helium treatment, the rate of methane formation at the new steady state decreased. On the other hand, similar treatment by hydrogen flushing enhanced temporarily the rate of methane for‑
mation, which then regained the original steady state within 15 minutes. The rate of methane formation in the new steady state after the helium flushing decreased in pro‑
portion to increased amounts of water removed during the helium treatment. Increase in the methanation rate after the hydrogen treatment was closely related to the amo‑
unt of surface oxygen species removed by hydrogen. The reaction intermediate on the working surface is discussed in accordance with the scheme reported in the previous papers of this series.
Intro duction
The hydrogenation of carbon monoxide to methane can be regarded as the simplest example of the synthesis of hydrocarbons. However, iron cat‑
alysts, unlike nickel and cobalt catalysts, tend to form carbides and oxides on the surface resulting in some degree of change in activity and selectivity.
An interesting feature of this catalyst in the synthesis of methane and other
higher hydrocarbons is the long period (うf induction needed to achieve
steady‑state activity. In order to understand the induction period for the formation of hydrocarbons, the transient method should be a useful technique.
By the transient experiments described in the previous reports,卜8)
12 Hiroshige Matsumoto
the author proposed that the reaction intermediate on the iron catalyst was an enol type complex as proposed by Storch et al. (8), and modified by Kummer et at. (9) and by Hall et at. (10). Furthermore, the induction peri‑
od was explained as a period for the formation of an active surface of the iron catalyst, Hagg carbide. One of objectives in the present paper is con‑
firmation of these suggestions from previous work.
Experimental
The transient experiment in this work was carried out at 250 C under atmospheric pressure by using the apparatus and procedure described in the previous work (1). The reactants and products were analyzed by a mass spectrometer which was suitably calibrated by pure gases and gas mixtures. The continuous inlet system to the mass spectrometer has a re‑
sponse time sufficiently small to permit good resolution of the inlet step function. The iron catalyst used was CCI fused magnetite catalyst for ammonia synthesis promoted by 2.5% A1203, 0.6% K20 and 0.4% Si02. The pretreatment of the catalyst was carried out by pure hydrogen at 450cC for 48 hr. The resulting catalyst had 13.0 m2 !g of BET surface area. The particle size of the catalyst ranged from 250 to 300 Mm. The reaction mix‑
ture was 10.02% carbon monoxide in hydrogen. All gases used in the tran‑
sient experiment showed substantially no peak of mass number 32 in the mass spectra. The flow rates of inlet gases were carefully adjusted by needle valves to maintain 390士10 cc/g min for all experiments. Therefore, the switch from one gas stream to another by a 4‑way valve did not alter the pressure in the reactor.
Results
When the stream of the reaction mixture, 10% carbon monoxide in hy‑
drogen, flowing" to the catalyst in the steady state was suddenly changed to pure helium at the same flow rate, neither methane nor carbon dioxide was detected in the outlet helium stream. During the course of this helium treat‑
ment, the only component observed was water. After certain periods of the helium treatment, the reaction mixture was again introduced to the system.
The results are shown in Fig. 1. For the freshly reduced catalyst (curve 1), the rate of methane formation was very low on the introduction of the re‑
action mixture, but it gradually increased with time on stream to attain a
oO 2
( u
; u j
‑ 6 / d
│ o
∈
^ ) N O I I V
∑
∝ 0
﹂
? H U L O 山 1 V
∝
Fig. 1. Methane formation after various helium treatments of the
catalyst in the steady state. (1) freshly reduced catalyst, (2) 1 minute, (3) 5 minutes, (4) 30 minutes, (5) 60 min‑
utes treated by helium.
steady state. This induction period was approximately 60 minutes at 250‑C.
Then pure helium was admitted for 1 minute to the catalyst system originally in the steady state and finally the reaction mixture was again introduced to the system. Here, the helium‑treated catalyst showed instantaneously a constant rate of methane formation which was only slightly lower than that in the steady state. Similar experiments were performed for the catalysts treated by helium for various periods, as shown in Fig. 1. These helium‑
treated catalysts showed substantially no induction period such as was ob‑
served for the fresh catalyst (curve 1) in the formation of methane. Thus, the new steady state almost immediately appeared on the second exposure of the catalyst to the reaction mixture after helium treatment. For the catalyst treated by helium for various times, the rate of methane formation increased very slowly with the time on stream of the reaction mixture, but did not regain the original level (the steady‑state rate for the freshly re‑
duced catalyst) even after a 180 minute‑exposure to the reaction mixture.
re Hiroshige Matsumoto
The rate of methane formation in this quasi‑steady state decreased with the increase in the period of the helium treatment. The disappearance of the induction period and the decrease of the rate in the quasi‑steady state are considered to be quite similar to the phenomena observed in the experi‑
merits on carbon‑covered catalysts, as was shown in the previous work (4, 5).
If the catalyst in the original steady state was exposed to a pure hy‑
drogen stream in the place of helium, considerable rates of methane and water formation were observed. The details of these formations were de‑
scribed in the previous report (1). After a certain period of hydrogen flushing of the original steady‑state catalyst, the stream of hydrogen flow‑
ing to the reactor was again replaced by the reaction mixture. On this second introduction of the reaction mixture to the system, the methane for‑
mation was instantaneously observed at a rate higher than that in the steady state, and then decreased rapidly with the time on stream of the reaction mixture to attain the steady‑state level. The effects of the hydrogen flush‑
ing on the methane formation are shown in Fig. 2. The rate of methane
( U
!
∈
・ b J O t o
∈ ) N O 一 1 V 王
∝ 0
﹂
? H U L O u 1 V
∝
8
TIME (min)
Fig. 2. Methane formation after various hydrogen treatments of the catalyst
in the steady state. (1) 1 minute, (2) 5 minutes, (3) 10 minutes,
(4) 30 minutes, (5) 60 minutes treated by hydrogen.
formation at an initial stage of the reaction increased with the length of the hydrogen treatment up to 10 minutes, and then decreased with the period.
After 20 minutes of re‑exposure to the reaction mixture, all the catalysts treated by hydrogen for various periods showed substantially the same rate of methane formation as that in the steady state over the freshly reduced catalyst.
In a further experiment, the catalyst in the steady state was treated first by hydrogen for 30 minutes and then by helium for 30 minutes. Also, the steady‑state catalyst was treated in the reverse order : first by helium and then by hydrogen, each for 30 minutes. The rate of methane formation
is shown in Fig. 3. for each catalyst after these treatments. With the for‑
mer catalyst (curve 1), the rate of methane formation decreased with the time on stream of the reaction mixture to reach the level of the original steady state within 10 minutes. On the other hand, the latter catalyst (curve 2), showed a lower quasi‑steady rate than the original value, although the manner of decrease in the rate over the latter is similar to that over the
former.
Influences of hydrogen and helium flushing for water formation are shown in Fig. 4. After the steady‑state catalyst was treated by hydrogen for 30 minutes, the reaction mixture was admitted to the catalyst (curve 2).
Upon the introduction of the reactant mixture to the hydrogen‑treated catalyst immediate formation of water was observed. Then the rate of water formation gradually decreased with the time on stream of the reac‑
tant mixture to achieve the original steady state after 60 minutes. Although the feature of the water formation on the hydrogen‑treated catalyst was similar to that on the freshly reduced catalyst (curve 1), an appreciable
difference in the rate was observed between the both catalysts. Meanwhile,
the rate of water formation on the helium‑treated catalyst increased with the time on stream to obtain within 5 minutes a new quasi‑steady value which was much smaller than the original steady value (curve 3). This quasi‑steady state remained constant during‑ the course of reaction even for 60 minutes.
Similar experiments were carried out for carbon dioxide formation.
On the introduction of the reactant mixture after the steady‑state catalyst was flushed by hydrogen for 30 minutes, extremely fast carbon dioxide for‑
mation, estimated to be twice the original steady state value, was detected
(curve 2). The rate of carbon dioxide formation then decreased rapidly to
achieve the steady state within 50 minutes. The rate of carbon dioxide
CD1
( u j u l j 6 / a
│ o
∈ r i ) N O
│ i V
∑
∝ 0
﹂
? H U L O u ト V U
Hiroshige Matsumoto
I2 16
TIME(min)
Fig. 3. Methane formation after hydrogen‑helium and helium‑hydrogen
treatment of the catalyst in the steady state. (1) treated first by hydrogen for 30 minutes and second by helium for 30 mi‑
nutes, (2) treated first by helium for 30 minutes and second by hydrogen for 30 minutes.
( u i u j
‑ 6 / a j o u u r y
¥ N O I I V
∑
∝ 0
﹂ 0 2 H J O 山 1 V U
TIME(min)
Fig. 4. Water formation after hydrogen and helium treatment of the
catalyst in the steady state. (1) freshly reduced catalyst, (2) treated by hydrogen for 30 minutes, (3) treated by hell‑
um for 30 minutes.
formation on the freshly reduced catalyst slowly decreased to get the steady state within 60 minutes (curve 1). On the contrary, the rate of carbon di‑
oxide formation on the helium‑treated catalyst was about one half of the original steady state value (curve 3). On the introduction of the reactant mixture after the fresh catalyst was treated by helium for 30 minutes, a constant rate of carbon dioxide formation was observed. This catalyst treated by helium did not regain the original activity in carbon dioxide for‑
mation even by 120 minutes treatment with the reaction mixture.
Discussion
In our recent report (1), the deactivation of surface intermediate for methane formation by an inert gas treatment has been explained by the as‑
sumption that an intermediate of enol type on the iron is dehydrated to an inactive carbon species on the surface. Furthermore, we deduced in the previous work (4‑7) that surface carbon played an important role for the formation of active sites on the iron catalyst, but not as the actual reaction intermediate on the surface. The mechanism in the methanation on the iron catalyst was simply summarized by the following picture (4, 5) :
Fe Fe Fe Fe I(CO)
Fe Fe
!i C
Fe Fe
\ !̀' C
+ 2CO2
Hagg carbide (I) Active surface of the iron catalyst J (H2+CO)
H OH H OH H OH H OH
\/! \/
C
II
Fe
\ ・!
C
01とa C
ll
Fe iiI
iiP ea C
fI
Fe
ちi
surfaceintermediate(II (H2)(こe\+4H2。
CH4+ H2O Fe Fe
\ !!̀ ̄
C
CH4十H20 ‑C C
II II
Fe Fe Fe Fe
\// \/
c c
c C‑
II II
Fe Fe iZ!と;ii
C
Active surface of the iron (III) Inactive carbon species (IV)
iF
( u i u u 6 / む t o u r
* ) n o 一 ト V
∑
∝ 0 L Z o u L O U ト V
∝
Hiroshige Matsumoto
Fig. 5. Carbon dioxide formation after hydrogen and helium treatment of the catalyst in the steady state. (1) freshly reduced cata‑
lyst, (2) treated by hydrogen for 30 minutes, (3) treated by helium for 30 minutes.
( u i a i
‑ 6 / d
│ O
∈ r i u u も U U } D 3 J l む H J a U V も ) D J S A p D む I S i s D n r ) u
│ u o u d E L 0
﹂
^ H O
&
む l D
∝
Fig. 6. Relationship between the rate of methane formation in
quasi‑steady state and the amount of water formed
during helium treatment.
In accordance with the ideas described above, the rate of methane for‑
mation at the quasi‑steady state which results from the helium treatment of the steady‑state catalyst should be related closely to the amount of wa‑
ter removed from the surface during the helium treatment. The amounts of water removed by the helium treatments for 1, 5, 30 and 60 minutes were found to be 30.9, 70.2, 151.4 and 183.0 li mole/g, respectively. The relation‑
ship between the amount of water removed by the helium flushing and the quasi‑steady‑state rate of methane formation after the same helium treat‑
ment (Fig. 1) is shown in Fig. 6. With increasing the amount of water
removed from the surface, i.e., with increasing amount of the surface intermediate (II) dehydrated to an inactive carbon species (IV), the rate of methane formation at the quasi‑steady state decreased linearly. This evidence supports the deactivation mechanism described in the recent paper (1). In this respect, slow rates of water and carbon dioxide formation on the helium treated catalyst (curve 3 in Fig. 4 and curve 3 in Fig. 5, respec‑
tively) are presumably due to the decrease of the surface iron sites available for water and carbon dioxide formation by the formation of the inactive surface carbon species (IV) during the course of the helium treatment.
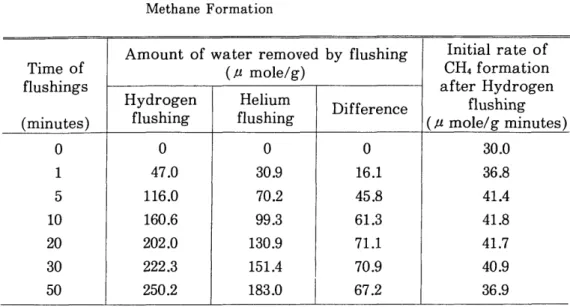
The initial enhancement in the rate of methane formation by the hydro‑
gen treatment (Fig. 2) is difficult to explain by the above picture. In the formation of Hagg carbide (I) which was considered to be the active surface of the iron catalyst in the previous paper, surface oxygen was also formed at an initial stage of the carburization process (1, 6). In the steady state of the reaction there must be steady‑state concentration of adsorbed hy‑
drogen, the intermediate (II), carbon species (IV), and oxygen (or hydroxyl groups) on the surface, and carbon monoxide, hydrogen, and reaction products in the gas phase. The hydrogen flushing may remove the surface oxygen (or hydroxyl groups) to increase temporarily the surface available for the intermediate (II) in comparison with that as steady state. Thus, the methane formation decreased rapidly to the original steady value (Fig.
2). In order to evaluate this speculation, the initial rate of methane forma‑
tion after the hydrogen flushing is compared in Table 1 with the amount of
water removed from the catalyst during the course of hydrogen and helium
flushing, where the initial rate has been obtained from the extrapolation of
logarithmic plot of the rates in Fig. 2 against time. Appreciable differences
in amount of removed water (the fourth column) were observed between by
the hydrogen flushing (the second column) and by the helium flushing (the
third column) for various periods of these flushings. If it can be postulated
20