Article type: Original article
Full Title: Interkinetic nuclear migration in the mouse embryonic ureteric epithelium: Possible implication for congenital anomalies of the kidney and urinary tract (CAKUT) First author’s surname: Motoya
Short Title: INM in the ureteric epithelium and CAKUT Full names of all authors:
Tomoyuki Motoya1, Noriko Ogawa1, Tetsuya Nitta1, Ashiq Mahmood Rafiq2, Esrat Jahan 1, Motohide Furuya1, Akihiro Matsumoto1, Jun Udagawa3, Hiroki Otani1
Address:
1: Department of Developmental Biology, Faculty of Medicine, Shimane University, 89-1 Enya-cho, Izumo, Shimane 693-8501, Japan
2: Center for the Promotion of Project Research, Organization for Research, Shimane University, 1060 Nishikawazu-cho, Matsue, Shimane 690-8504, Japan
3: Division of Anatomy and Cell Biology, Department of Anatomy, Shiga University of Medical Science, Seta Tsukinowa-cho, Otsu, Shiga 520-2192, Japan
Corresponding author: Hiroki Otani
Department of Developmental Biology, Faculty of Medicine, Shimane University, 89-1 Enya-cho, Izumo, Shimane 693-8501, Japan
e-mail: [email protected] Tel: (+81) 853-20-2101
Fax: (+81) 853-20-2100
This article has been accepted for publication and undergone full peer review but has not been through the copyediting, typesetting, pagination and proofreading process, which may lead to differences between this version and the Version of Record. Please cite this article as doi: 10.1111/cga.12150
Abstract
Interkinetic nuclear migration (INM) is a phenomenon in which progenitor cell nuclei migrate along the apico-basal axis of the pseudostratified epithelium, which is characterized by the presence of apical primary cilia, in synchrony with the cell cycle in a manner of apical mitosis. INM is suggested to regulate not only stem/progenitor cell proliferation/differentiation but also organ size and shape. INM has been reported in epithelia of both ectoderm and endoderm origin. We examined whether INM exists in the mesoderm-derived ureteric epithelium. At embryonic day (E) 11.5, E12.5 and E13.5, C57BL/6J mouse dams were injected with 5-bromo-2’-deoxyuridine (BrdU) and embryos were sacrificed 1, 2, 4, 6, 8, 10 and 12 hours later. We immunostained transverse sections of the ureter for BrdU, and measured the position of BrdU (+) nuclei in the ureteric epithelia along the apico-basal axis at each time point. We analyzed the distribution patterns of BrdU (+) nuclei in histograms using the multidimensional scaling. Changes in the nucleus distribution patterns suggested nucleus movement characteristic of INM in the ureteric epithelia, and the mode of INM varied throughout the ureter development. While apical primary cilia are related with INM by providing a centrosome for the apical mitosis, congenital anomalies of the kidney and urinary tract (CAKUT) include syndromes linked to primary ciliary dysfunction affecting epithelial tubular organs such as kidney, ureter, and brain. The present study showed that INM exists in the ureteric epithelium and suggests that INM may be related with the CAKUT etiology via primary ciliary protein function.
Keywords
Introduction
Interkinetic nuclear migration (INM) is an oscillatory nuclear movement tightly linked with cell cycle/proliferation/differentiation regulation of stem/progenitor cells in multiple epithelia. In INM, cell nuclei migrate along the apico-basal axis (AB axis) between the apical cytoplasmic processes extending to the luminal surface characterized by primary cilia and different levels of the basal side in the processes extended to the basal lamina. Nuclei migrate in a manner synchronous with the progression of the cell cycle, and thereby form a characteristic pseudostratified morphology of the epithelium (for review, see Miyata 2008; Taverna & Huttner 2010; Spear & Ericlson 2012a; Miyata et al. 2015). Whereas INM was first reported in the developmental process of the neural epithelium (Sauer 1936), INM or INM-like nuclear movement have been reported in various epithelia, including not only epithelia of ectoderm-origin such as the lens (Saito et al. 2003; Zwaan et al. 1969; Norden et al. 2009) and retina (Norden et al. 2009), but also those of endoderm-origin such as the liver bud (Bort et al. 2006) and intestine (Grosse et al. 2011). INM in the neuroepithelium has been extensively analyzed, initially using cytophotometry and H3-thymidine autoradiography (Fujita 1962), later (immuno) histochemistry for 5-bromo-2’-deoxyuridine (BrdU) and other nucleoside-analogues that are incorporated into the S phase nuclei (Takahashi et al. 1995; 1999), and recently advanced direct time-lapse video imaging of cultured epithelia (Noctor et al. 2001; Miyata et al. 2001). However, INM in the epithelia of endoderm-origin or those of mesoderm-origin have only been suggested based on the apical localization of mitosis and rough analysis of changes in the nuclear position (Sauer 1935; Fujita 1960; Bort et al. 2006; Grosse et al. 2011).
epithelium, and described precise cyclic changes in the nuclear distribution based on the mathematical analysis of BrdU immunostaining data (Yamada et al. 2013). In addition, we reported that the embryonic midgut of knockout mice of Ror2, a tyrosine kinase-type receptor for Wnt5a, exhibited disturbed convergent extension-like epithelial dysmorphology along the AB axis, as well as abnormal epithelial cell clumps without the AB polarity associated with cell cycle arrest, i.e. disrupted INM. The localization of these INM-disrupted cell clumps appeared to be closely related with a persistent vitelline duct, macroscopic malformation (Yamada et al. 2010). These findings suggest a causative relation between INM regulation and normal and abnormal organogenesis. Although we previously observed in the ureter a change in epithelial nuclear distribution suggestive of INM, we could not confirm the existence of INM in the ureter (Yamada et al. 2013). If present in the ureter, INM would also be related to organogenesis and congenital anomalies of the kidney and urinary tract (CAKUT). CAKUT are a broad spectrum of structural and functional disorders affecting the kidney and lower urinary tract, and range from asymptomatic malformations such as a double ureter to life-threatening conditions such as bilateral renal agenesis (for review, see dos Santos Jr. et al. 2014; Rodriguez et al. 2014; Caruana & Bertram 2015). During the last decade, primary ciliary dysfunction has been linked to a number of CAKUT syndromes in which multiple epithelial tubular organs are affected such as the liver, pancreas, and brain, in addition to the kidney (for review, see Rodriguez et al. 2014). Recently, cilia-dependent and cilia-independent functions of cilia proteins in development, homeostasis, and disease have been extensively studied (for review, see Gerdes et al. 2009; Vertii et al. 2015). Cilia proteins play multiple roles in the cell cycle and proliferation regulation (Vertii et al. 2015), suggesting a possible link among organs
affected in the syndromes via primary ciliary dysfunction. In INM, mitosis always occurs at the apical surface. The cell nuclei then migrate basally during the G1 phase. After the S phase at the basal side, the nuclei migrate back apically during the G2 phase, and divide to generate daughter cells at the apical surface (Tamai et al. 2007; Sugiyama et al. 2009; Kosodo et al. 2011). The apical localization of mitosis occurs due to the interphase-persistent apical localization of the primary cilia and the provision by the cilia of a centrosome for the mitotic spindle poles via its basal body and associated second centriole (Taverna & Huttner 2010; Spear & Erickson 2012b; see discussion). These findings suggest a pivotal role of primary cilia in INM and a possible link between INM defects due to primary ciliary dysfunction and CAKUT.
In the present study, we examined the developmental process of the ureteric epithelium and observed changes in the nuclear distribution consistent with INM as well as those in the mode of INM, i.e. the distribution/localization, speed and direction of nuclear kinetics, during the ureter development. We also discussed the significance of INM in the ureter in comparison with other epithelia as well as its possible relation with CAKUT via primary cilia.
Materials and Methods Animals
C57BL/6J mice (CLEA Japan, Tokyo, Japan) between 8 and 20 weeks of age were used. The mice were housed in the Department of Experimental Animals, Center for Integrated Research in Science at Shimane University. They were kept under conditions of constant temperature and humidity, and a controlled 12/12 hour (h) light/dark cycle. Single male and female mice were mated overnight in the same cage. Noon of the day when a vaginal plug was observed was defined as embryonic day (E) 0.5. This study was approved by the Ethics Committee for Animal Experimentation of Shimane University, and the animals were handled in accordance with the institutional guidelines.
Scanning electron microscopy (SEM)
Pregnant dams were sacrificed at E11.5 and embryos were collected. Embryos were fixed in 2% paraformaldehyde and 2% glutaraldehyde / 0.1 M phosphate buffer (PB), pH 7.2, overnight at 4ºC and post-fixed in 1% osmium tetroxide for 2 h followed by 1% tannic acid immersion for 2 h. After being washed in PB, they were again treated in 1% osmium tetroxide for 1 h. After an additional washing with PB and dehydration in a graded series of alcohol, the samples were placed into t-butyl alcohol and dried with a freeze-drying device (JFD-300; JEOL, Tokyo, Japan). They were then coated with gold by an ion sputter coater (VX-10; Eiko, Tokyo, Japan) and observed under a scanning electron microscope at 20 kV (JSM-6510; JEOL, Tokyo, Japan).
BrdU-labeling and immunohistochemistry
Pregnant dams at E11.5, E12.5, and E13.5 (n = 3 for each time point) were injected with BrdU (50 mg/kg, ip; SIGMA-Aldrich) and sacrificed 1, 2, 4, 6, 8, 10 and 12 h later to collect embryos (one embryo from each dam, in total 63 dams). The embryos were fixed with 10% formaldehyde / 70% methanol overnight at 4ºC and were dehydrated in a graded series of alcohol. Then these embryos were processed into paraffin blocks, and serially cross-sectioned at 5 μm. The sections were used for both immunohistochemistry and histological analyses (hematoxylin and eosin staining). The sections were deparaffinized and endogenous peroxidase activity was deactivated by incubating in 0.03% H2O2 / methanol. Then, antigen retrieval was performed in 2 N HCl for 30 min at room temperature. After blocking as described below, sections were stained with an anti-BrdU monoclonal antibody (BD Pharmingen, San Diego, CA), M.O.M. Immunodetection Kit (Vector Laboratories Inc., Burlingame, CA), and 3,3’-diaminobenzidine (DAB) chromogen (Invitrogen, Carlsbad, CA). Immunostaining for Caspase 3 (Casp3, Anti-Caspase3 antibody, abcam Plc) was also performed to visualize apoptosis. Cell nuclei were counterstained with hematoxylin. Immunofluorostaining for -tublin (Anti-gamma Tubulin antibody, abcam Plc) was performed to visualize primary cilia, and nuclei were stained with 4’,6-diamidino-2-phenylindole (DAPI, DOjin). Sections incubated without the primary antibodies served as negative controls. Blocking was performed using of M.O.M. Immunodetection Kit blocking solution for BrdU and -tublin, and 5% normal goat serum solution for Casp3, respectively.
Measurement of nuclear distribution along the apico-basal axis
The number and position of BrdU (+) nuclei between the apical and basal surfaces in the ureteric epithelium were measured in 5 m-thick serial sections at 30 m intervals using an original image analysis program. We set up the innermost loop at the apical surface, and the outermost loop at the basal surface. This program draws lines that divide the epithelium every 15 degrees, and lines that divide the epithelium into 6 concentric layers with equal width (from the basal side (L1) to the apical side (L6); Fig. 1). The numbers of BrdU (+) nuclei were counted using ImageJ (National Institutes of Health, Bethesda, Maryland, USA). We defined the nucleus position as the point of intersection of the maximum diameter and minimum diameter, and the position of all the cell nuclei counted were successfully separated into the layers. Counting BrdU (+) nuclei counted were 98-115 for E11.5, 90-146 for E12.5, and 106-215 for E13.5 per each time point. BrdU (+) nuclei were represented using a nuclear population histogram (%) showing averages plus SD. Mitotic figures were also observed to determine their location in the epithelium along the AB axis and the mitotic division axis relative to the AB axis.
Multidimensional scaling (MDS)
The patterns of histograms at each time point were analyzed by MDS. MDS is a method for the statistical analysis of multi-dimensional information; it mathematically explores similarities or dissimilarities among data sets in a large matrix, and represents them on a 2-dimensional graph (Johnson & Wichern 2007). Briefly, a set of data from each item is first computed as a distance matrix and then assigned to a location in 2-dimensional space, in which the first dimension is the most important for representing
the differences. MDS can thus visualize more easily similarities or dissimilarities among any phenomena, including developmental events (Merchant et al. 2008; Udagawa et al. 2010) such as BrdU (+) nuclear distribution patterns in the midgut epithelium (Yamada et al. 2013). In this study, as in Yamada et al. (2013), we interpreted changes in the distribution of BrdU (+) nuclei during the time course as reflecting the nuclear movement (see results for detail). To evaluate the success of the MDS analyses, the stress values were computed and all were found to be low enough for goodness criteria (Merchant et al. 2008). The IBM SPSS Statistics 22 package was used for MDS analysis.
Results
Pseudostratified morphology of the ureteric epithelium
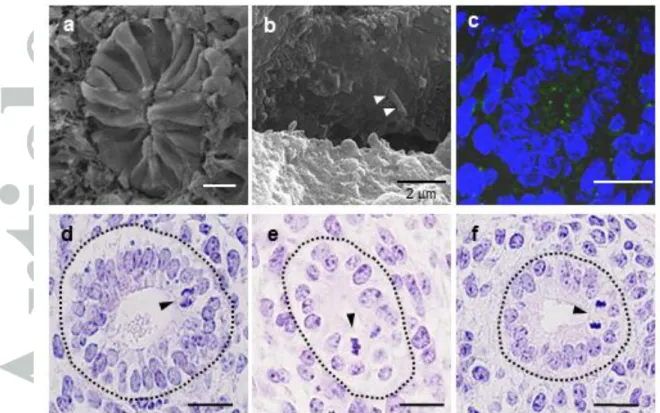
SEM images of cross-sectioned surfaces of the ureter at E11.5 showed columnar morphology of the epithelial cells (Fig. 2a). In the magnified views, primary cilia were observed on the apical surface of the cytoplasmic processes of epithelial cells (Fig. 2b). Light microscopic observation of the cross sections of the ureteric epithelium at E11.5, E12.5 and E13.5 (Fig. 2d, 2e, 2f) revealed that the nuclei were positioned at different levels along the AB axis of the epithelium. However, all of the mitotic figures were observed only at the apical surface (E11.5: 44 nuclei in 36 sections; E12.5: 47 nuclei in 41 sections; E13.5: 45 nuclei in 45 sections). Immunohistochemistry for -tubulin confirmed the presence of apical primary cilia (Fig. 2c). Together, these findings supported the notion that the ureteric epithelium is a pseudostratified epithelium, and suggested that INM exists in the ureteric epithelium. On the other hand, during the ureter development from E11.5 to E13.5, when the ureter elongates and the kidney is
“elevated” from the initial pelvic position to the lumbar position, both the diameter of the ureter and the number of layers of pseudostratified nuclei decreased, suggesting that the convergent extension-like mechanism reported in the midgut (Matsumoto et al. 2002; Yamada et al. 2010) could also be involved in the developing ureteric epithelium.
Change in BrdU-positive nuclei distribution along the AB axis in the ureteric epithelium
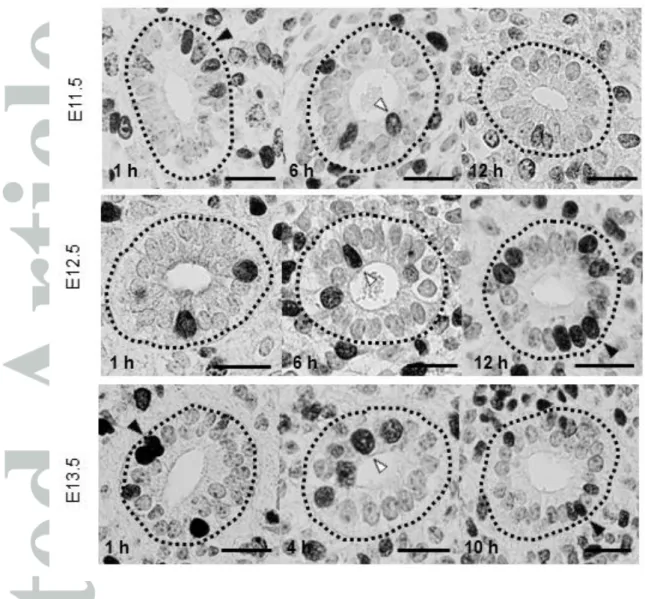
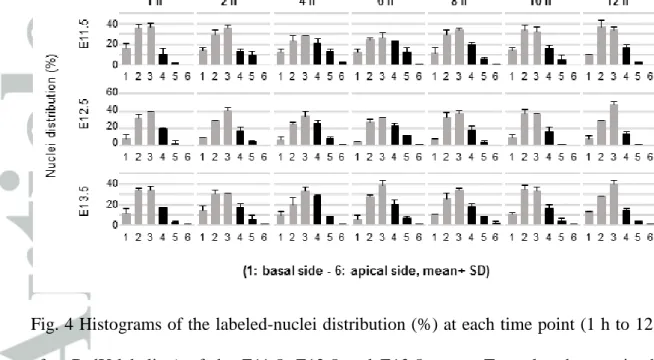
We next examined the existence of INM and its mode in the ureteric epithelium by BrdU-immunostaining and MDS analysis basically following the methods in Yamada et al. (2013). BrdU was injected at E11.5 to label cells in S phase, and the distribution of BrdU (+) nuclei in the ureteric epithelium was examined at 1, 2, 4, 6, 8, 10 and 12 h after injections. At 1 h after injection, the labeled nuclei were located more prominently in the basal side (Fig. 3, top row, left) of the epithelium. At the 4 h to 6 h time points, the percentages of labeled nuclei appeared to shift toward the more apical side (Fig. 3, top row, center). By 10 h to 12 h, the percentages of labeled nuclei in the apical-side layers decreased and those in the basal side again reached the initial levels (Fig. 3, top row, right), thus suggesting the migration of nuclei in the ureteric epithelium (Fig. 4, top row).
Then, MDS was applied to the BrdU (+) nuclei distribution data, and the nuclei distributions at seven time points were visualized by plotting them in two dimensions based on the similarities between the histogram patterns. The closer the two points on 2-dimensional graph, the more similar are the distribution patterns at the corresponding time points. Therefore, by connecting points on the graph chronologically starting from 1 h through 12 h, we can follow the chronological change in the nuclear distribution
pattern. Based on both the present microscopic observation that initially basal, then apical, finally basal again nuclear distribution (Figs. 3, 4) and the analogy with the previous clear circular MDS pattern of nuclear distribution change in the midgut (Yamada et al. 2013), we interpreted that dimension 1 corresponds the nuclear movement along the AB axis. Along the dimension 1 axis, 1 h, 10 h, and 12 h were plotted to the right (+) side of the graph and 4 h and 6 h were plotted on the left (-) side, while 2 h and 8 h were plotted near zero. By connecting the points chronologically, MDS revealed a to-and-fro shift in the BrdU (+) nuclei distribution along the dimension 1 axis (Fig. 5a). Thus, starting from 1 h, which corresponded to the S phase basal-sided distribution in the right dimension, the nuclei distribution pattern moved towards the left dimension till 6 h, which corresponded to the migration of a significant proportion of nuclei to the apical side during G2/M phase, and then returned by 12 h to the basal-sided distribution in the right dimension at a coordinate nearly the same as that at 1 h during G1 phase. Thus, from the histogram patterns and MDS data, the duration of the circular change in the BrdU (+) nuclei distribution, corresponding to the cell cycle length from E11.5 to E12.0, was estimated to be 10 h to 12 h.
From E12.5 to E13.0 (12 h later), the distribution change appeared less clear than from E11.5 to E12.0 (Fig. 4, middle row). However, at the 4 h and 6 h time points, the percentage of labeled nuclei was higher in the apical-side layers (L4, L5) than at 1 h and 2 h. At 8 h, 10 h and 12 h, the labeled nuclei increased in the basal-side layers while decreasing in the apical-side layers. MDS analysis again showed the shift in the nuclear distribution pattern from the right to the left dimension, during G2 phase, in 4 h and back to the right dimension by 8 h, the closest point to 1 h, indicating the overall oscillatory nuclear movement in the ureteric epithelium (Fig. 5b). The duration of the
circular change in BrdU (+) nuclei distribution, corresponding to the cell cycle length, from E12.5 to E13.0, was estimated to be 8 h to 12 h.
From E13.5 to E14.0, the change in the BrdU (+) nuclei distribution appeared even less clear than in the earlier stages. Whereas right-to-left shifts in the distribution were apparent from the time points of 2 h to 4 h at G2 phase, in addition to left-to-right shifts at 4 h to 6 h, a difference in the histogram pattern was not apparent among the other time points (Fig. 4, bottom row). MDS analysis confirmed the above tendency of the shift in the distribution pattern of BrdU (+) nuclei (Fig. 5c). A right-to-left shift from 2 h to 4 h and left-to-right shift from 4 h to 6 h were evident, while at the other time points, especially from 6 h to 10 h, the shift along the dimension 1 axis appeared to be complex, with a relatively large distance along dimension 2, suggesting certain different components in the histogram pattern at these time points. A leftward shift, albeit on a small scale, from 10 h, the closest point to 1 h, to 12 h suggested the beginning of the next cell cycle (Fig. 5c). Thus, the duration of the circular change in the BrdU (+) nuclei distribution, corresponding to the cell cycle length, from E13.5 to E14.0, was estimated to be 6 h to 10 h.
Mitotic division axis
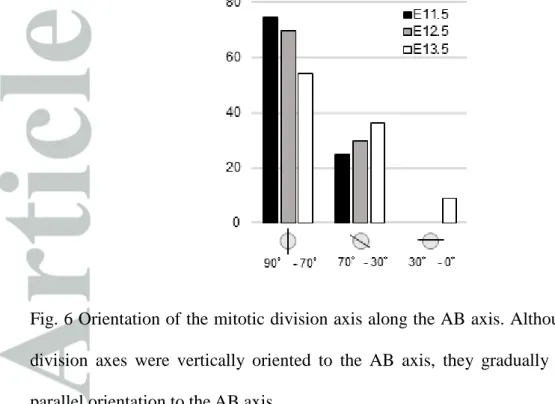
The mitotic division axis was mostly vertical to the AB axis, and thus parallel to the apical surface at E11.5. While the basic tendency remained the same at E12.5 and E13.5, the axis tended to gradually tilt toward a parallel orientation to the AB axis, and there were some divisions, albeit minor, parallel to the AB axis, perpendicular to the apical surface at E13.5 (Fig. 6). During the period observed in the present study, we observed very few, if any, apoptoses, either by light-microscopic observation of apoptotic bodies
or by immuno-positive staining against Casp3 (data not shown).
Discussion
INM in the mesoderm origin ureter epithelium
INM has been extensively studied in the neural epithelium and other epithelia of ectoderm origin using various methods, including the recently advanced direct time-lapse video imaging (for review, see Miyata 2008; Taverna & Huttner 2010; Willardsen & Link 2011; Spear & Ericlson 2012a; Kosodo 2012; Miyata et al. 2015). On the other hand, INM-like nuclear localization shift as well as apical-limited localization of mitotic figures have long been observed in many other epithelia, not only of endoderm and mesoderm origin in vertebrates, but also in epithelia of invertebrates (for review, see Spear & Erickson 2012a; Lee & Norden 2013). However, neither time-lapse video imaging nor detailed analysis of the nuclear migration has been documented for these epithelia of non-ectoderm origin. Therefore, whether INM and INM-like nuclear movements in various species, tissues, and developmental stages are similar or different remains largely unknown, as do the molecular mechanisms and biological significance (see below for further discussion).
For examining INM, BrdU-immunostaining and MDS analysis of changes in the BrdU (+) nuclei distribution (BrdU/MDS method) and other labeling-based statistical methods, when compared with direct time-lapse video imaging of the living tissue, is laborious and indirect relying on fixed histological samples. However, it has definite complementary merits over video imaging. First, data from the BrdU/MDS method indirectly but reflect the genuine in vivo situation, whereas the current video-imaging methods observe cultured tissue and thus cannot recreate the true in vivo conditions.
Second, while data from current video imaging only represent the behavior of randomly selected individual nuclei, and thus cannot reveal the global picture across the entire epithelium, the BrdU/MDS method can statistically analyze a large number of nuclei from the entire epithelium within the tissue. This makes it possible to detect differences in the INM mode genuine in vivo condition between different tissues, parts of organs, or developmental stages, as discussed below, as well as between normal and abnormal conditions such as in gene-knockout or post-drug treatment conditions.
Yamada et al. (2013) reported the detailed kinetics in the nuclear shift in the normal mouse embryonic midgut epithelium using the BrdU/MDS method. Theirs was the first and, to our knowledge, the only study to examine the detailed mode of INM in endoderm-origin epithelia. In the present study, using the same BrdU/MDS method, we analyzed in detail the ureteric epithelium of mesoderm origin, and revealed that the circular change in the BrdU (+) nuclei distribution was in synchrony with the cell cycle, which is consistent with the existence of INM. To our knowledge this is the first report that confirmed the occurrence of INM in an epithelium of mesoderm origin and provided a detailed analysis of the mode of INM during ureter development.
Variations in the INM mode during ureter development and in different organs
The present study not only revealed circular changes in the BrdU (+) nuclei distribution in the ureter but also suggested differences in the overall kinetics in the nuclear shift between different stages of development in the mouse embryonic ureter. One cycle of nuclear movement from basal to apical to basal spanned 10 h to 12 h from E11.5 to E12.0, 8 h to 12 h from E12.5 to E13.0, and 6 h to 10 h from E13.5 to E14.0, indicating that the nuclear movement cycle tends to shorten during development. With respect to
the MDS data, a right-to-left shift, which corresponded to a shift from basal-to-apical nuclei movement during the G2 phase, remained 4 h in duration in all stages. On the other hand, whereas nuclei stayed at the apical-most position for 2 h (i.e., from 4 h to 6 h) in the E11.5 and E12.5 cycles, in the E13.5 cycle, the nuclei moved from left to right, in the apical to basal direction, from 4 h to 6 h. Further, while in the E11.5 and E12.5 cycles, the left-to-right shift continued till 12 h, in the E13.5 cycle, from 6 h onward, the nuclear shift was not so straightforward, but complex. In the present study, although virtually all mitotic figures were observed at the apical surface, the cell division axis tilted from vertical to the AB axis to a more parallel orientation during development. Since cell division axis regulation is implicated in daughter-cell fates, proliferation/differentiation (Kosodo 2004; Konno et al. 2008; for review, see Fish et al. 2008; Lu & Johnston 2013), this change in oriented cell division may be related with the complex pattern from 6 h to 10 h in the MDS of the E13.5 cycle. Yamada et al. (2013) reported that, in the mouse embryonic midgut epithelium, the cell cycle was estimated to be 12 h at E11.5, and 10 h at E12.5, and that the apical-to-basal migration became shorter at E12.5, whereas the basal-to-apical migration spanned up to 6 h at both time points, while. In the mouse embryonic cerebral wall, detailed BrdU-labeling analyses revealed the cell cycle phase duration in the pseudostratified ventricular epithelium (PVE) (Takahashi et al. 1995; for review, see Mitsuhashi & Takahashi 2009). In the PVE, the length of the cell cycle increased from 8.1 to 18.4 h between E11 and E16. Whereas the G2/M phase remained constant for 2 h and the S phase varied unsystematically at around 4 h, the G1 phase progressively increased from 3.2 h at E11 to 12.4 h at E16. These findings suggest both a similarity in the S/G2/M phase length among these organs and a dissimilarity in the G1 phase, suggesting a corresponding
similarity and dissimilarity in the molecular mechanisms involved. Several different models have been proposed to describe the molecular mechanisms of INM, mainly based on data from studies on the developing vertebrate brain or retina (for review, see Kosodo 2012). Microtubule-dynein motor and/or actomyosin systems have been suggested to play roles in the basal-to-apical linear migration in the G2 phase. On the other hand, not only active autonomous models based on kinesin or actomyosin systems but also passive stochastic or displacement mechanisms by apically migrating G2 phase nuclei have been proposed for the apical-to-basal G1 phase movement (Kosodo et al. 2011). In the epithelia of endoderm or mesoderm origin, the molecular mechanisms of INM remain almost totally unproved. Grosse et al. (2011) reported that while growth in epithelial girth is driven by microtubule- and actomyosin-dependent elongation along the AB axis, microtubule or actomyosin inhibitors did not greatly disturb INM. The present study revealed that INM modes/duration are similar in the apical movement during G2/M phase among the ureter and neocortex as well as the midgut, suggesting that a similar basic mechanism is operative. On the other hand, in the basal movement during the G1 phase, differences were observed between time points and between organs, suggesting that the molecular mechanisms are also different. This discrepancy between the constant G2/M mode and variable G1 mode appears against a simple passive displacement model. Further, while in general the apical nuclear movement is quicker than the basal movement in mice, the basal movement is quicker than the apical movement in ferrets (Okamoto et al. 2014). Therefore, the molecular mechanisms of INM may differ or be modified depending on many conditions. These fine regulations of INM may make it possible to precisely regulate the stem/progenitor cell generation, which in turn would regulate the daughter cell number and the resultant regional size
and shape of organs (for review, see Bond & Woods 2006; Fish et al. 2008; Mitsuhashi & Takahashi 2009; Kosodo 2012).
Primary cilia as a possible link between INM and ciliopathies in CAKUT
Primary cilia, as observed on the apical surface of the mouse embryonic ureteric epithelium, are ubiquitously present in almost all vertebrate cell types. During interphase, the primary cilium is localized at the apical surface of the apical cytoplasmic process of the pseudostratified epithelium, and provides centrosomes for mitotic spindle poles during M phase via its basal body and associated second centriole. To equip the spindle poles in M phase, nuclei must migrate to the apical end during G2 phase, which is consistent with INM, and a microtubule/centrosome-dependent mechanism has been proposed for the apical nuclear migration (Tsai et al. 2010; Tamai et al. 2007; for review, see Miyata 2008). During the last decade or so, in addition to cilia-dependent roles, cilia-independent functions of cilia proteins at non-cilia sites including centrosomes have been reported (for review, see Vertii et al. 2015). These cilia-independent functions include spindle orientation, cytokinesis, cell proliferation, cell cycle progression, and checkpoint control, which are directly or indirectly related with INM and the dysfunction may contribute to the pathogenesis of ciliopathy (for review, see Hildebrandt et al. 2011). In the brain, an increasing number of genes related to the microtubule/centrosome system and thus with INM have been implicated in the pathogenesis of microcephaly, suggesting that INM is involved in the brain histogenesis (Feng & Walsh 2004; Rujano et al. 2013; for review, see Bond & Woods 2006; Kosodo et al. 2011; Kosodo 2012; Reiner et al. 2012).
linked to a number of diseases, the so-called nonmotile ciliopathy, including many CAKUT syndromes. In these syndromes, multiple epithelial tubular organs are affected, such as the kidney, ureter, liver, pancreas, and brain. Although precise mechanisms by which these multiple epithelial tubular tissues are affected remain to be clarified, the pathogenesis of at least some of the ciliopathies in CAKUT may be linked with INM observed in the present study via apical primary cilia and cytoskeleton-related regulatory mechanisms of the cell cycle and proliferation/differentiation.
Acknowledgments
We thank Ms. Y Takeda and Mr. T Yoneyama for their technical help. This work was supported by MEXT KAKENHI Grant Number 23112006.
Disclosure
References
Bond J, Woods CG. 2006. Cytoskeletal genes regulating brain size. Curr Opi Cell Biol
18: 95-101.
Bort R, Signore M, Tremblay K, Martinez Barbera JP, Zaret KS. 2006. Hex homeobox gene controls the transition of the endoderm to a pseudostratified, cell emergent epithelium for liver bud development. Dev Biol 290: 44-56.
Caruana G, Bertram JF. 2015. Congenital anomalies of the kidney and urinary tract genetics in mice and men. Nephrology 20: 309-311.
dos Santos Junior AC, Miranda DM, Simoes Silva AC. 2014. Congenital anomalies of the kidney and urinary tract: an embryogenetic review. Birth Defect Res (Part C) 102: 374-81.
Feng Y, Walsh CA. 2004. Mitotic spindle regulation by Nde1 controls cerebral cortical size. Neuron 44: 279-293.
Fish JL, Dehay C, Kennedy H, Huttner WB. 2008. Making bigger brains-the evolution of neural-progenitor-cell division. J Cell Sci 121: 2783-93.
Fujita S. 1960. Mitotic pattern and histogenesis of the central nervous system. Nature
185: 702-703.
Fujita S. 1962. Kinetics of cellular proliferation. Exp Cell Res 28: 52-60.
Gerdes JM, Davis EE, Katsanis N. 2009. The vertebrate primary cilium in development, homeostasis, and disease. Cell 137: 32-45.
Grosse AS, Pressprich MF, Curley LB, Hamilton KL, Margolis B, Hildebrand JD, Gumucio DL. 2011. Cell dynamics in fetal intestinal epithelium: implications for intestinal growth and morphogenesis. Development 138: 4423-4432.
Hildebrandt F, Benzing T, Katsanis N. 2011. Ciliopathies. N Eng J Med 364: 1533-1543. Johnson RA, Wichern DW. 2007. Applied multivariate statistical analysis. 6th Edition. Upper Saddle River.
Konno D, Shioi G, Shitamukai A et al. 2008. Neuroepithelial progenitors undergo LGN-dependent planar divisions to maintain self-renewability during mammalian neurogenesis. Nat Cell Biol 10: 93-101.
Kosodo Y. 2004. Asymmetric distribution of the apical plasma membrane during neurogenic divisions of mammalian neuroepithelial cells. EMBO J 23: 2314-2324. Kosodo Y, Suetsugu T, Suda M et al. 2011. Regulation of interkinetic nuclear migration by cell cycle‐coupled active and passive mechanisms in the developing brain. 2011.
EMBO J 30: 1690-704.
Kosodo Y. 2012. Interkinetic nuclear migration: beyond a hallmark of neurogenesis. Cell Mol Life Sci 69: 2727-2738.
Lee HO, Norden C. 2013. Mechanisms controlling arrangements and movements of nuclei in pseudostratified epithelia. Trends Cell Biol 23: 141-150.
Lu MS, Johnston CA. 2013. Molecular pathways regulating mitotic spindle orientation in animal cells. Development 140: 1843-1856.
Merchant H, Zarco W, Bartolo R, Prado L. 2008. The context of temporal processing is represented in the multidimensional relationships between timing tasks. PloS one 3: e3169.
Matsumoto A, Hashimoto K, Yoshioka T, Otani H. 2002. Occlusion and subsequent re-canalization in early duodenal development of human embryos: integrated organogenesis and histogenesis through a possible epithelial-mesenchymal interaction. Anat Embryol 205: 53-65.
Mitsuhashi T, Takahashi T. 2009. Genetic regulation of proliferation/differentiation characteristics of neural progenitor cells in the developing neocortex. Brain & Dev 31: 553-557.
Miyata T. 2008. Development of three-dimensional architecture of the neuroepithelium: role of pseudostratification and cellular ‘community’. Develop Growth Differ 50: S105-S112.
Miyata T, Kawaguchi A, Okano H, Ogawa M. 2001. Asymmetric inheritance of radial glial fibers by cortical neurons. Neuron 31: 727-41.
Miyata T, Okamoto M, Shinoda T, Kawaguchi A. 2015. Interkinetic nuclear migration generates and opposes ventricular-zone crowding: insight into tissue mechanics. Front Cell Neurosci 8: 473.
Noctor SC, Flint AC, Weissman TA, Dammerman RS, Kriegstein AR. 2001. Neurons derived from radial glial cells establish radial units in neocortex. Nature 409: 714-20. Norden C, Young S, Link BA, Harris WA. 2009. Actomyosin is the main driver of interkinetic nuclear migration in the retina. Cell 138: 1195-208.
Okamoto M, Shinoda T, Kawaue T, Nagasaka A, Miyata T. 2014. Ferret-mouse differences in interkinetic nuclear migration and cellular densification in the neocortical ventricular zone. Neurosci Res 86: 88-95.
Reiner O, Sapir T, Gerlitz G. 2012. Interkinetic nuclear movement in the ventricular zone of the cortex. J. Mol. Neurosci 46: 516-26.
Rodriguez MM. 2014. Congenital anomalies of the kidney and the urinary tract (CAKUT). Fetal Pediatr Pathol 33: 293-320.
Rujano MA, Sanchez-Pulido L, Pennetier C, le Dez G, Basto R. 2013. The microcephaly protein Asp regulates neuroepithelium morphogenesis by controlling the spatial distribution of myosin II. Nat Cell Biol 15: 1294-306.
Saito K, Kawaguchi A, Kashiwagi S, Yasugi S, Ogawa M, Miyata T. 2003. Morphological asymmetry in dividing retinal progenitor cells. Dev Growth Differ 45: 219-29.
Sauer FC. 1935. Mitosis in the neural tube. J Comp Neurol 62: 377-405.
Sauer FC. 1936. The interkinetic migration of embryonic epithelial nuclei. J Morphol
60: 1-11.
Spear PC, Erickson CA. 2012a. Interkinetic nuclear migration: a mysterious process in search of a function. Dev Growth Differ 54: 306-316.
Spear PC, Erickson CA. 2012b. Apical movement during interkinetic nuclear migration is a two-step process. Devl Biol 370: 33-41.
Sugiyama M, Sakaue-Sawano A, Iimura T et al. 2009. Illuminating cell-cycle progression in the developing zebrafish embryo. Proc Natl Acad Sci USA 106: 20812-7. Takahashi T, Nowakowski RS, Caviness VS. 1995. The Cell-Cycle of the Pseudostratified Ventricular Epithelium of the Embryonic Murine Cerebral Wall. J Neurosci 15: 6046-6057
Takahashi T, Goto T, Miyama S, Nowakowski RS, Caviness VS. 1999. Sequence of neuron origin and neocortical laminar fate: Relation to cell cycle of origin in the developing murine cerebral wall. J Neurosci 19: 10357-10371
Tamai H, Shinohara H, Miyata T et al. 2007. Pax6 transcription factor is required for the interkinetic nuclear movement of neuroepithelial cells. Genes Cells 12: 983-996.
Taverna E, Huttner WB. 2010. Neural progenitor nuclei in motion. Neuron 67: 906-914. Tsai JW, Lian WN, Kemal S, Kriegstein AR, Vallee RB. 2010. An unconventional kinesin and cytoplasmic dynein are responsible for interkinetic nuclear migration in neural stem cells. Nat Neurosci 13: 1463-71.
Udagawa J, Yasuda A, Naito K, Otani H. 2010. Analysis of the harmonized growth pattern of fetal organs by multidimensional scaling and hierarchical clustering. Congenit Anom 50: 175-185.
Vertii A, Bright A, Delavai B, Hehnly H, Doxsey S. 2015. New frontiers: discovering cilia-independent functions of cilia proteins. EMBO Reports 16: 1275-1287.
Willardsen MI, Link BA. 2011. Cell biological regulation of division fate in vertebrate neuroepithelial cells. Dev Dyn 240: 1865-79.
Yamada M, Udagawa J, Hashimoto R, Matsumoto A, Hatta T, Otani H. 2013. Interkinetic nuclear migration during early development of midgut and ureteric epithelia. Anat Sci Int 88: 31-7.
Yamada M, Udagawa J, Matsumoto A et al. 2010. Ror2 is required for midgut elongation during mouse development. Dev Dyn 239: 941-53.
Zwaan J, Bryan PR, Jun, Pearce TL. 1969. Interkinetic nuclear migration during the early stages of lens formation in the chicken embryo. J Embryol Exp Morphol 21: 71-83.
Fig. 1 Measurement of the nuclear position in the ureteric epithelium using an image analysis program. The position of the nucleus corresponds to the relative distance between the basement membrane (BM) and apical surface (AS). The epithelial area was divided into six layers of equal width as in the left panel. Then, BrdU-positive nuclei in each layer were counted (white dots at the center of the nuclei). The right panel shows the nuclei distribution (layer (L) 1: 0, L2: 2, L3: 3, L4: 1, L5: 0, L6: 0).
Fig. 2 SEM (a, b) and light microscopy -tubulin immunostaining (c, green) and HE staining (d-f) images of pseudostratified epithelia in the middle part of the developing ureter. Cross-sectioned ureteric epithelium at E11.5 (d), E12.5 (e) and E13.5 (f). Epithelial cells spanned from the basement membrane to the apical (luminal) surface of the tube. White arrowheads in b (magnified view of the lumen) indicate a primary cilium at the apical surface of the epithelium. Black arrowheads indicate typical mitotic figures. Bars in a, c-f: 20 m; panels d-f are at the same magnification.
Fig. 3 Images of BrdU-labeled ureteric epithelial cells. Black arrowheads represent typical basally positioned cells with BrdU, whereas white arrowheads indicate typical apically positioned cells. Top: cross-sectioned ureteric epithelia at E11.5 (1 h, 6 h and 12 h after BrdU labeling). Middle: ureteric epithelia at E12.5 (1 h, 6 h and 12 h). Bottom: ureteric epithelia at E13.5 (1 h, 4 h and 10 h). The basal membrane is represented with dotted lines for clarification. Bars: 20 m.
Fig. 4 Histograms of the labeled-nuclei distribution (%) at each time point (1 h to 12 h after BrdU-labeling) of the E11.5, E12.5 and E13.5 ureter. To make changes in the nuclear distribution pattern more clearly discernible, histograms of the apical layers, i.e. L4, L5, L6, are shown in black.
Fig. 5 Two-dimensional representation of the nuclear distribution pattern in the ureteric epithelium at seven time points in the E11.5 (a), E12.5 (b) and E13.5 (c) periods as analyzed by multidimensional scaling (MDS). The basal side-to-apical side movements are represented with arrows, and the apical side-to-basal side movements are represented with dotted arrows.
Fig. 6 Orientation of the mitotic division axis along the AB axis. Although most of the division axes were vertically oriented to the AB axis, they gradually tilted toward a parallel orientation to the AB axis.