Financing Structure and Bank Loan Access of
SMEs in China : An Empirical Analysis*
M
Masanori Okura
1
Introduction
S
r
n
a
l
tionship between the company and financial intermediaries, the availability of collateral, the efficiency and competitiveness of financial intermediaries,
and the emcacy of the legal and judicial systems to protect claims. AgalnSt
the backdrop of high intermediation costs owing to institutional
underde-velopment, SMEs in developing countries tend to rely on informal
financ-ing sources such as family and friends.
Along with this sort of problem that is generally obseⅣed in developing
countries, it should be noted that China, having gradually transitioned to a
market oriented economy from a planned one, is still lagging behind in the
economically rational allocation of capital. During the period of strong
eco-nomic growth since the initiation of ecoeco-nomic reforms and opening up to
the outside, China has succeeded in mobilizing financial resources, and the financial deepening, measured in terms of money supply relative to GDP, has reached an impressive high level comparable to those of advancedcountries. However, the capital allocation of China's financial institutions, dominated by the four major State-OVmed commercial banks, has been
dis-torted for the state-owned sector, and the financial deepening, as excep-tional as it is, has not necessary contributed to the economic growth
(Boyreau-Debray 2003).1 Thus, in spite of its recent dramatic economic
development, China still has aspects of both a developing and a transitional economy.
In this paper, we observe the financing patterns of SMEs in China, and
then examine bank loanaccess of SMEs by conducting an empirical
analy-sis using the World Bank'S "ICS-Investment Ckmate SuⅣey : China 2003"
(hereafter, "ICS China 2003").
1 0n the issue of resource allocation by the bankir唱SeCtOr, See for example Ferry
Financlng Structure and Bank Loan Access of SMEs in China : An EmplrlCal AnalysIS 3
In the area of corporate finance, Fazzari, Hubbard and Petersen (1988)
led the way in conducting research on financing constraints. In conducting
emplrical research to relate financial access of a companywith its
attrib-utes, the first task is to discern whether the company is subject tofinanc-ing constraints. Beck et al. (2006) probed constrainfinanc-ing factors by usfinanc-ing the
World Bank's uruque firm-level survey database where a firm is asked
whether it is financially constrained. They conclude that companies that are younger, smaller, and domestic-Owned sense higher financing obstacles. In this analysis we examine just the relationship between financlng
Pat-terns and company attributes. However, since many Chinese SMEs appear
to be more or less confronting financing constraints, obsemng the
rela-tionship between financing patterns, ln Particular bank financing, and
com-pany attributes should beinstructive in understanding the financial access
of various types of SMEs.
The paper also investigates the relationship between the access to gov-ernment assistance in bank financing and company attributes. Credit guar-antees could be one important government assistance that would lessen
credit market imperfections for SMEs which do not have sufficient collat-eral. In China, providing collateral is an extremely important condition for
receiⅥng bank loans, but because privately run companies often operate
by borrowing land usage rights, it is difficult for them to provide valid
col-lateral (Tong 2003). It must be one important question what kind of firmsis likely to take advantage of the govermnent assistanceinobtaining bank
loans.
In Section II below, we brieny review the literature focusing on the
rela-tionship between the financing patterns and firm ownership, location, and
cities using "ICS China 2003" database. In Section IV we conduct
regres-sion analysis to address the issues concerning the access of SMEs to bank
loans and government financing assistance. Finally, we summarize our find-ings in Section V.
II The state of SME finance in China : literature survey
The interests of policy makers as well as researchers in promoting
pri-vate SMEs are reflected in the recent growing number of studies surveying
financing conditions of SMEs, although we have to still wait for a
country-wide suⅣey or census dealing with丘nanclng pattemS Of SMEs. In this sec-tion, we brieny suⅣey the literature to obseⅣe the relationship between
SME financing patterns and enterprise attributes, such as ownership,
loca-Lion, and size.
(1) ownership and丘nancing patterns
Lin et al. (2003)2 shows that the major financing source of working capi-tal as well as investment capicapi-tal is self-owned capicapi-tal for about
three-quarters of all sample companies, and suggests that the SMEs have faced
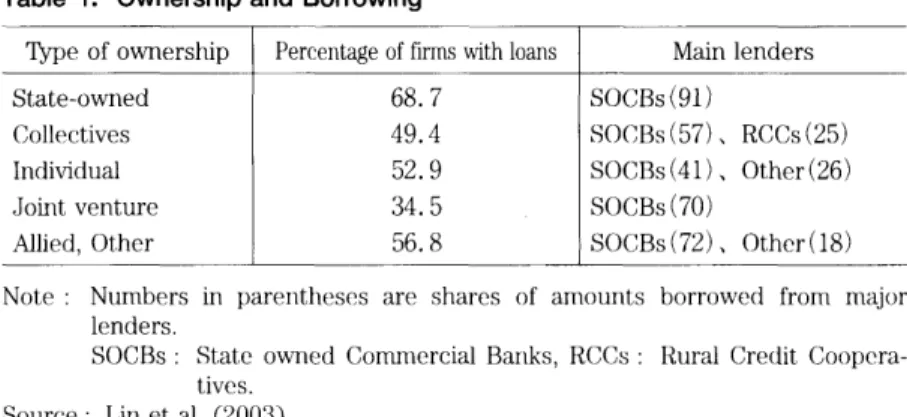
significant difficulties in borrowing external funds. Table 1 shows the
pro-portion of firmswith loans by the ownership, and the main lenders of
these loans.3 The ownership appears to have an important effect on SME'S
2 Their resultJs are based on the suⅣey, conducted in 2000, ()ver 3,027 SMEs in
seven provinces (Beijing, Liaoning, Jiangsu, Zhejiang, Hubei, Guangdong, and Yul卜
nall).
3 This study divides financialinstitutions into statel0WIled commercial banks,
joint-stock commercial banks, city commercial banks, foreign banks, urban credit coop-eratives, rllral credit c。()I)coop-eratives, investment trust companies, alld "other"
Financlng Structure and Bank Loan Access of SMEs in China : An EmplricaJ AnalysIS 5
Table 1. Ownership and Borrowing
TypeofowⅠ1erShip W&6V蹤vVfラ7v友Mainlenders State-oⅥmed 田ゅrSOCBs(91) CollectiVes 鼎偵BS()(〕Bs(57)、RCCs(25) ⅠndiVidual 鉄"纈SOCBs(41)、Other(26) JointVenture B絣SOCBs(70) Allied,Other 鉄b繧SOCBs(72)、Other(18)
Note : Numbers in parenthcscs are shares of amounts borrowed from major lenders.
SOCBs : State owlled CoITmerCial Barlks, RCCs : Rural Credit
Co()pera-tives.
Source : Liれ et al. (2003).
access to loans. While 68.7% of state-oⅥ一ed enterprises use loans, the
pro-portion is 49.4% for collective enterprises and 52.9% for private
ellter-prises. As for the types of financial institutions supplying funds, the state-Owned commercial banks account for 91% of state-owlled enterprlSe
bor-rowing, an overwhelmingly high percentage. The statedl0WIled commercial
banks also account for the greatest proportion of loans at collective enter-prises and individuals, although rural credit cooperatives also play a part irlcollective financing. The individual ownership firms depend on non-financial
institutions to finance roughly one-quarter of the whole borrowing. To sum
up, compared t。 state-owned enterprlSeS, COllective enterprlSeS alld
illdi-viduals are less reliant on external capital. The four major State-OWned
co…ercial banks are dominallt financial iIIStitutions in formal credit
mar-kets to SMEs. On the other hand, city commercial banks and urban credit
cooperatives have been marginal players in SME financing.
(2) IJOCation and financing patterns
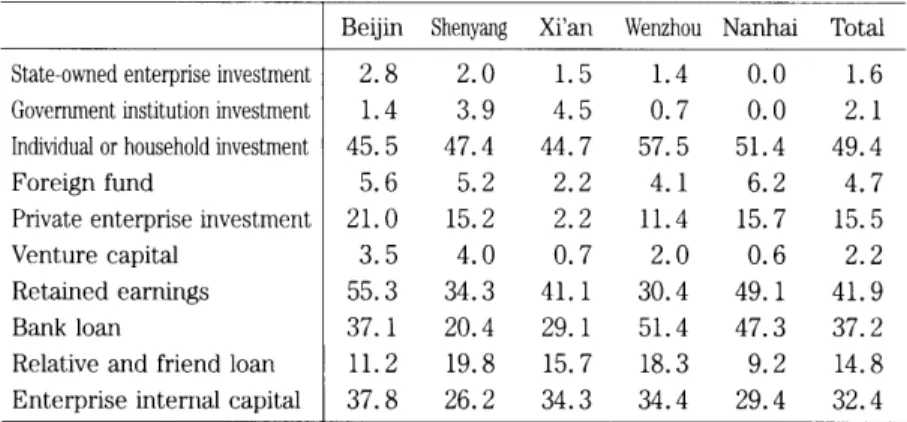
The ADB (2003)4 reports the financing sources of private SMEs located
table 2, the average proportions of financlng sources for all enterprisesin
five cities are (in order from highest to lowest) : personal and family
capi-tal (49.4%), internal reseⅣes (41.9%), bank loans (37.2%), and internal capital (32.4%). We can obseⅣe that the proportion of bank loans varied
more than 30 percentage points between Wenzhou on the coast (51.4%)
and Shenyang in the northeast (20.4%).
Table 3 reports the proportion of capital requirements covered by bank
loans. As for the five-city average, 44.1% of all enterprises derive less than lO% of their required capital from bank loans, and 21.8% of enterprises obtain 10-50% from bank loans. It is only 3.90/o of all enterprises which de-rive more than 50% of required capital from bank loans. The table also
confirms a distinction among these five cities. The proportion of
enter-Table 2. Major financlng SOurCeS for Private Enterprises
BeijinShenyangXi'anWenzhouNanhaiTotal State-ownedenterpriseinVestment 繝"經紊綯
GoVementhstitutioninVestment 紊2纉B經縱"
ⅠndiVidualorhouseholdhVestment 鼎R經Cr紊CB縱Sr經S紊C偵B Foreign fund 迭緜R"BbB縒 PriVateenterprlSeinVestment R"紊R縱R絣 Venturecapital 經B縱"緜" RetahedearⅠ1mgS 鉄R3BC3紊C偵C纈 Bankloan r#紊#偵S紊Cr3r RelatiVeandfriendloan 免ツ偵R縱ゅ3偵#B繧 EnterprlSeinternalcapital r繝#b3B3B紊#偵C3"紕Note : The data shows the proportion of enterprlSeS that chose the relevant item as one of the three major financlng sources.
Source : ADB (2003), Table A2.15.
4 This survey was conducted in 2001. These five cities were selected taking into
consideration differences in the openness of local economies and in the status of
Financlng Structure and Bank Loan Access of SMEs in China : An Empirical AnalysIS 7
Table 3. Propor'tion of Bank Loans in Required Capital
Beijln Shenyang Xi'an Wenzhou Nanhai
Source : ADB (2003), Table A2.16.
prises that cover more than lO% of their capital requirements with bank
loans is less than 200/o in Shenyang and Xian, but it is roughly 40% in
Wen-zhou.
We have observed a regional difference in the financing environment for
private enterprlSeS. In Wenzhou, where the prlVate Sector has most
deve1-0ped across the country, bank financlng accounts for a higher proportion of required capital. This suggests that the supply side of financing private
SMEs has also more developed in Wenzhou, seemingly keeping pace with
the development of private enterprlSeS.5
(3) Firm size and financing patterns
Lin et al (2005) is a suⅣey of 491 private enterprises in Guangdong
Province, and provide us with valuable information on the relationship be-tween the firm size and financing patterns.6
As for the average of 491 enterprises, intemal capital (the sum of capital, retained earnings, and internal contributions7) and bank loans account for 42.80/o and 36.80/o of total financing, respectively (table 4). Looking at the
5 Xuan and Okura (2006) reports that the share of private enterprises and indi-viduals in total loans of financial institutions is significantly higher in Zhejiang than
in other provinces in 2004.
6 The survey is also fairly new, having been conducted aHhe end of 2004.
Table 4. Financlng Patterns of Private Enterprises in Guangdong Province Numberof enterprlSeS 賑CヨVFF妨DWGGW'Cヲ匁觀yf6ノ~ニWf蹤V55ィョラUCv逞2
All 鼎36.819.521.820.20.70.90.0 Manufacturlng 途41.721.518.617.20.60.40.0 Byassetsize lessthan5rrd. 塔"26.313.340.313.51.54.50.5 5-10mil. 鉄B17.821.638.014.21.66.70.2 10-30mi1. B14.319.233.725.91.35.40.1 30-50mil. 鉄22.319.236.616.92.72.10.0 50-100ⅠT山. 都19.521.226.728.21.82.40.0 100血1.andaboVe 338.719.420.819.80.60.70.0 Source : Lin et al (2005), Table 2,3,5,8.
breakdoⅥ1 by the enterprise size, We can see that enterprises with 10 miL
lion to 30 million yuan in total assets have the highest proportion of inter-nal capital and the lowest proportion of bank loans. It is an interesting fact that the proportion of bank loans is rather high for the smallest enterprises. It seems to be that the high proportion of bank loans for this class of firms is a reflection of limited availability of retained eamings and trade credit.8 The enterprises with less than 30 million yuans in total assets use the pri-vate loan as one of nonnegligible financing sources. On the other hand, the enterprises with 30 million and over yuans in total assets have a higher proportion of bank loans, and rely less heavily on private loans. The pro-portion of formal financing increases as enterprise size becomes larger, and
this is consistent with the situation that is generally obseⅣed in other countries.
8 As shoⅥ1 by the I,able, the proportion of bank financing is more than 40`yo in t,he
Financlng Structure and Bank Loan Access of SMEs in China : An Emplrical Analysts g
ⅠⅠI Financing patterns of SMEs : analysis uslng "ICS China
2003''
We examine the financlng Patterns Of China'S SMEs using "ICS China
2003" database. This suⅣey, conducted in 2003, covers 2,400 enterprises
in the 18 cities listedinAppendix. The raw data provides fairly detailed
variables concerning firm characteristics, business performance, relations
with stakeholders, and business environment.9
Dollar et al (2003a, 2003b) and World Bank (2004), representing earlier
research based on this survey, address awide range of issues concernlng
the business climate,including physical infrastructure, domestic barriers to
entry, skills and technology, labor market elasticity, access to financlng, and tax burdens. However, the wealth of information collected has still to be fully utilized, Our followlng investigation could contribute to deepening
understanding the financing issues of Chinese SMEs.1()
(1) Basic information of sample firms
First we give an oveⅣiew of the distribution of our sample 2,400
enter-prises with respect to size, sector, and om1erShip.
While ICS classifies enterprises into five size categories based on the
number of employees,ll we reclassify them into three categories :
enter-9 "ICS China 2OO2" is a survey Covering 1,500 firms in five cities : Beijing,Tianjin,
Shanghai, Chengdu, and Guangzhou.
10 The data was assembled and regression analyses wer(? conducted using the Worl(1 Bank's Investment, Climalノe Survey Online websiLe (http : //iresearch.worldbank.org/
ics/jsp/index.jsp).
10
prises with less than 50 employees as small, those with 50 to 249 employ-ees as medium, and those with 250 0r more employemploy-ees as large. The eacIl number of small, medium, and large firms is 733, 529, and 433 respectively
The sample enterprises break doⅥ1 into 1,609 manufacturing sector
firms and 791 service sector firms. In the manufacturing sector, a large
proportion of firms are in the electronics (524), auto and auto components
(401) and garments (353) industries. Service sector firms are mainly in
the IT services (203), accounting and finance (157), advertising and
mar-keting (154)industries.Traditional service industries such as wholesales,
retails, and restaurants, which account for a substantial share of anecon-omy's overall production and employment, are omitted from this suⅣey,
and we must take this particularity of our sample service industries into
account when interpreting the empirical obseⅣations.12
As for the ownership, we classi& sample firms into eight categories ; a
listed company (Listed) , a non publicly-traded shareholding company (Sha-reholding), a private nonllisted company (Private) , a subsidiary / division or joint venture of a domestic enterprise (Sub_d), a subsidiary /division or
joint venture of multilateral firm (Sub_m), a state-owned company (State),
cooperative or collcctive (Coop), and other. A large proportion of these
firms consist of private nonllisted companies (677) , state owned enter-prises (636) , cooperatives (387) , and non-publicly traded shareholding companies (313).13
(2) Financing sources for working capital and new investment capital
12 The survey includes 270 firms in "other services," and these firms seem to be various t,ypes of once services.
13 The sum exceeds the sample total because of the multiple responses for
FinancJng Structure and Bank Loan Access of SMEs in China :AnEmplrical AnaJysIS ll
We examine the composition of sources used for financing working
capi-tal and new investment capicapi-tal in 2002 by the sector and the size of firms. The seven categories into which we classify financing sources are as fol-lows ; commercial banks,14 investment fund, trade credit, family, friends and other informal, internal funds or retained earnlngS, equity,15 and other. The valid sample is 1,398 firms for working capital (manufacturing : 965,
services : 433), and 974 firms for new investment capital (manufacturing :
665, services : 309).
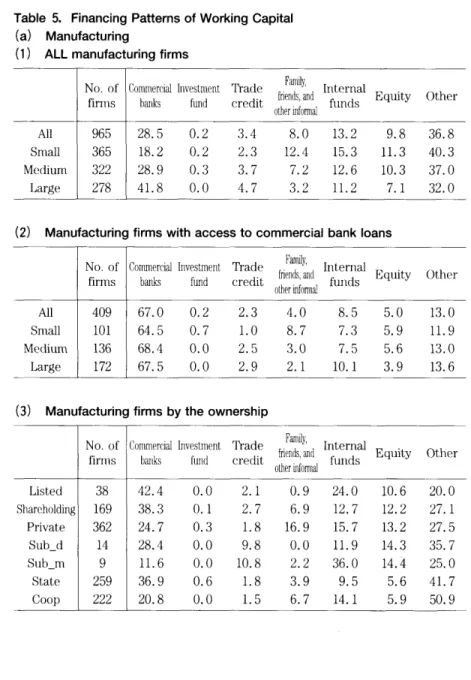
Table 5(a) shows the sample averaged proportions of financing sources
for working capital in the manufacturing firms. Excepting other source, the
principal source is commercial banks (28.5%), followed by internal 九nds
(13.2%), equity (9.80/o), and informal funds (8.0%). Looking at the
financ-ing sources by the size, we obseⅣe that as an enterprise becomes smaller, internal funds, informal funds, and equity become increasingly more im-portant. Conversely, large enterprises finance more than 400/o of working capital with bank loans. It is clear that the proportion of bank loans has a strong relationship with the firm size.
Focusing on the firms in which bank loans have positive share, We find a quite different financing pattern from that observed above. Out of total
965 manufacturing firms, 409 firms (42% of total) use commercial bank
loans. In these 409 firms, borrowing from local banks accounts for 670/o of
total working capital financed, and the "other" source significantly de-creases in its proportion. Moreover, the proportion of bank loans is nearly
14 Although commercial banks are both domestic and foreign owrled, the vast
ITlaj()r-ity is domestic.
15 Equity is the sale of stock not just to outside irlVeStOrS but to employees and
management. Since the sale 。f stock to employees appears to be somewhat similar to loans from informal sources, equity is not necessarily considered as formal and
12
Table 5. FinancJng Patterns of Working Capital
(a) Manufacturing
(1) ALL manufacturing firms
No.of firms W&6ヌGFナhヒ驃ニV蹐ヲVFF妨B詒&VTg&C「穽末Fニニ訶ニVFトWV宥微F"&$ニキ2
All 涛cR28.50.23.48.013.29.836.8
Small cR18.20.22.312.415.311.340.3
Medium #"28.90.33.77.212.610.337.0
Large s41.80.04.73.211.27.132.0
(2) Manufacturing firms with access to commercial bank loans
No.of firms W&6ト冶ニFV蹐ヲVFF妨FVVTg&薀「逍芳ト努C」$ヌ6トWV宥F"&豺2
All 鼎67.00.22.34.08.55.013.0 Small 64.50.71.08.77.35.911.9
Medium 3b68.40.02.53.07.55.613.0
Large s"67.50.02.92.110.13.913.6
(3) Manufacturing firms by the ownership
No.or firms W&6ト也ifァF艷V蹐ヲVFF妨B罘&VTbニ罎穽芳ト匁gCヨFトdァV宥微F"&uGFキ2
Financlng Structure and Bank Loan Access of SMEs in China : An Emplrical AnalysIS 13
(b) Services
(1) All SeⅣicefirms
No.of firms W&6霹FV蹐ヲVFF妨B蹙FVTbニヨCイ逞v芳ト匁gFVFトWV宥微F"&豺2
All 鼎3221.60.70.75.313.215.742.8 Smau #bll.00.00.99.314.120.644.2
Medium 28.02.00.71.011.614.542.2
IJargC 塔40.20.80.10.913.44.640.2
(2) seⅣice firms with access to commercial bank loans
No.of firms W&6ニニ輊ェ蹤羝V蹐ヨVFF妨B4VVTbニ膣ヲヨ芳ト都ヲヌ"6トWV宥微F"&ネナ2
All #r73.60.80.53.16.93.311.9
Small 275.20.00.06.711.82.04.3
Medium 鼎277.50.81.52.24.73.310.1
Large 鉄R69.31.40.01.55.44.218.3
(3) Service firms by the ownership
No.of firms W&6ニニ霹FV蹈FF妨FdVVTbニ膤逍芳ト都VFトWV宥微F"&豺2
Listed 225.80.00.00.025.614.833.8 Shareholding 涛b22.30.01.36.617.221.431.1 Private 唐10.40.01.112.914.020.541.1 Sub_d 迭##0.00.00.00.00.040.060.0 Sub_m State 1.61.30.00.913.07.945.3 Coop 鉄"17.30.02.05.99.99.655.2
14
the same level in small firms as in large firms, although the percentages of
firms which use bank loans varywith the firm size.16 In addition, small
firms are less dependent on internal funds than large firms, which is
con-trary to the pattern observed for all firms. Evidently, the sample firms are
polarized in terms of the use of bank financlng, and there is a large differ-ence in financing patterns between enterprises that use bank loans and those that do not.
Table 5(b) reports the proportions of financing sources for working
capi-tal in the services sector. While the financlng Patterns Of services sector
are roughly the same as those of manufacturing sector, the proportions of commercial banks, trade credit and informal funds are smaller in services
sector.
Table 6 shows the sample averaged proportion of financing sources for
newinvestment capital. As is the case for working capital, the largest
pro-portion is other, followed by commercial banks, internal funds, and equity.
Comparedwith working capital financing, firms use internal funds more,
and comercial bank loans and trade credit less in the case of investment
capital financing. Out of the 665 manufacturing firms, it is 199 firms (300/o of total) that use commercial bank loans to finance new investment. Even in the case of the large manufacturing firms, the percentage of firms which
can obtain bank loans is less than 50%. The larger companies show more
reliance on internal funds or retained earnings for newinvestment than for
working capital. This seems to suggest that the access to external sources is more or less constrained for investment capital even in larger enter-prlSeS.
16 The percentage of firms which use bank loans is only 28% in the case of small
Financlng Structure and Bank Loan Access of SMEs in China : An Empirical AnalysIS 15
Tab一e 6. Financing Pattems of New Investment
(a) Manufacturing
(1) ALL manufacturing firms
No.of firms W&6ト也cキ7F艷V蹐ヲVFF妨B詒&VTbニ膤逍ヨ芳ト膝FVFトWV宥微F"&豺2
All 田cR20.90.31.68.617.211.539.9 Smau C15.80.32.213.019.010.139.5
Medium "18.00.60.38.016.713.842.7
Large 229.40.02.14.215.710.837.7
(2) Manufacturing firms with access to commercia一 bank loans
No.of firms W&6ト也hヒ驃ニV蹐ヲVFF妨B雍ニVTbニ膤逍芳D彦坊FトWV宥微F"&豺2
All 湯69.10.30.73.810.07.18.9 Small 鉄r64.91.10.27.510.16.110.1
Medium 鉄74.40.00.01.610.68.94.5
Large 涛68.80.01.52.89.56.710.7
(3) Manufacturing firms by the ownership
No.of firms W&6ト冶ニFV蹐ヲVFF妨BTg&膤穽カFト都VFトWV宥微F"&W2
16
(b) seⅣices (1) All SeⅣicefirms
No.of firms W&6ニニ軣ウァF艷V蹐ヲVFF妨H・r鑾F訶ニVFトWV宥微F"&ネナ2
All 19.10.70.14.714.113.747.6 Small Cll.00.00.29.013.719.546.6
Medium 塔R22.80.40.00.413.914.148.4
Large 都b30.62.30.01.315.22.148.6
(2) ser・vice firms with access to commercial bank loans
No.of firms W&6ニニ霹FV蹐ヲVFF妨B詒&VTg&膤逍ヨ芳ト都VFトWV宥微F"&豺2
All 塔271.ll.30.02.87.43.613.9 Small 271.10.00.08.78.92.98.4
Medium b74.71.30.01.29.62.710.6
Large B68.32.10.00.04.74.720.1
(3) seⅣice firms by the ownership
No.of firms W&6ニニ輅fニF蹐ヲVFF妨BTbニ膤逞v芳uCtニVFトWV宥微F"&豺2
Listed 免ツ18.50.00.00.021.914.245.4 Shareholding 田b21.60.00.74.218.122.133.3 Private 3s29.80.00.211.513.118.546.9 Sub_d Sub_m State 5.31.20.01.212.66.253.6 Coop R23.20.00.06.112.911.146.7
Financlng Structure and Bank Loan Access of SMEs in China : An Emplrical AnalysIS 17
IV Regression analysis of financing patterns
In this section, we conduct more formal regression analysis to investi一
gate the relationship between the financing patterns and firm attributes
using ICS China 2003. As we observed in the previous section, there is a
significant difference in financing patterns between firms that use bank
loans and those that do not. Nearly 250/o of our sample firms finance more
than 50% of their working capital with commercial bank loans in 2002,
while 62O/o of them do not use any bank financing at all.
Therefore, We focus our attention on the factors affecting whether a
firm use local corrmercial bank for financing working capital or investment
capital, although the literature such as Beck et al (2004) regress the proI portion of each financing source on the concerned variables. To be specific, we employ a probit model, and our binary dependent variable takes the value one when a firm obtains financing from local commercial banks, and zero otherwise.
(1) Explanatory variables
The obstacles that SMEs encounter in borrowing funds from external
sources are largely attributed to high transaction costs and information
costs. Economies of scale play a role in bank lending activities such as
18
availability of collateral facilitates extending credits.And the loan
guaran-tee system may compensate for a shortage of collateral.
In China, in addition to the problems of market imperfections and
insti-tutional underdevelopment, the issues of enterprlSe OWIlerShip and re一
gional disparities in the development of financial intermediaries also affect the financing patterns of enterprises.
To address these issues, we consider following explanatory variables.All
variables are binary, taking the value one when a firm has the mentioned attribute.First, we introduce the variables related to basic characteristics of a firm
ln addition to the firm size dummies (Small and Medium), we consider
fo1-lowlng basic attributes ;
Age : a firm was established by the year 1995,
Location : a firm is located in the city of 250,00011million
popula-tion.17The age of a firm should represent the level of firm's specific
informa-tionwith which financial intermediaries have been acquainted. It is not
dif-ficult to suppose that the financial structure as well as the efficacy of fi-nancial institutions varies among the 18 cities where the survey was
con-ducted.18 However, since data identifying the located city is not provided,
we were unable to take the supply-side factor of regional disparities in fi-IlanCial development into full consideration in this analysis.
We also examine the influence of the firm's legal status (Listed,
Share-17 The firms which do not meet this criterion are located in larger cities.
18 0kura (1996) suggests the fragmerltation of capital markets h China. Xuan and
Okura (2006) examines tlle marketJ shares or various types of financial institutiorlS
Financlng Stmcture and Bank Loan Access or SMEs in China : An Emplrical AnalysIS 19
holding, Private, Subs_d, Sub_m, State, and Coop) on the access to bank credit.
Next, we consider the variables that could be concerned with enterprlSe
creditworthhess or preferential treatments granted by the government ;
Accounting : accounting and legal seⅣices are available,
Patent : a firm has acquired the patent in China or the U.S., or ISO
certificate ,
Export : a firm has the right to export its products directly,
Zone : a firm is located in industrial / science park or export process-ingzone,
Board : the government represents the board.
In addition, We examine whether an amliation to a group company
af-fects the financing patterns ;
Group : A firm is a member of the group / holding company.19
Then, we consider the following two variables in order to investigate
whether the lower level of profits or fixed assets has affected the access to bank loans.Asset : the level of net value of total fixed assets standardized by to-tal sales is in the lowest quartile of the sample,
Profit : the level of total profits standardized by total sales is in the lowest quartile of the sample.
The net fixed assets is of great importance as collateral for borrowing.
But the problem is whether a company possesses adequate fixed assets
19 0n one hand, we could conceive that the group or holding company provides
af-filiated firmswith financing sources that replace bank crediL On the other hand, it is possible that affiliated firms obtain financing from bankswith less difficulty
20
relative to the financing needs, so it is not a simple linear relationship wherein the larger the amourlt Of fixed assets are held, the more a com-pany seeks to borrow bank loans. Profitability can be expected to have the bidirectional effects of both raising the proportion of external funds by strengthening the creditworthiness of an enterprise and reducing the net ccSsity to rely on external capital by making it easier to finance internally
wit,h retained earnlngS. We suppose that the level of sales is relatedwith
the necessary funds, especially required working capital, and that the lower level of net fixed assets or profits relative to total sales likely has the effect of constraining bank loan access.2O
Finally, We examine the effect of government agency assistance in ob-taining bank financing on the access to bank loans (Gov.assist). To investi-gate whether the assistance of government agency is directed to smaller
sized firms, we introduce the interaction termswith the firm size dummies
as well (Gov.assist*Small and Gov.assist*Medium).
The regression equations we estimate take the form ;
Prob (BankLoan >0) -α +β 1 Small +β2Medium +β:Age +β4I,ocation
+β.[, Other Attributes +E.
As preliminary examinations suggest that the difference of sectors has
an effect on the financing patterns, We conduct the estimate separately for
manufacturing sector and services sector.
(2) Results
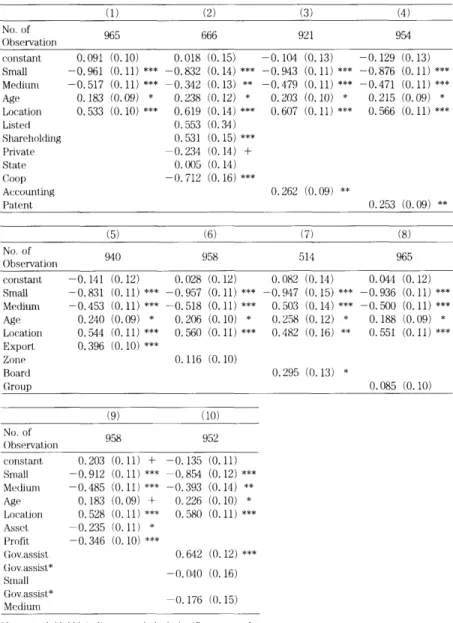
Tables 7-10 report the results of probit regression analysis. Since the
Financlng Structure and Bank Loan Access of SMEs in China : An EmplricalAnaJysIS 21
Table 7. Use of Commercial Banks for Financing Working Capital :
Manu-facturing Firms (1) (2) (3) (4) No. of nbservation 965 666 92 1 954 constant LqTllall Medium Age Locatloll LISted Shareholding PrlVate State Coop Accounting Patent 0.091 (0.10) 0.018 (0.15) 一0.961 (0.ll) *** -0.832 (0.14) *** -0.517 (0.ll) *** -0.342 (0.13) ** 0.183 (0.09) * 0.238 (0.12) 辛 0.533 (0.1()) *** 0.619 (0.14) *** 0.553 (().34) 0.531 (0.15) *** -0.234 (0.14) + 0.005 (().14) -0.712 (0.16) *** ー0.104 (0.13) -0.129 (0.13) -0.943 (0.ll) *** -0.876 (0.ll) *** -0.479 (0.ll) *** 一0.471 (0.ll) *** 0.2()3 (0.10) * 0.215 (0.09) * 0.607 (0.ll) *** 0.566 (0.ll)*** 0.262 (0.09) ** 0.253 (0.09) ** (5) (6) (7) (8) No. ()f Observati()∩ 940 958 5 1 4 965 C()nstallt - 0. 141 Sma11 -0. 831 Medium - 0. 453 Age 0. 240 Location 0. 544 Export 0. 396 Z()ne Board Grollp (0.12) 0.028 (0. 12) ().082 (0.14) 0.044 (0.12) (0.ll) *** -0.957 (0.ll) *** -0.947 (0.15) *** -0.936 (0.ll) *** (0.ll) *** 一0.518 (0.ll) *** 0.503 (0.14) *** -0.500 (0.ll) *** (0.09) * 0.206 (0.10) * ().258 (0.12) * 0.188 (0.09) * (∩.ll)*** 0.560 (0.ll)*** 0.482 (0.16) ** ().551 (0.ll)*** (0. 10) *** 0.116 (0.10) 0.295 (0.13) * 0.085 (0.10) (9) (10) No. Of ()bservalJiOn 958 952 coIIStantノ 0.203 (0.ll)十 一0.135 (0.ll) smal1 -0.912 (0.ll) *** -0.854 (0.12) *** Medium 10.485 (CLll) *** -0.393 (0.14) ** Age 0.183 (0.09) + 0,226 (0.10) * Location 0.528 (0.ll) *** 0.580 (0.ll) *** Asset -0.235 (0.ll) * prnfit -0.346 (0. 10) *** (l,ov.assist O.642 (0. 12) *** (iOv assisL* SIllall G Ov.assistノ* Medium -().()40 (0.16) -0.176 (().15) Not,e +,*,** *** uldicaLc sLatlSt,i(Ial sigruficance at the1
1O, 5, 1, and O.1 i)ere(さnL 1(さVCIs.
Source : author's estimation uSlng World Bank,
22
Table 8・ Use of Commercial Banks for Financing Working Capital : Service
Firms (1) (2) (3) (4) No. of ObseIVation 433 309 403 424 constant -0. 150 (0.18) -0.283 (0.29) 10.183 (0.21) -0.204 (0.20) Smal1 -1.145 (0.18) *** ll.105 (0.23) *** -1.153 (0.19) *** -1.ill (0.19) *** Me dillm Age Location Listed S h are holding P rivate State Coop Ac c (一unt山g Patent -0.506 (0.18) ** ~0.505 (0.22) 0.411 (0.15) ** 0.220 (0.18) 0.103 (0.17) 0.233 (0.20) 0.875 (0.57) 0.260 (0.24) 0.141 (0.24) 0.276 (0.23) -0.516 (0.37) * -0.644 (0.19)*** -0.535 (0.19) ** 0.437 (0.15) ** 0.423 (0.15) ** 0.098 (0.18) 0.139 (0.17) 0.110 (0.14) 0.129 (0.19) (5) (6) (7) (8) No. of Observation 403 416 195 431 coIIStant -0.161 (0.19) -0.224 (0.19) -0.035 (0.29) -0.347 (0.20) + Sma11 -1.144 (0.18) *** -1.143 (0.18) *** -1.410 (0.28) *** -1.032 (0.18) *** Medium 10.463 (0.19) * -0.535 (0.19) ** -0.489 (0.30) 10.464 (0.18) 辛 Age 0.397 (0.15) ** 0.446 (0.15) ** 0.372 (0.22) + 0.427 (0.15) ** Location 0.093 (0.17) 0.163 (0.17) -0.272 (0.29) 0.132 (0.17) Export 0. 254 (0. 30) ZoIle 0.248 (0. 18) Board 0. 187 (0.23) Grollp 0.461 (0.16) ** (9) (10) No. of Observation 419 420 C()nstant 10.053 (0. 19) -0.323 (0.20) + Sma11 -0.971 (0.18) *** -1.124 (0.20) *** Medlum -0.447 (0.19) * -0.318 (0.22) Age 0.376 (0.15) * 0.432 (0.16) ** Location 0.087 (0. 17) 0. 123 (0. 18) Asset -0.715 (0.21) *** Profit -0. 147 (0. 16) Gov.assist 0.941 (0.25) *** Gov.assist* Small Gov.assist* Medlum 0.132 (0.23) -0.249 (0.25)
Note : +,*,** *** indicate statistical slgnificance at theI
10, 5, 1, and 0.1 percent levels.
Source : author's estimation usmg World Bank,
Financlng Structure and Bank Loan Access of SMEs in China : An Emplrical AnalysIS 23
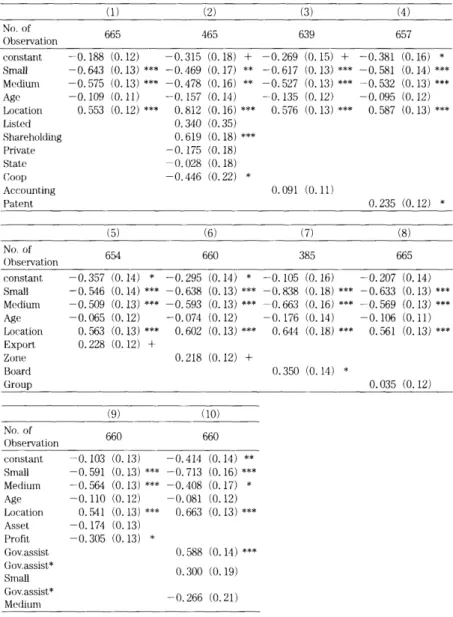
Table 9. Use of Commercial Banks for Financing New
Investment.'Manu-facturing Firms (1) (2) (3) (4) N(). of ObseIVation 665 465 639 657 constallt -0.188 (0.12) -0.315 (0.18) + -0.269 (0.15)十 一0.381 (0.16) * Smal1 -0.643 (0.13) *** -0.469 (0.17) ** -0.617 (0.13) *** -0.581 (0.14) *** Medium -0.575 (0.13) *** -0.478 (0.16) ** 一0.527 (0.13) *** -0.532 (0.13) *** Age Location List,ed Shareholding Private State Co()p Accounting Patent 10.109 (0.ll) -0.157 (0.14) -0.135 (0.12) -0.095 (0.12) 0.553 (0.12)*** 0.812 (0.16)*** 0.576 (0.13)*** 0.587 (0.13)*** ().340 (0.35) 0.619 (0.18) *** -0.175 (0.18) -().028 (0.18) -0.446 (0.22) * 0.091 (0.ll) 0.235 (0.12) * (5) (6) (7) (8) No. of ()bservation 654 660 385 665 coIIStant -0.357 (0.14) * -0.295 (0.14) * -0.105 (0.16) -0.207 (0.14) Smal1 -0.546 (0.14) *** -0.638 (0.13) *** 一0.838 (0.18) *** -0.633 (0.13) *** Medium -0.509 (0.13) *** -0.593 (0.13) *** -0.663 (0.16) *** -0.569 (0.13) *** Age -0.065 (0.12) -0.074 (0.12) -0.176 (0.14) -0.106 (0.ll) Location 0.563 (0.13) *** 0.602 (0.13) *** Export 0.228 (0.12) + Z。ne 0.218 (0.12) + Board Group (9) (10) N(). of ()bservation 660 660 0.644 (0.18) *** 0.561 (0.13)*** 0.350 (0.14) * 0.035 (0.12) constant -0.103 (0.13) -O.414 (0.14) ** Small Medium Age Location Asset Profit Gov,assist Gov.assist* Small Gov.assist* Medium -0.591 (0.13) *** -0.713 (0.16) *** -0.564 (0.13) *** 10.408 (0.17) * -0.110 (0.12) -0.081 (0.12) 0.541 (0.13) *** 0.663 (0.13)*** -0.174 (0.13) -0.305 (0.13) * 0.588 (0.14) *** 0.300 (0.19) -().266 (0.21)
Note : +,*,**,*** indicate statistical slgnificance at the
l0, 5, 1, and 0.1 percent levels.
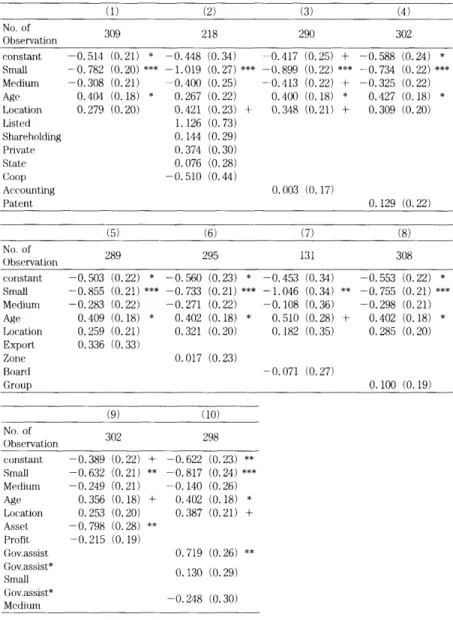
24
Table 10. Use of Commercial Banks for Financing New lnvestment : Service Firms (1) (2) (3) (4) No. of Observation 309 2 1 8 290 302 coIIStant -0.514 (().21) * -0.448 (0.34) Smal1 -0.782 (0.20) *** -1.019 (0.27) *** Medium -0.308 (0.21) -0.400 (0.25) Age 0.404 (0.18) * 0.267 (0.22) Location 0.279 (0.20) 0.421 (0.23) + Listed 1. 126 (0.73) Shareholding 0. 144 (0. 29) PrlVate (). 374 (0. 30) Stノate 0. 076 (0. 28) (Joop -0.510 (().44) Accourlting Patent -0.417 (0.25) + -0.588 (0.24) 辛 -0.899 (0.22) *** -0.734 (0.22) *** -0.413 (0.22) + -0.325 (0.22) 0.400 (0.18) * 0.427 (0.18) * 0.348 (0.21) + 0.309 (0.20) 0.003 (().17) (5) (6) 0.129 (0.22) (7) (8) N() of Ob s e rvati()∩ 289 295 13 1 308 constant 10.503 (0.22) * -0.560 (0.23) * 10.453 (0.34) 10.553 (0.22) * smal1 -0.855 (0.21) *** -0.733 (0.21) *** -1.046 (0.34) ** -0.755 (0.21) *** Medium -0.283 (0.22) -0.271 (0.22) 10.108 (0.36) -0.298 (0.21) Age 0.409 (0.18) * 0.402 (0.18) * 0.510 (0.28) + 0.402 (0.18) * Location 0.259 (0.21) 0.321 (0.20) 0.182 (0.35) 0.285 (0.20) Export 0.336 (0.33) Zolle 0.017 (0.23) Board -0.071 (0.27) Group 0. 100 (0. 19) (9) (10) No. of Observation 302 298 consLant -0.389 (0.22)十 10.622 (0.23) ** smal1 -0.632 (0.21) ** -0.817 (0.24) *** Mediult1 -0.249 (0.21) 一0. 140 (0.26) Age 0.356 (0.18) + 0.402 (0.18) * LncatlOn 0.253 (0.20) 0.387 (0.21) + Asset -0.798 (0.28) ** Profit 10.215 (0. 19) Gov.assist 0.719 (0.26) ** Gov.assist* Small Gov.assISt* Medillm 0.130 (0.29) -0.248 (0.30) Note : +,*,** *** indlCaLe statistical slgnificance at theI
lO, 5, 1, and 0.1 perceIIL levels.
Source : author's estimation using World Bank,
Financlng Structure and Bank Loan Access of SMEs in China : An Emplrical AnalysIS 25
sults are not qualitatively different between manufacturing sector and
seⅣ-ice sector, and between working capitalfinancing and new investment
fi-nancing, We focus on the case of working capital financing of manufactur-ing firms. As shown in table 7, the dependent variable-whether the pro-portion of commercial banks for financing working capital is nonzero-is
negatively correlatedwith such variables as Small, Medium, Profit, and AsI
set. It is confirmed that firmswith smaller size or lower level of profits and
fixed assets have more limited access to bank financing. On the other hand,
the dependent variable is positively correlated with Age, Location, Ac-counting, Patent, and Board with statistical significance.
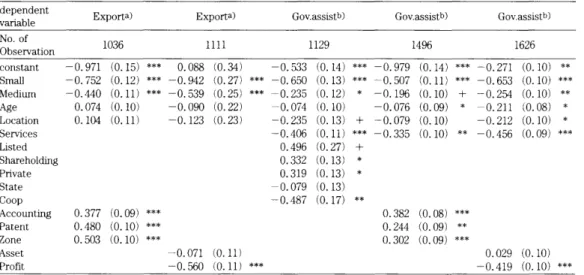
Since it is an interesting fact that manufacturing firmswith the export
right are more likely to receive bank financing, we conduct
additionalre-gressions relating the variable Exportwith other firm attributes. As shown
in columns 2 and 3 of table ll, the firms with export right tend to belarger in size, to avail themselves of accounting and legal services, to have
a patent of products or ISO license, to be located in industrial park or ex-port processlng ZOne, and to be moI.e Profitable. In other words, the firm with the export right appears to have many positive attributes demonstrat-ing their creditworthiness.
As for the relationship between the ownership and the access to bank loans, it is statistically significant that non publicly-traded shareholding
companies take more advantage of bank financing, and conversely coop-eratives and collectives tend to face more limited access to financial inter-mediary credit.
Finally, We investigate how the government assistance affects the use of
bank credit. As is easily expected, the coefficient of variable Gov.assist is
Table ll. Characteristics of firms with export right and government assistance in obtaining bank financlng
dependent
variab le Exporta) Exporta) Gov.assistb) Gov.assistb) Gov assIStb)
No. of ObservatlOn 1036 1 1 1 1 1 129 1496 1626 constant -0.971 (0.15) *** Smal1 -0. 752 Medlum - 0. 440 Age Location Semces LISted Sharehold止唱 Privat e State 0. 074 0.1(池(0.ll) Coop Accounting 0.377 (0.09) *** Patent 0.480 (0.10) *** Zone 0.503 (0.10) *** Asset Profit -0.071 (0.ll) -0.560 (0.ll) *** ー0.533 (0.14) *** -0.979 (0.14) *** -0.271 (0.10) ** -0.650 (0.13) *** -0.507 (0.ll) *** -0.653 (0.10) *** -0.235 (0.12) * -0.196 (0.10) + -0.254 (0.10) ** -0.074 (0.10) -0.076 (0.09) * -0.211 (0.08) * -0.235 (0.13) + -0.079 (0.10) -0.212 (0.10) * -0.406 (0.ll) *** -0.335 (0.10) ** -0.456 (0.09) *** 0. 496 0. 332 0.319 -0. 079 -0.487 0.382 (0.08) *** 0.244 (0.09) ** 0.302 (0.09) *** 0.029 (0.10) -0.419 (0.10) *** Notes : a) the regressions based on manufacturing firm observatlOnS.
b) the regressions based on the whole sample.
+,*,**,***indicate statlStical significance at the 10, 5, 1, and 0,1 percent levels.
Source : author's estimation usmg World Bank, ICS-Investment Climate SuⅣey Cわ血a 2003.
Financlng Structure and Bank Loan Access or SMEs in China : An Emplrical AnalysIS 27
the firm size dummies are not significant, suggesting that the government
assistance in obtaining bank financing including credit guarantee is not necessarily aimed at smaller firms・21 In China, the public institution topro-mote SMEs and to provide themwith credit guarantee is not a central
gov-ernment organisation. Rather, local govgov-ernments of countⅣ as well as
pro-vincial levels own and manage SME promoting centers and credit
guaran-tee systems (Li 2005, Shim 2006), and organizational structures and con-tract terms of credit guarantee systems vary from local government to loI cal government. Therefore, it is of interest to ask what kind of firms tend to use the government assistance. Columns 4-6 0f table ll report the re-sults of regression analysis relating the use of government assistance with
firm attributes. Firmswith such attributes as Accounting, Patent, and Zone
are more likely to take advant~唱e Of government assistance. On the other
hand, firmswith less than 50 employees orwith lowest quartile profit level
are more limited access to government assistance in obtaining bank financ-ing.V Concluding remarks
In this paper, We have primarily examined the relationship between the
financing patterns of Chinese SMEs and the attributes of these enterprises. h an empirical analysis uslng the World Bank's Investment Climate
Sur-vey, we observed a highly slgnificant relationship between firm size and
bank credit availability. In addition, a manufacturing firmwith the export
28
right has a higher probability of obtaining bank financing. One hypothesis
to interpret this relationship between the export right and the access to
bank loans is that the government has investedwith the right a selected
companywith high performance, and that the right to directly export is
accepted as a signal of creditworthiness admitted by the authority.Also it
seems to be that sales in foreign markets have enhanced the credibility of firms'ability to pay back their debts.
Just 364 of the 2,400 enterprises use a govemment agency assistance
mechanism in obtaining bank financing. While this number itself is not necessarily large, a firm receiving government assistance tends to have the
access to accounting and legal services.Although the moral hazard
prob-lem associatedwith government guarantee cannot be ignored, obtaining
government agency assistance, including government credit guarantee, may create incentives to introduce more sophisticated accounting with de-tailed financial statements. Then, in addition to the intended effect ofalle-viating insufficient collateral, the credit guarantee system may have the secondary effect of improving the transparency of a firm's business and
fi-nancial conditions, given that the government guarantee should be sup-plied according to an appropriate procedure of screening and monitoring.
Now, We remark a few issues for hrther research.
As for empirical analysis using the Investment Climate Survey, it is
Financlng Structure and Bal1k Loan Access of SMEs in China : An Emplrical AnalysIS 29
Secondly, it is an issue of great importance to investigate the technol0-gies or practices employed by different types of financial institutions in
ex-tending credit to different types of SMEs. While the privatized firm that
used to be a state-owned has a long-term relationshipwith major
comrner-cial banks, newly established private enterprises have little businessexpe-riencewith banks, which makes relationship lending difficult. Berger and
Udell (2006) argue that "differences in the financial institution structure and lending infrastructure may significantly affect the availability of fundsto SMEs by affecting the feasibilitywith which financial institutions may
employ the different lending technologies in which they have comparative
advantages to provide funds to different types of SMEs." At the same time,
however, existing lending technologies Or practices can evolve into a more
sophisticated one, glVen the lending infrastructure. A bank branch in
Shang-hal has made it possible to use a borrower's inventory as collateral by let-ting the borrower use the warehouse controlled by the bank.22
Thirdly, We have to pay much more attention to the diversities of SME financing environment in terms of the location and the industry. Our
sam-plc firms do not necessarily represent the whole population of Chinese
SMEs, since the survey does not include firms in the rural area, traditional service sector, and so on. IL is necessary toincrease the availability of
da-tabase providingwith richer information on broader types of SMEs.
Finally, it is of significant research interest to address the influence of
liberalized lending rate on SME borrowing from co…ercial banks arid
credit cooperatives. The People's Bank of China removed the upper cap on interest rates that banks can charge for loans in 2004, but their effects
30
may be gradually revealed (Podpiera 2006).
References
AsiaII Development Bank. 2003. `The Development of Private EnterprlSe ln the Pe0-ple's Republic of China,'Asian Development Bank.
Beck, Thorsten, Asli Demirguc-Kunt, Luc Laeven, and Vojislav MaksimoviC. 2006. tThe
Determinants of Financing Obstacles,'Journal of lntemational Money and
Fi-・yl/(mCe 25(6), 932-952.
Berger,Allen N. and Gregory F. Udell. 2006. LA More Complete Conceptual
Frame-work for SME Finance,'Jour77,al of Banking & Finance 30(1 1), 2945-2966. Boyreau-Debray, Genevieve. 2003. `Financial lntermediation and Growth : Chinese
Style,'World Bank Policy Research Worki7tg Pal)er No. 3027, World Bank.
Dollar, David, MaIY Hallward-Driemeier, Anqing Shi, Scott Wallsten, Shuilin Wang, and Lixin Colin Xu. 2003a. LImprovhg the Investment Climate in China: World Bank.
Dollar, David,Anqing Shi, Shuilin Wang, and Lixin Colin Xu. 2003b. LImproving City
Competitiveness through the Investment Climate : Ranking 23 Chinese Cities,' World Bank.
Fazzari, SteveII M., R. Glenn Hubbard, and Bruce C. Petersen. 1988. 'Financing Con-straints and Corporate lnvestノment,'Brookings Papers on Economic Activi131 1988 (1), 14ト195.
Ferry, Giovanni. 2005. 'Banking in the People's Republic of China : Are NewTigers Supplanting Old Marrunoths?'ADB In′stitute Discussiori Paper No.35, ADB Insti-tute.
Li Xin, 2005. `Testing a Credit Guarantee System for SMEs in Chian : The Case of Zhenjiang in Jiangsu Province,'Asia7/I SLudies 51 (1) (in Japanese).
Lin Hanchuan, Xia Minren, He die, and Guam Hongxi. ZOOS. 'Problcms Faced by Small and Mediurn-sized Enterprises in China : Report on a Survey in Beijing, Liaoning, Jiangsu, Zhejiang, Hubei, Guangdong and Yunnan,'China Social Science 2003 (2), Social Sciences in Chilla Press (in Chinese).
IJin Ping, He Wei Gang, and C,ai Jian. 2005. `The Analysis of Financing Structure of General and Individual Provate Enterprises : Based on Guangdong Case,'Journal ofFinancial Research 2005(1 1) (in CIlinese).
Okura, Masanori. 1996, `Resource Allocatioll and lllStitutional Reforms of China's Banking Sector,つin Kosaka, Akira and Koichi Ohno eds., Structural Adjustment
and EcoγL()γrLi(/・ Ref()7m. East Asia, IJatin America, an,a Central and Easteryz/
Financlng Structure and Bank Loan Access of SMEs in China : An Emplrical AnalysIS 31
Podpiera, Richard. 2006. 'Progress in China's Banking Sector Reform : Has Bank
Be-havior Changed?'IMF WorkwLg Papeγ O6/71, International Monetary Fund. Shim, Ilhyock. 2006. LCorporate Credit Guarantee in Asia,'BIS Quarterly Bet)ieu)
De-cember 2006, Barlk for lnternatiorlal Settlements.
Tong Shiping. 2003. LChinese Banking Institutional Reform and SME Finance,'Pro-ceedings of the China Study Group, Policy ftesearch Tnsl,itute, Ministry of Finance
Japan (in Japanese).
Wang, Yanzhong. 2004. 'Financlng Difficulties and Structural Characteristics of SMEs in China,'China/ & l帖rLd Ecc)nomy 12(2), 34149.
W()rld Bank. 2004. `hVeStment Climate for Small and Medium Enterprises (SMEs) Ill Southwest China: World Bank, Beijing, China.
Xuan Sheng Hua and Masanori Okura. 2006. 'Banking Sector Issues for Filling Financ-1ng Needs of Small and Medium Sized Enterprises in China: Discussion Paper No.7, Center for SME Studies, Institute for Development・ of Socio-Intelligence, Senshu University (in Japanese).