St r uc t ur e and c om
par i s on of t he el ec t r oni c s
and m
ot or vehi c l e val ue c hai ns i n Eas t As i a
著者
Kur oi w
a I kuo
権利
Copyr i ght s 日本貿易振興機構(ジェトロ)アジア
経済研究所 / I ns t i t ut e of D
evel opi ng
Ec onom
i es , J apan Ext er nal Tr ade O
r gani z at i on
( I D
E- J ETRO
) ht t p: / / w
w
w
. i de. go. j p
j our nal or
publ i c at i on t i t l e
I D
E D
i s c us s i on Paper
vol um
e
694
year
2018- 03
INSTITUTE OF DEVELOPING ECONOMIES
IDE Discussion Papers are preliminary materials circulated to stimulate discussions and critical comments
Keywords: global value chains, industrial agglomeration, trade in value added JEL classification: C67, L62, L63
* Chief Senior Researcher, Development Studies Center, IDE-JETRO
IDE DISCUSSION PAPER No. 694
Structure and comparison of the
electronics and motor vehicle value
chains in East Asia
Ikuo Kuroiwa*
March 2018
Abstract
The Institute of Developing Economies (IDE) is a semigovernmental,
nonpartisan, nonprofit research institute, founded in 1958. The Institute
merged with the Japan External Trade Organization (JETRO) on July 1, 1998.
The Institute conducts basic and comprehensive studies on economic and
related affairs in all developing countries and regions, including Asia, the
Middle East, Africa, Latin America, Oceania, and Eastern Europe.
The views expressed in this publication are those of the author(s). Publication does not imply endorsement by the Institute of Developing Economies of any of the views expressed within.
INSTITUTE OF DEVELOPING ECONOMIES (IDE), JETRO 3-2-2, WAKABA,MIHAMA-KU,CHIBA-SHI
CHIBA 261-8545, JAPAN
©2018 by Institute of Developing Economies, JETRO
No part of this publication may be reproduced without the prior permission of the
1 1. Introduction
Participation in global value chains (GVCs) has become an important strategy for
economic development. Unlike in the past, a developing country today can leap into the
GVCs of sophisticated products by specialising in a niche segment of the value chain,
and become an exporter of such products. Moreover, participation in GVCs gives an
opportunity to a developing country to upgrade local industry through linkages with and
technology spillovers from multinational firms.
However, participation in GVCs is not sufficient. Structural transformation
particularly industry deepening―the formation of backward linkages by creating a
robust supplier base (ADB 2013)―is necessary for sustained economic growth,
especially for industries such as motor vehicles. Note that the development of a local
supplier base increases the competitiveness of the assembly industry by delivering parts
and components at a lower cost, in a shorter time, and with more flexibility. In the case
of the automotive industry, spatial proximity between the local suppliers and assemblers
not only saves on transport costs for heavy and bulky components, but also facilitates
just-in-time production and inventory control.1
On the other hand, declining trade and transportation costs that were spurred by
technological progress―especially the ICT revolution―and trade liberalisation efforts
since the 1990s have increased the benefits of specialisation and exchange, reaping
significant gains from international division of labour―especially at different stages of
2
production (Baldwin 2016). In particular, industries such as electronics can enjoy great
benefits by breaking up the production process across space and shifting
labour-intensive operations to lesser developed countries, because, unlike automotive
parts, they are not penalised by high transport costs.
In sum, there are two forces working in opposite directions. One is agglomeration
that encourages local supplier development and increase domestic transactions. The
other is specialisation and exchange that promotes intra-industry trade of parts and
components and increases international transactions. It is therefore a matter of empirical
evidence which type of transaction―domestic or international―is increased as a result
of expanding production networks. In the previous study, I focused on the automotive
industry in Southeast Asia and found that Southeast Asian economies have become
important suppliers of parts and components, although they are still highly dependent on
Japan and other Northeast Asian economies, especially for sourcing basic metals
(Kuroiwa 2017).
In this study, I consider the electronics and motor vehicle industries in East
Asia and will compare the structures of the value chains of both industries. It is also
expected that the structures of value chains are different across countries, especially
between countries belonging to the Northeast and Southeast Asian economies, because
the latter economies are highly dependent on multinational firms―including firms that
operate in special economic zones and contribute to overseas procurement, especially
from the home countries of the respective multinational firms.
The inter-country input–output data (ICIO) data of the Organisation for
Economic Co-operation and Development (OECD) for 2011 will be used to examine the
3
economies―namely, Japan, Korea, China, and Taiwan―and six ASEAN
economies―Singapore, Malaysia, Thailand, Indonesia, the Philippines, and Vietnam.2
The paper first introduces the method of trade in value added. The analysis
of trade in value added has been used in recent years to calculate the measure of vertical
specialisation (VS) and to decompose export data (see Hummels, Ishii, and Yi 2001;
Daudin, Rifflart, and Schweisguth 2011; Johnson and Noguera 2012; Koopman, Wang,
and Wei 2014). Moreover, this paper introduces the method of decomposition of the VS
measures, so that the share of foreign content embodied in a specific good or service can
be estimated by country of origin or/and by sector of origin. In addition, the alternative
measure of VS―which indicates the percentage share of foreign final good production
induced by import of a specific intermediate goods―will be introduced in Appendix 3.
Second, the paper introduces a method of value chain mapping with the
ICIO data. The value chain mapping with international input–output data shows the
entire value chain of a specific product or service. First the technique is applied to the
upstream transactions to demonstrate how inputs―including both intermediate
transactions and value added activities―are used to produce the specific product.
Furthermore, the technique of value chain mapping will be applied to the downstream
transactions to demonstrate how outputs are distributed to the respective sectors for
intermediate transactions or final demand transactions.
This paper is composed as follows: the paper first discusses the structure of
VS in the electronics and automotive industry in East Asia using the method of trade in
value added. Second, two kinds of analyses―namely the decomposition analysis of
trade in value added and the value chain mapping―are applied to the electronics and
2 The OECD ICIO tables cover 62 countries or regions with 34 sector classifications (for
4
automotive industries in Korea and Thailand. Finally, the paper concludes with a
summary of important findings.
2. Structure of vertical specialisation
In this section, the analysis of trade in value added is performed using the OECD ICIO
data for 1995 and 2011. First, the VS share is calculated to illustrate the progress of
vertical trade in East Asia with particular focus on the electronics and automotive
industries. Second, those industries in Korea and Thailand are selected to represent the
VS in Northeast and Southeast Asian economies respectively. Moreover, the VS shares
of those industries are decomposed into its components by country of origin, and
industry of origin (for the method of analysis, see Appendix 2. Moreover, the alternative
measure of VS―which indicates the strength of forward linkages across national
borders―is introduced in Appendix 3).
2.1 The vertical specialization share
The VS share represents the percentage share of foreign content embodied in exports,
i.e. the share of value added that is induced by exports, but accrues to foreign countries.
Therefore, the VS share indicates the true dependency of exports on foreign content,
and its value tends to increase as production processes are increasingly fragmented
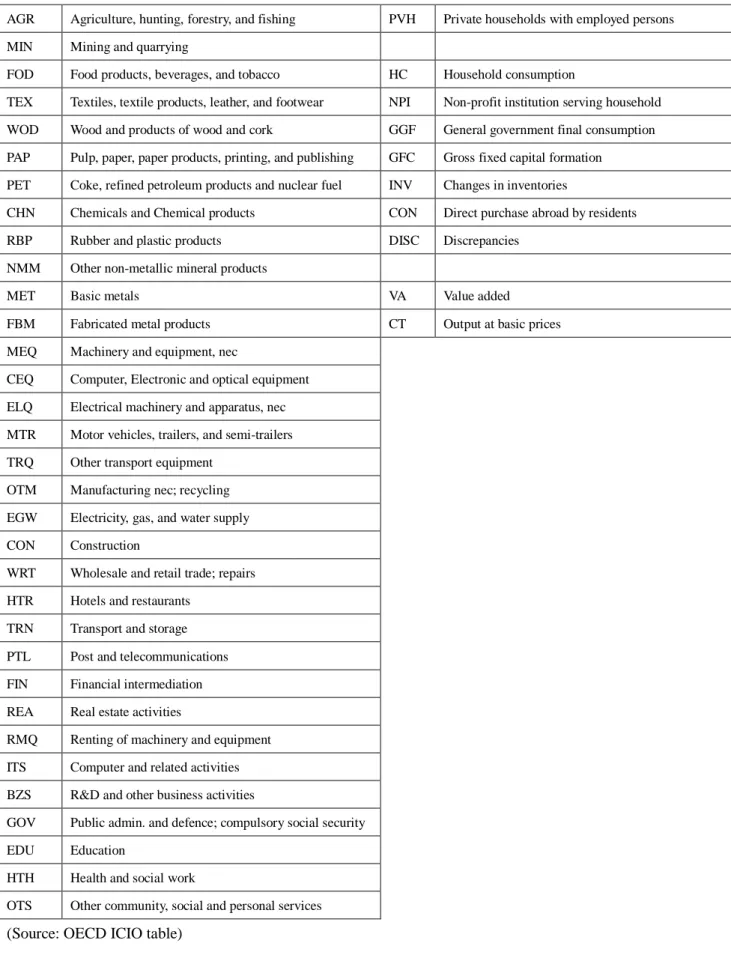
across national borders. Figures 1 and 2 show the VS shares of the electronics (CEO)
and motor vehicle (MTR) industries in 10 East Asian economies.3
– Figure 1 –
3 The OECD ICIO table has an industry classification for computer, electronic, and
5
Figure 1 shows that the electronics sector in Japan had an extremely low VS
share (6.9 percent) in 1995. Other Northeast Asian economies, such as Korea, and China
also had low VS shares. On the other hand, Southeast Asian economies, except
Indonesia, had high VS shares. These facts suggest that Northeast Asian economies had
a stronger local supplier base and higher self-sufficiency―with less leakage of value
added out of the country―than Southeast Asian economies (see also the average VS
share of the Northeast and Southeast Asian economies in Figure 1).
Seven East Asian economies increased VS shares during 1995–2011, and the
average VS share in East Asia―especially in Northeast Asia―increased
simultaneously. Among East Asian economies, highly export-oriented Southeast
economies, such as Vietnam, Thailand, and Malaysia demonstrated a rapid increase in
the VS share and reached the same level as Hungary and Mexico, which are
well-known export-platforms for multinational firms in the EU and the NAFTA
respectively. As a result, in Vietnam and Hungary, more than 70 percent of value added
was leaked out of the country for each given external demand, due to extremely high
dependency on foreign sourcing of inputs.
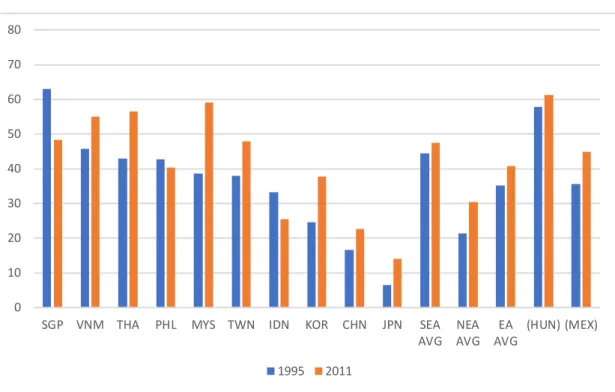
Figure 2 shows that the VS shares of the motor vehicle industry, especially in
Northeast Asia, were significantly lower than the electronics industry. For example,
China’s VS share of the motor vehicle industry in 1995 was 17 percent while that of
the electronics industry was 40 percent. These facts suggest that the motor vehicle
industry was more self-sufficient with less dependency on foreign sourcing of inputs,
and this is consistent with the argument that the benefits of agglomeration are more
6
– Figure 2 –
As in the electronics sector, the Northeast Asian economies had significantly
lower VS shares in the motor vehicle industry than the Southeast Asian economies. In
particular, Japan and China had very low VS shares. Japan’s VS share, for instance, was
only seven percent in 1995. It should be noted, however, that even these economies saw
a significant increase in the VS share―implying that the motor vehicle industry was
increasingly integrated into production networks in East Asia.
2.2 Decomposition of the VS shares
In the above section, it is shown that (1) the electronics industry had higher VS shares
than the automotive industry; and (2) the Southeast Asian economies had higher VS
shares than the Northeast Asian economies. These facts suggest that the progresses of
vertical integrations are substantially different depending on the natures of industries
and countries.
In the sections below, Korea and Thailand are selected as respectively
representing Northeast and Southeast Asian economies, and their VS shares are further
decomposed into their elements by country of origin and industry of origin.4 These will
illustrate the structure of the East Asian value chain in greater detail and will bridge the
4 The reasons for Korea and Thailand being selected for this study are as follows: First, both the electronics and automotive industries are leading industries for these two economies. Second, the types of firms engaged in GVCs are different between these two economies: the Korean electronics
7
gap between the analysis of the VS shares and value chain mapping (for the relationship
between these analyses, see Appendix 1 and 2).
(1) Electronics industry
Figures 3 and 4 show the top 20 countries or regions that had the highest value added
content for the electronics industry. Figure 3 shows that in 1995 the largest supplier
country (in terms of value added content) for the Korean electronics industry was Japan.
Other important supplier countries were neighbouring East Asian economies such as
Taiwan, China, and Singapore―as well as developed economies in North America and
Europe, especially the USA and Germany (see also the bars for the respective regions
on the right-hand side of Figure 3). In addition, natural resource rich countries, such as
Australia, Saudi Arabia and Russia were important supplier countries.5 In 2011, the
structure changed significantly, and China became the largest supplier country,
replacing a long-time dominant supplier country in East Asia―namely Japan.
Simultaneously many East Asian economies, except Japan, increased their share as
suppliers in this period, while developed economies in North America and Europe
decreased theirs.
– Figures 3 and 4 –
Figure 4 shows that Japan and the USA used to be dominant supplier countries for
the Thai electronics industry in 1995, but China caught up rapidly with them by 2001.
5 Note that natural resources, such as crude petroleum and iron ore, are contained,
8
However, unlike Korea, Japan was still the largest supplier country in 2011. Other
important supplier countries were also similar―that is to say, in addition to developed
countries, resource rich countries, and Northeast Asian countries, Southeast Asian
countries―such as Singapore and Malaysia―also had high value added content in the
decomposed VS share of the Thai electronics industry.
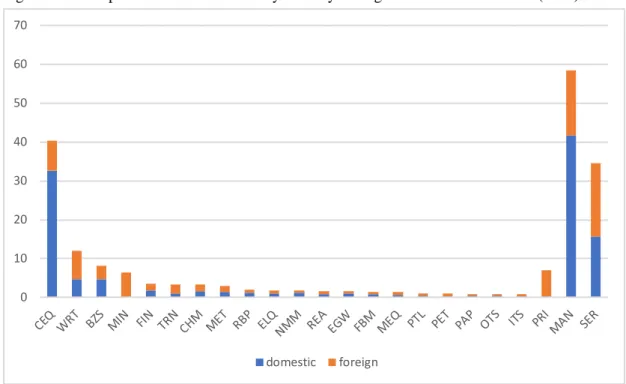
Figure 5 and 6 indicate the top 20 industries that had the highest value added content
for the electronics industry in 2011. Figure 5 shows that the Korean electronics industry
had the greatest content share (40 percent), out of which 33 percent was held by
domestic content. Other sectors that had high value-added content in the Korean
electronics industry include (1) the service industry―especially wholesale and retail
trade, R&D and other business activities, financial intermediation, and transport and
storage; (2) the mining industry, which provides natural resources and is dominated by
foreign content; (3) the materials industry―chemicals, rubber and plastic products,
basic metals, and non-metallic mineral products; and (4) the machinery
industry―electrical machinery, machinery and equipment. In sum, these industries
provide the major constituents of electronics products in value added terms.
– Figures 5 and 6 –
Figure 5 also shows that although manufacturing (MAN) had higher value added
content than services (SER), services had higher foreign content (19 percent) than
manufacturing (17 percent). In particular, wholesale and retail trade, transport and
storage, and computer and related activities had relatively high foreign content shares.
9
electronics industry in terms of the distribution of value added content across industries.
For instance, wholesale and retail trade in electronics had the largest share in both the
countries. It should be noted, however, that the Thai electronics industry had a higher
foreign content share than the Korean electronics industry―reflecting a weaker supplier
base in the Thai manufacturing industries.
.
(2) Automotive industry
Figures 7 and 8 show that the major supplier countries for motor vehicle parts and
components for Korea and Thailand were similar to those for the electronics industry.
Important supplier countries were the neighbouring East Asian economies―especially
China and Japan―as well as developed economies in North America and
Europe―particularly the USA and Germany.
– Figures 7 and 8 –
The changing trend between 1995 and 2011 was that the Korean automotive
industry was increasingly involved in China’s supply chain, while the Thai automotive
industry continued to be overwhelmingly dependent on Japan.
Simultaneously―reflecting the progress of economic integration in the region―the
Thai motor vehicle industry increased its dependency on neighbouring Southeast Asian
economies from less than two percent to more than six percent during 1995–2011. In
sum, both the Korean and Thai electronics industries have strengthened the linkages
with neighbouring economies in the respective regions. These facts suggest that
10
chains.
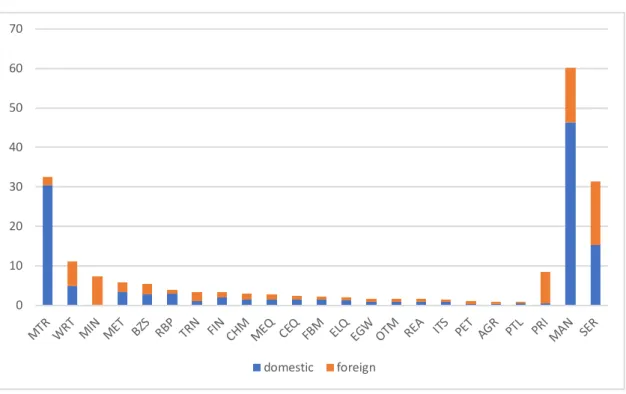
Figures 9 and 10 show that the motor vehicle industry provided the largest
value added content for its own sector in 2011. The foreign content of the motor vehicle
industry, however, was very low―only two percent in the case of Korea―and the
proportion of local procurement in the motor vehicle industry was significantly higher
than in the electronics industry (compare MTR in Figures 9 and 10 with CEQ in Figures
5 and 6). Note that this again reflects the benefits of industry agglomeration, which
could contribute to local sourcing of automotive parts and components.
– Figures 9 and 10 –
The list of other sectors that had high value added content was similar to the
electronics industry with the exception of basic metals: among the sectors that were
deeply involved in the motor vehicle value chain, basic metals ranked highly both in
Figures 9 and 10. Figure 10, however, shows that the domestic content of basic metals
in Thailand was significantly lower than that in Korea, reflecting a weaker production
capacity of the iron and steel industry in Thailand.
3. Value chain mapping
The above analysis illustrates the structure of the value chain from the viewpoint of
supplier countries or supplier industries. In this section, it will be further decomposed
into the combinations of countries and sectors―i.e. how much value added was
generated in which industries and in which countries―by mapping the value chain of
11
will be illustrated, in tandem with exogenous transactions―namely value added and
final demand transactions.
Figures 11.a–14.b show the value chain of the electronics and motor vehicle
industries in Korea and Thailand for 2011. Note that a pair of those figures show the
upstream and downstream transactions respectively. The upstream value chain
demonstrates the flow of upstream intermediate transactions and value added activities
induced by a unit of final demand (or final goods production), whereas the downstream
value chain reveals the flow of downstream intermediate transactions and final goods
production induced by a unit of value added (for technical details, see Appendix 1).
The entire value chain system of respective industries―from final goods production
to value added and vice versa―can be demonstrated by combining a set of two
(upstream and downstream) transaction matrices for respective industries. However, (1)
due to limitation of space, only upstream (downstream) transactions and value added
final goods production whose values exceed one percent of the initial final demand
(value added) are recorded in the figures. A unit of final demand or value added is
normalised to 100 units, so that only the transactions that exceed one unit appear in
Figures 11.a–14.b.6
(1) Electronics industry
Figure 11 and Figure 12 indicate the value chains of the electronics industry of Korea
6 As shown in Figures 11.a–14.b, the number of the transactions whose value exceeds one is not great: for example, Figure 11.a shows that only 41 transactions meet this criterion, whereas the total number of transactions derivable from Equations (5) and (6) is extremely large (4,445,772
12
and Thailand respectively. Figure 11.a and 12.a illustrate the upstream transactions,
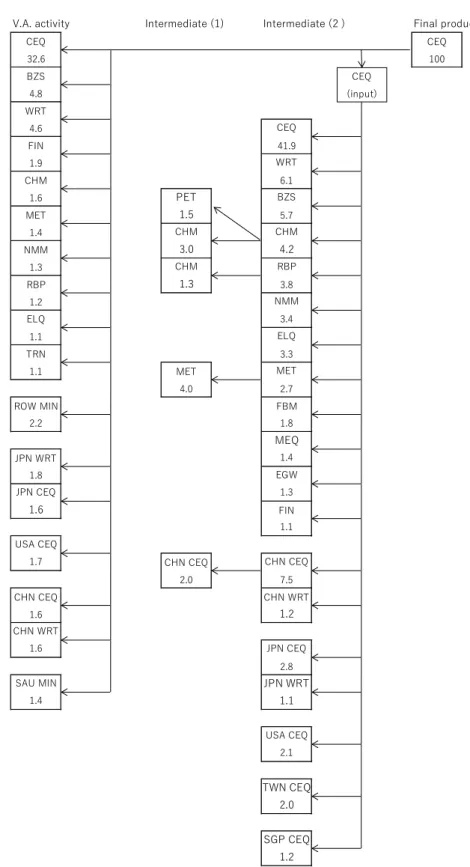
whereas Figure 11.b and 12.b demonstrate the downstream transactions. For example,
the middle section of Figure 11.a shows that 100 units of electronics (CEQ)―which
were given exogenously as a final product―induced intermediate demand for 41.9 units
of electronics (as a result of backward linkage effect). Simultaneously, it stimulated
intermediate demand for 4.2 units of chemicals (CHM), which further induced
intermediate demand for 3.0 units of chemicals and 1.5 units of refined petroleum (PET).
In the value added section, 32.6 units of value added was generated in the electronics
industry, followed by R& D and business services (BZS) at 4.8 units.
– Figures 11 (a, b) and 12 (a, b) –
It is shown that servicification of the economy has been proceeding in both
Korea and Thailand. Service inputs―such as wholesale and retail trade, financial
intermediation, transport and storage, R&D, and other business activities―hold a very
high percentage share of induced value added as well as induced intermediate
transactions.7 It is also shown that since share of domestic content in Thailand is
generally lower than that in Korea, the Thai electronics industry induced high value
added in a variety of industries abroad, including Japan (electronics, wholesale and
7 It is argued that servicification of the economy has been caused by (1) reclassification
―many of the services traditionally sourced in house by manufacturing firms, and thus
classified as manufacturing, began to be outsourced and classified accordingly as services: (2) connecting services―outsourcing and offshoring tend to increase service
links (including telecommunications, transportation, and mailing) embodied in final goods; (3) changes in final goods―technological progress is enhancing the service
content in the manufactured final goods, such as increased software contained in today’s cars: (4) relative price shift―offshoring reduces the relative price of offshored
13
retail trade, and basic metals), China (electronics, wholesale and retail trade), the Rest
of the World (ROW) (mining), the USA (electronics), and Taiwan (electronics).
Supplier countries of intermediate goods exhibit a similar tendency: the
electronics industry in China, Japan, the USA, Korea, and Taiwan were major suppliers
of intermediate goods for both the Korean and Thai electronics industry. In addition,
Malaysia and Singapore were major supplier countries for the Thai electronics industry.
Figures 11.b and 12.b show that the number of downstream transactions that
exceed one unit is smaller than that of upstream transactions, because the downstream
transactions are concentrated on a smaller number of sectors―especially in final
demand sectors, such as gross fixed capital formation and household consumption.
Unlike the upstream transactions, the downstream transactions involve only a small
number of domestic service sectors―such as R&D and business service activities, post,
and telecommunication, in the case of Korea. Moreover, inputs provided by the
electronics sectors were frequently used by the sector itself and other machinery
sectors―such as machinery and equipment, motor vehicles, electrical machinery, and
other transport equipment.
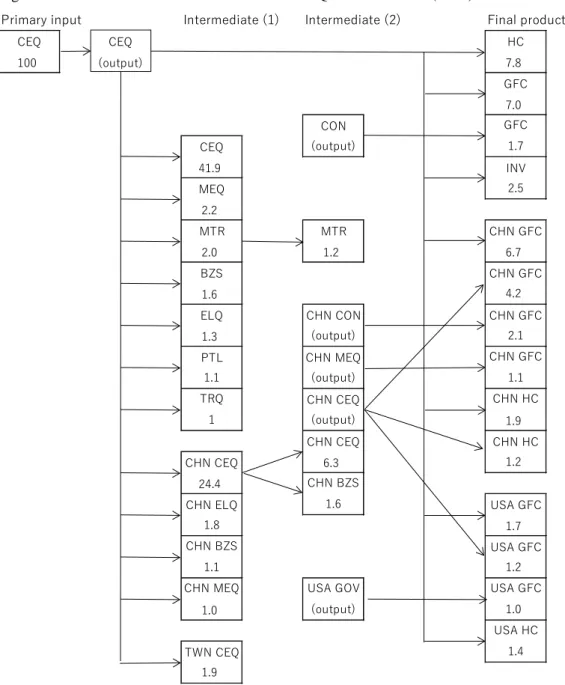
Figure 11.b shows that the Korean electronics industry was heavily dependent
on China not only as users of intermediate goods but also as consumers of final goods.
For example, the Korean electronics industry provided 24.4 units of intermediate goods
for the Chinese electronics industry. Then the Chinese electronics industry provided
intermediate goods for its own industry and R & D and other business activities.
Simultaneously, the Chinese electronics industry provided final goods for China (gross
fixed capital formation and household consumption) and the USA (gross fixed capital
14
(electronics) intermediate goods from Korea to China, thereafter assembling in China
and finally (electronics) final goods to China and to the USA were performed by the
Korean multinational firms operating in China.
As for the transaction of final goods, the Korean electronics industry also
directly exported final goods to China and to the USA, so that China consumed 6.7 units
of Korean electronics products for gross fixed capital formation and 1.9 units for
household consumption, whereas the USA consumed 1.7 units for gross fixed capital
formation and 1.4 units for household consumption.
Figure 12.b shows that users of intermediate goods from the Thai electronics
industry were more diversified than those from the Korean electronics industry. For
example, it provided more than one unit of electronics products for Malaysia, Japan,
Korea, the USA, and Mexico. On the other hand, final goods were largely destined for
China, the USA, and Japan.
As for the role of China, a sequence of transactions similar to Korea―namely,
(electronics) intermediate goods from Thailand to China, followed by processing in
China and finally the movement of (electronics) final goods to China or to the
USA―can be seen in the middle section of Figure 12.b. Here it is worth noting that
China has increased its presence not only as an export-platform for multinational firms
but also as a consumer of manufactured products from both Korea and Thailand.
(2) Automotive sector
Figure 13.a shows that the final demand for Korean motor vehicles stimulated value
added activities in its own sector (30.5 units) and other domestic machinery
15
Moreover, it stimulated demand in two sets of material industries―namely the metal
industry (basic metals and fabricated metal products) and the chemical industry (rubber
and plastic products and chemicals). Also, as in the electronics industry, the motor
vehicle production stimulated demand in the service sectors―especially wholesale and
retail trade, R&D and other business activities, financial intermediation, and transport
and storage.
– Figures 13 (a, b) and 14 (a, b) –
Although a greater portion of value added was produced by the domestic
sectors, it also stimulated value added activities in the ROW and Saudi Arabia (mining)
―as well as in Japan (wholesale and retail trade).
As for the intermediate transactions, it is an interesting observation that Korean
motor vehicles induced a sequence of downstream to upstream transactions―namely
motor vehicles (input)→rubber and plastic products (9.7 units)→rubber and plastic
products (1.1 units) and chemicals (3.2 units)→refined petroleum products (1.4 units).
The metal industry also caused the following sequence: motor vehicles
(input)→fabricated metal products (3.3 units)→basic metals (1.4 units). In other
intermediate transactions, the motor vehicle industry in Germany, China, and Japan
were important suppliers of inputs (i.e. parts and components) for the Korean motor
vehicle industry.
Figure 14.a shows that compared to Korea, Thailand had a weaker local
supplier base for the motor vehicles industry so that a higher percentage of value added
16
repercussions (in value added terms) on Japan (wholesale and retail trade, basic metals,
and motor vehicles), Saudi Arabia (mining), China (basic metals), and ROW (mining).
In the intermediate transactions, since Thailand had lower self-sufficiency in
the metal industry―especially in iron and steel for the motor vehicles―a higher
percentage of basic metals was imported from Northeast Asian countries, including
Japan (4.1 units), China (1.5 units), and Korea (1.4 units) as well as from Australia (1.9
units) and the ROW (1.3 units). A major supplier country of parts and components for
the Thai motor vehicles industry was Japan (5.0 units). The Philippines (1.2 units) was
also an important supplier country of labour-intensive parts and components.
Figure 13.b shows that the Korean motor vehicle industry provided inputs for
its own sector and service sectors (other community, social, and personal services).
Simultaneously, it provided inputs for the motor vehicle industry in the USA (3.0 units)
and China (2.9 units), where the Korean firms have production facilities of motor
vehicles. The Korean cars assembled in the USA were then used for household
consumption in the USA (1.4 units), whereas the Korean cars assembled in China were
provided for gross fixed capital formation in China (1.5 units). In sum, a structure
similar to the Korean electronics industry can be seen although the Korean electronics
industry used China as an export platform for the US market as well. Simultaneously,
motor vehicles produced in Korea were directly exported to the USA, the ROW, Saudi
Arabia, China, and Brazil.
Figure 14.b shows that a large percentage of motor vehicle parts and
components were exported from Thailand to neighbouring Southeast Asian countries
including Indonesia and Malaysia and Japan as well. Motor vehicles assembled in
17
Australia, Saudi Arabia, Indonesia, the Philippines, Malaysia, and the ROW.
4. Conclusion
Participation in GVCs has become increasingly important as a strategy for economic
development. However, participation in GVCs is not sufficient. Industrial deepening
and development of the local supplier base is necessary for sustainable economic
growth, especially for industries with significant economies of scale such as the motor
vehicle industry.
On the other hand, declining trade and transport costs have increased the
benefits of specialisation and exchange, reaping significant gains from international
division of labour. In particular, industries such as electronics can enjoy great benefits
by breaking up production processes across space and shifting labour-intensive
operations to less developed countries.
This paper attempts to explore the structure of the electronics and motor vehicle
value chains in East Asia, with particular focus on Korea and Thailand. Trade in value
added analysis is applied to the OECD ICIO data. Also, the method of value chain
mapping is introduced to illustrate the upstream and downstream transactions of goods
and services along the value chain. Among the findings derived from this study, the
following are important.
Analysis of trade in the value added for the electronics sector shows that
Northeast Asian economies had lower VS shares than Southeast Asian economies with
the exception of Indonesia. This suggests that Northeast economies had a stronger
supplier base and higher self-sufficiency―with less leakage of value added out of the
18
share in East Asia, especially in Northeast Asia, increased substantially during
1995–2011―implying acceleration of vertical specialization in this region.
The motor vehicle industry had lower VS shares than the electronics industry,
and this is consistent with the argument that the benefits of agglomeration are more
significant for the automotive industry. Simultaneously, as in the electronics sector,
Northeast Asian economies had lower VS shares than Southeast Asian economies,
although the former economies saw a significant increase in the VS share during
1995–2011. One of the reasons for the high VS shares in Southeast Asia is that the
leading sectors in Southeast Asia are dominated by foreign firms, which tend to increase
sourcing from the supplier base in their own supply chain, particularly from the home
countries of the respective firms. For example, Japanese firms are dominant motor
vehicle manufacturers in Southeast Asia, and this contributes to sourcing from Japan.
The decomposition of the VS share shows that in the period 1990–2011, Japan
used to be the largest supplier country (in value added terms) for the Korean electronics
industry, but it was replaced by China. On the other hand, Japan continued to be the
largest supplier country for the Thai electronics industry. The decomposition of the VS
share by industry of origin shows that Korea and Thailand had similarities in terms of
the distribution of value added content across industries, although the Thai electronics
industry had higher foreign content shares than the Korean electronics industry.
The decomposed VS shares of the automotive industry show that the Korean
automotive industry was getting increasingly involved in China’s supply chain, while
the Thai automotive industry continued to be overwhelmingly dependent on Japan.
Simultaneously, the Thai motor vehicle industry increased its dependency on
19
as the ownership structure of firms―is an important factor that affects the spatial sphere
of the automotive supply chains.
The decomposition of the VS share by industry of origin shows that basic metals
had high value added content in the motor vehicle industry. It also demonstrated that the
domestic content of basic metals in Thailand was significantly lower than that of basic
metals in Korea, reflecting a weaker production capacity of the steel and iron industry in
Thailand.
The value chain mapping shows that the electronics industries in China, Japan,
Korea, Taiwan, and the USA were major suppliers of intermediate goods for both the
Korean and Thai electronics industry. Moreover, as a result of servicification of the
economy, service inputs―such as wholesale and retail trade, financial intermediation,
transport and storage―had a high percentage share of induced value added, as well as
induced intermediate transactions.
As for downstream transactions, the Korean electronics industry was heavily
dependent on China not only as users of intermediate goods but also as consumers of
final goods. It can be seen that in the electronics industry a high percentage of
intermediate goods was exported from Korea to China, assembled in China and the final
goods were consumed by China and the USA. It is estimated that a significant portion
of these transactions were performed by the Korean multinational firms operating in
China.
Users of intermediate goods from the Thai electronics industry were more
diversified than those of the Korean electronics industry whose users were mostly
concentrated in China. Simultaneously, a sequence of intermediate transactions similar
20
here not only as an export-platform but also as a consumer of final products of Thai
industries.
The Korean motor vehicle industry stimulated value added in its own sector
and other machinery sectors. Moreover, it activated a set of material industries―namely
the metal and chemical industries―and service industries. Although a great portion of
value added was produced by the domestic industries, it also stimulated value added
production in the ROW (mining) and Saudi Arabia (mining), as well as in Japan
(wholesale and retail trade).
Since Thailand had a weaker local supplier base for the motor vehicles industry,
a higher percentage of value added was leaked out of the country. In particular, the Thai
motor vehicles industry had strong repercussions on Japan, Saudi Arabia, China, and the
ROW. It is also important to note that since Thailand had a lower self-sufficiency in the
metal industry, a higher percentage of basic metals were imported from the Northeast
Asian economies―including Japan, China, and Korea―as well as Australia and the
ROW. A major supplier country of parts and components for the Thai motor vehicles
industry was Japan. The Philippines, on the other hand, was an important supplier
country of labour-intensive parts and components.
The Korean motor vehicle industry provided inputs for its own sector and
service sectors. Simultaneously, it provided inputs for the motor vehicle industry in the
USA and China. The Korean cars assembled in the USA were then used for household
consumption in the USA, whereas the Korean cars assembled in China were provided
for gross fixed capital formation in China―implying that motor vehicles were more
likely to be assembled where the market is located.
21
exported from Thailand to the neighbouring Southeast Asian countries including
Indonesia and Malaysia and Japan as well. Motor vehicles assembled in Thailand were
exported for gross fixed capita formation or household consumption in Australia, Saudi
22
Appendix 1: Method of structural analysis
This section introduces the method of structural analysis, which was first introduced by
Kuroiwa (2016). The result of the analysis deals with both upstream and downstream
transactions of the specific good or service.
a. Upstream transactions
First, using an input coefficient matrix of the international input–output data, the
accounting identity on the output side (i.e. the equality between total outputs and
intermediate inputs plus final demand) can be expressed as:
, (1)
where is the (nm x 1) vector of total output; m and n represent the number of
countries and sectors respectively; is the (nm x n ) multi-country input coefficient
matrix; and is the (nm ) vector of final demand.
Solving Equation (1) for gives
, (2)
where is the (nm x nm) identity matrix; and is the (nm x nm) multi-country
Leontief inverse matrix. Then, differentiating each element in x in Equation (2) with
respect to each element in f yields
= . (3)
where the ij element of the rs sub-matrix in the Leontief inverse indicates the output of
sector i in country r induced directly or indirectly by one unit of final demand for sector
j in country s. Thus, the column vector of sector j in country s indicates the output of all
23
one unit of final demand for industry j in country s, as shown below:
= . (4)
Subsequently, the unit structure for the upstream transactions can be obtained by
post-multiplying A by the diagonal matrix of column vector .
, (5)
where is the diagonal matrix of column vector . Then, using Equation (3), it can
be shown that ,8 where denotes the value of
intermediate inputs produced by industry h in country q, and used by industry i in
country r. Hence, if j is specified as the electronics sector, represents an
intermediate transaction from industry h in country q to industry i in country r, induced
by one unit of final demand for the electronics product in country s. Then,
indicates the sequences of inter-industry transactions of goods and services that occur
along the upstream electronics value chain.
Similarly, induced value added which is the remuneration paid for primary
inputs, such as labour compensation, profits, and indirect taxes—is calculated by
post-multiplying the row vector of the value added coefficients by .
8 Due to the assumption of linearity in the input–output model, it holds that
24
, (6)
where is the (n x 1) column vector of the value added coefficients for county r.
In Equation (6), ( ) represents the value added produced by industry
i in country r and absorbed by industry j in country s, which is equivalent to the value
added exports from source country r to destination country s (see Johnson and Noguera
2012).
b. Downstream transactions
For mapping downstream transactions, a different approach is necessary. This paper
proposes to use the Ghosh inverse as an alternative to the Leontief inverse. As a mirror
image of the Leontief inverse, the Ghosh inverse indicates outputs in the respective
sectors induced by one unit of primary input (land, capital, and labour) for a specific
sector (Ghosh 1958).
Using the allocation coefficient matrix, the accounting identity on the input
side (i.e. the equality between total inputs and intermediate inputs plus value added) is
expressed as
, (7)
where is the (nm x nm) multi-country output coefficient matrix. is the (nm x 1)
vector of value added. Solving Equation (7) for x gives
= , (8)
where is the (nm x nm) multi-country Ghosh inverse matrix. Then, differentiating
25
= . (9)
It should be noted that contrary to Equation (3), represents the output of sector j in
country s induced directly or indirectly by one unit of primary inputs in sector i in
country r. Therefore, the row vector of sector i in country r reveals the output of all
sectors in all countries induced by sector i in country r:
= . (10)
Then, the unit structure for the downstream transactions can be obtained by
pre-multiplying B by the diagonal matrix of row vector .
, (11)
where is the diagonal matrix of row vector Here, as in Equation (5), it holds
that .
Analogous to Equation (6), the final goods production induced by primary
inputs for sector i in country r is calculated as:
, (12)
where is the final demand coefficients matrix in country s (i.e. the ratios of final
26
Appendix 2: The VS share and its decomposition
Using the notations in Appendix 1, the VS share of sector j in country s―which is
equivalent to Equation (40) in Koopmans, Wang, and Wei (2014)―can be expressed as:
, (13)
where is a value added coefficient of sector i in country r and represents a
share of the value added in sector i in country r contained in the exports of sector j in
country s. Here the VS share is expressed in percentage terms, so that it can range from
0 to 100―the higher the VS share, the stronger the backward linkages across national
borders. Moreover, the share can be decomposed as follows:
(1) Share of foreign content by country of origin ( ) is calculated by
(14)
Note that if r=s in Equation (14), the above index represents domestic content.
(2) Share of foreign content by industry of origin (i) is given by
(15)
In sum, the and can be derived from Equation (6) by
27
Appendix 3: The VSG share and its decomposition
As a mirror image of the VS share, an alternative index of the VS can be
produced by using the Ghosh inverse. This new index, which I call here the VSG share,
represents the percentage share of foreign final goods induced by the import of specific
intermediate goods or services, i.e. the share of final good production that is induced by
imported intermediate goods but accrues to foreign countries. In contrast to the VS
share, the VSG share indicates the strength of forward linkages across national borders.
The VSG share of sector i in country r can be expressed as:
, (16)
where is a final demand coefficient (i.e. the ratio of final demand to outputs) of
sector j in country s, and represents a share of final good production in sector j in
country s induced by the import of intermediate goods for sector i in country r.
Furthermore, as in Equation (13), Equation (16) can be decomposed into shares of
foreign final good production by country of destination and by industry of destination.
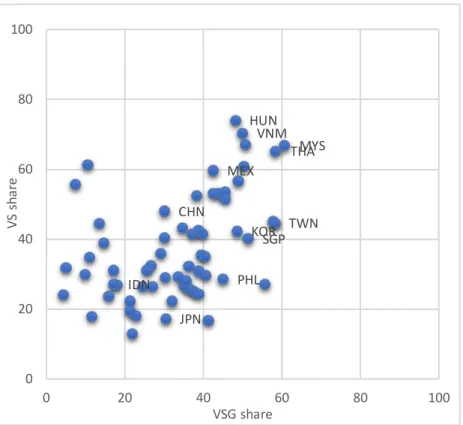
Figure A1 shows the relationship between VS and VSG shares in the
electronics sector for the year 2011. It is shown that those countries that have higher VS
shares than VSG shares―namely strong backward linkages and weak forward
linkages―are located downstream in the value chain and are mostly developing
economies with a weak supplier base. On the other hand, developed economies
including Japan, Korea, and Taiwan have an opposite structure, i.e. they are located
upstream in the value chain and provide inputs for less developed countries in the
region.9 At the same time, the countries that were far from the origin in Figure A1 were
9 In this regard, the Philippines is an exception (see Figure A1). The electronics sector
28
very active in vertical specialization. They include Southeast Asian economies with high
export-orientation such as Vietnam, Malaysia, and Thailand as well as well-known
export platforms such as Hungary and Mexico.
– Figure A1 –
Figure A2 shows that many East Asian motor vehicle industries have greater VS
shares than VSG shares except Japan. This implies that it would take more time for
developing economies to become a supplier country of motor vehicle parts and
components. It should be noted, however, that the countries that are far from the origin
in Figure A1 continue to be in a similar position in Figure A2. Populous countries such
as China and Indonesia tend to have low VS and VSG shares.
– Figure A2 –
export-oriented and competitive in the parts and components sector―such as
29
Table A1. Sector classification of the OECD ICIO table
AGR Agriculture, hunting, forestry, and fishing PVH Private households with employed persons
MIN Mining and quarrying
FOD Food products, beverages, and tobacco HC Household consumption
TEX Textiles, textile products, leather, and footwear NPI Non-profit institution serving household
WOD Wood and products of wood and cork GGF General government final consumption
PAP Pulp, paper, paper products, printing, and publishing GFC Gross fixed capital formation
PET Coke, refined petroleum products and nuclear fuel INV Changes in inventories
CHN Chemicals and Chemical products CON Direct purchase abroad by residents
RBP Rubber and plastic products DISC Discrepancies
NMM Other non-metallic mineral products
MET Basic metals VA Value added
FBM Fabricated metal products CT Output at basic prices
MEQ Machinery and equipment, nec
CEQ Computer, Electronic and optical equipment
ELQ Electrical machinery and apparatus, nec
MTR Motor vehicles, trailers, and semi-trailers
TRQ Other transport equipment
OTM Manufacturing nec; recycling
EGW Electricity, gas, and water supply
CON Construction
WRT Wholesale and retail trade; repairs
HTR Hotels and restaurants
TRN Transport and storage
PTL Post and telecommunications
FIN Financial intermediation
REA Real estate activities
RMQ Renting of machinery and equipment
ITS Computer and related activities
BZS R&D and other business activities
GOV Public admin. and defence; compulsory social security
EDU Education
HTH Health and social work
OTS Other community, social and personal services
30
Figure 1. VS share of the CEQ sector (1995, 2011)
0 10 20 30 40 50 60 70 80
VNM SGP PHL THA MYS TWN CHN IDN KOR JPN SEA AVG
NEA AVG
EA AVG
(HUN) (MEX)
1995 2011
Source: Calculated from the OECD ICIO tables (1995, 2011)
1. SEA: Southeast Asia, NEA: Northeast Asia, EA: East Asia, EUR: Europe, NAM: North America ROW: Rest of the World, PRI: primary industry, MAN: manufacturing industry, SER: service
industry (the symbols are the same for Tables 1-10)
Figure 2. VS share of the MTR sector (1995, 2011)
0 10 20 30 40 50 60 70 80
SGP VNM THA PHL MYS TWN IDN KOR CHN JPN SEA AVG
NEA AVG
EA AVG
(HUN) (MEX)
1995 2011
31
Figure 3. Decomposition of the VS share by country of origin: CEO sector in Korea (1995, 2011)
0 2 4 6 8 10 12 14 16 18 20 JP N U S A D E U T W N C
HN AUS
G B R S A U S G P F R A C A N ID N MY S IT A C HE R U S T
HA PHL
S W E HK G S E A N E A E U R N A M R O W 1995 2011
Source: Calculated from the OECD ICIO tables (1995, 2011)
Figure 4. Decomposition of the VS share by country of origin: CEO sector in Thailand (1995, 2011)
0 5 10 15 20 25 30 35 JP N U S A S G P T W N D E U K O R MY S G B R C HE C
HN FRA
A U S P H L IT A R U S F IN S W E HK G ID N N LD S E A N E A E U R N A R O W 1995 2011
32
Figure 5. Decomposition of the VS share by industry of origin: CEO sector in Korea (2011)
0 10 20 30 40 50 60 70
domestic foreign
Source: Calculated from the OECD ICIO tables (2011)
Figure 6. Decomposition of the VS share by industry of origin: CEO sector in Thailand (2011)
0 10 20 30 40 50 60
domestic foreign
33
Figure 7. Decomposition of the VS share by country of origin: MTR sector in Korea (1995, 2011)
0 2 4 6 8 10 12 14 16 JP N U SA D E U A U S C
HN GBR
SA U R U S FR A IT A C A N ID N T W N C HL MY S ZA F C HE SG P BRA SW E SE A N EA E U R N A M R O W 1995 2011
Source: Calculated from the OECD ICIO tables (1995, 2011)
Figure 8. Decomposition of the VS share by country of origin: MTR sector in Thailand (1995, 2011)
0 5 10 15 20 25 30 JP N U S A D E U K O R A U S T W N R U S G B R C
HN FRA
S G P MY S IT A C
HE IDN
S W E S A U N LD C A N HK G S E A N E A E U R N A R O W 1995 2011
34
Figure 9. Decomposition of the VS share by industry of origin: MTR sector in Korea (2011)
0 10 20 30 40 50 60 70
domestic foreign
Source: Calculated from the OECD ICIO table (2011)
Figure 10. Decomposition of the VS share by industry of origin: MTR sector in Thailand (2011)
0 10 20 30 40 50 60
domestic foreign
35
Figure 11.a. Flow of upstream transactions: CEQ sector in Korea (2011)
V.A. activity Intermediate (1) Intermediate (2 ) Final product
CEQ CEQ 32.6 100 BZS 4.8 WRT 4.6 CEQ FIN 41.9 1.9 WRT CHM 6.1
1.6 PET BZS
MET 1.5 5.7
1.4 CHM CHM
NMM 3.0 4.2
1.3 CHM RBP
RBP 1.3 3.8
1.2 NMM
ELQ 3.4
1.1 ELQ
TRN 3.3
1.1 MET MET
4.0 2.7
ROW MIN FBM
2.2 1.8
MEQ
JPN WRT 1.4
1.8 EGW
JPN CEQ 1.3
1.6 FIN
1.1 USA CEQ
1.7 CHN CEQ CHN CEQ
2.0 7.5
CHN CEQ CHN WRT
1.6 1.2
CHN WRT
1.6 JPN CEQ
2.8
SAU MIN JPN WRT
1.4 1.1 USA CEQ 2.1 TWN CEQ 2.0 SGP CEQ 1.2 CEQ (input)
Source: Calculated from the OECD ICIO table (2011)
36
Figure 11.b. Flow of downstream transactions: CEQ sector in Korea (2011)
Primary input Intermediate (1) Intermediate (2) Final product
CEQ HC
100 7.8
GFC 7.0
CON GFC
CEQ (output) 1.7
41.9 INV
MEQ 2.5
2.2
MTR MTR CHN GFC
2.0 1.2 6.7
BZS CHN GFC
1.6 4.2
ELQ CHN CON CHN GFC
1.3 (output) 2.1
PTL CHN MEQ CHN GFC
1.1 (output) 1.1
TRQ CHN CEQ CHN HC
1 (output) 1.9
CHN CEQ CHN HC
CHN CEQ 6.3 1.2
24.4 CHN BZS
CHN ELQ 1.6 USA GFC
1.8 1.7
CHN BZS USA GFC
1.1 1.2
CHN MEQ USA GOV USA GFC
1.0 (output) 1.0
USA HC
TWN CEQ 1.4
1.9 (output)
CEQ
Source: Calculated from the OECD ICIO table (2011)
1. The arrow indicates the direction of forward linkage effects (Figure 11.b-14.b).
37
12.a. Flow of upstream transactions: CEQ sector in Thailand (2011)
V.A. activity Final product
CEQ CEQ 17.6 100 WRT 4.3 FIN 2.4 CEQ EGW 15.1 1.2 WRT TRN 4.6 1.1 RBP 2.5
JPN CEQ TRN
3.8 2.3
JPN WRT NMM
3.3 2.2
JPN MET FIN
1.3 2.0
EGW
CHN CEQ 1.9
2.7 BZS
CHN WRT 1.2
2.3 ELQ
1.1
ROW MIN MET
2.4 1.1
USA CEQ CHN CEQ CHN CEQ CHN MET CHN MET
2.4 3.3 12.4 1.2 (input)
CHN WRT
TWN CEQ 1.9
1.3
JPN CEQ JPN CEQ
1.6 7.2
JPN WRT 2.3
JPN MET JPN MET
1.7 1.3
MYS CEQ 2.8
USA CEQ 2.7
TWN CEQ TWN CEQ
1.2 2.6 SGP CEQ 1.4 KOR CEQ 1.2 CEQ (input) Intermediate (1) Intermediate (2)
38
12.b. Flow of downstream transactions: CEQ sector in Thailand (2011)
s
Primary input Intermediate (1) Intermediate (2) Final product
CEQ GFC
100 3.4
HC 1.1
CEQ CHN GFC
15.1 6.6
MEQ CHN CEQ CHN GFC
1.1 (output) 4.4
CHN CON CHN GFC
CHN CEQ (output) 2.0
24.2 CHN MEQ CHN GFC
CHN ELQ (output) 1.1
1.7 CHN BZS CHN HC
CHN BZS 1.6 1.8
1.1 CHN CEQ CHN HC
6.4 1.2
MYS CEQ
2.7 USA HC
3.3
JPN CEQ USA PTL USA HC
1.8 (output) 1.3
USA GOV USA GGF
TWN CEQ (output) 1.7
1.6 USA GFC
4.2
KOR CEQ USA GFC
1.4 1.3
USA PTL JPN GFC
1.4 1.9
USA CEQ JPN HC
1.3 1.9
MEX CEQ ROW GFC
1.0 1.2
(output) CEQ
39
13.a. Flow of upstream transactions: MTR sector in Korea (2011)
V.A. activity Intermediate (3 ) Final product
MTR MTR
30.5 100
WRT 4.9 MET
3.3 OTM MTR
RBP 3.0 47.2
3.0 PET CHM RBP
BZS 1.4 3.2 9.7
2.8 MET MET
FIN 9.7 7.9
2.10 RBP WRT
CHM 1.1 5.5
1.50 MEQ
FBM 4.2
1.50 ELQ
MEQ 3.5
1.5 MET FBM
CEQ 1.4 3.3
1.4 CEQ CEQ
ELQ 1.8 3.3
1.30 BZS
TRN 2.3
1.2 CHM
1.4 ITS 1.2
ROW MIN FIN
2.60 1.1
JPN WRT DEU MTR
1.6 1.8
SAU MIN CHN MTR CHN MET CHN MET
1.6 1.3 1.2 (input)
JPN MTR JPN MET JPN MET
1.1 1.0 (input)
Intermediate (1) Intermediate (2)
MTR (input)
40
13.b. Flow of downstream transactions: MTR sector in Korea (2011)
Primary input Intermediate (1) Intermediate (2) Final product
MTR GFC
100 12.7
CON GFC
(output) 2
HC
MTR 11.2
47.2 OTS HC
OTS (output) 2.2
3.6
TRN USA HC
2.8 5.1
MEQ USA MTR USA HC
2.0 (output) 1.4
CON USA GFC
1.2 2.1
USA MTR ROW GFC
3.0 3.1
ROW HC
CHN MTR CHN MTR 1.3
2.9 1.6
SAU GFC
ROW OTS 1.9
1.8
ROW MTR CHN GFC
1.6 2.4
CHN MTR CHN GFC
(output) 1.5
BRA HC 1.7
(output) MTR
41
14.a. Flow of upstream transactions: MTR sector in Thailand (2011)
V.A. activity Final product
MTR MTR
25.7 100
WRT 3.3
FIN
2.3 MTR
MEQ 24.5
2.2 MEQ MEQ
EGW 2.4 7.3
1.2 MET
3.2
JPN WRT WRT
3.5 2.8
JPN MET RBP
3.0 2.4
JPN MTR ELQ
1.9 2.0
FIN
SAU MIN 1.8
1.1 EGW
1.6
CHN MET FBM
1.0 1.3
TRN
ROW MIN JPN MTR 1.0
3.3 3.3
JPN WRT JPN MTR
1.2 5.0
JPN MET JPN MET
4.0 4.1
JPN WRT 2.3
AUS MET 1.9
KOR MET KOR MET
2.0 1.4
CHN MET CHN MET
1.7 1.5
ROW MIN ROW MET
1.0 1.3
PHL MTR 1.2
Intermediate (1) Intermediate (2)
MTR (input)
42
14.b. Flow of downstream transactions: MTR sector in Thailand (2011)
Primary input Intermediate (1) Intermediate (2) Final product
MTR GFC
100 31.3
HC 12.0 INV
MTR 2.0
24.5
WRT AUS GFC
2.3 3.3
AUS HC
IDN OTS 3.1
2.0
IDN MTR SAU GFC
1.8 2.5
JPN MTR JPN MTR IDN GFC
1.6 1.1 1.4
IDN HC
MYS MTR 2.2
1.3 IDN OTS IDN HC
(output) 1.1
ROW OTS
2.0 PHL GFC
ROW MTR 1.4
1.8
MYS GFC 1.4
ROW GFC 3.3 ROW HC
1.4 (output)
MTR
43
Figure A1. VS and VSG shares: CEQ sector (2011)
HUN JPN KOR MEX CHN IDN MYS PHL SGP THA TWN VNM 0 20 40 60 80 100
0 20 40 60 80 100
V S s h a re VSG share
Source: Calculated from the OECD ICIO table (2011)
Figure A2. VS and VSG shares: MTR sector (2011)
HUN JPN KOR MEX CHNIDN MYS PHL SGP THA TWN VNM 0 20 40 60 80 100
0 20 40 60 80 100
V S s h a re VSG share