Abstract:
It is widely accepted that vitamin E (VE) acts as an antioxidant and is involved in various metabolic systems including the regulation of gene expression and inhibition of cell proliferation. The most predominant isoform of VE in the living body is α-tocopherol. However, the influence of α-tocopherol on bone marrow mesenchymal cells (BMMCs) in a background of type II diabetes mellitus (DM) has not been investigated. The focus of the present study was to clarify the effect of α-tocopherol on BMMCs derived from rats with type II DM and the under- lying mechanisms involved. BMMCs were isolated from rats with type II DM. The BMMCs were either untreated or exposed to α-tocopherol at concentra- tions of 1.0, 10, and 100 μM, and the resulting effects of α-tocopherol on cell proliferation, H2O2 activity, and antioxidant and inflammatory cytokine produc- tion were examined. At 100 μM, α-tocopherol had no effect on cell proliferation, but H2O2 activity was significantly increased. At 10 μM, α-tocopherol increased the gene expression of IL-1β, and markedly promoted that of TNF-α. Expression of catalase in the presence of 100 μM α-tocopherol was lower than for the other concentrations. At a low concentration, α-tocopherol exerted good antioxidant and anti- inflammatory effects on BMMCs. The study suggests that maintaining α-tocopherol at a low concentrationmight promote the recovery of BMMCs from oxida- tive stress.
Keywords: bone marrow cells; vitamin E; diabetes mellitus.
Introduction
Bone is a dynamic tissue that is constantly remodeled and regenerated throughout life in response to biochemical and mechanical signals. This continuous bone remod- eling occurs through a process of whereby the proportion of osteoclasts relative to osteoblasts is controlled in a local, coordinated, and sequential manner to maintain a balance between bone resorption and formation (1).
Type II diabetes mellitus (DM) is characterized by an increased degree of oxidative stress and a decline in antioxidant defense. Several studies have demonstrated increased oxidative stress in diabetic patients, especially those with poor glycemic control (2). It is well known that DM is associated with the development of periodon- titis, which can lead to tooth loss (3). Oxidative stress damages osteoblasts and affects their differentiation and survival (4).
Increased oxidative stress also leads to increased signaling by osteoclasts, promoting their differentiation (5). Production of free radicals is increased in patients with non-insulin-dependent DM (NIDDM) (6,7) and those with essential hypertension (8,9), but the mechanism responsible for the linkage between increased oxidative stress, impaired glucose metabolism, and blood pressure is still controversial. Usually, these active oxygen species are eliminated by active oxygen-degrading enzymes and low-molecular-weight antioxidants such as catalase (CAT), which protect tissues from injury.
Journal of Oral Science, Vol. 60, No. 4, 579-587, 2018 Original
Effects of α-tocopherol on bone marrow mesenchymal cells derived from type II diabetes mellitus rats
Masahiro Noguchi, Isao Yamawaki, Saitatsu Takahashi, Yoichiro Taguchi, and Makoto Umeda
Department of Periodontology, Osaka Dental University, Hirakata, Japan
(Received November 6, 2017; Accepted December 28, 2017)
Correspondence to Dr. Yoichiro Taguchi, Department of Peri- odontology, Osaka Dental University, 8-1 Kuzuhahanazonocho, Hirakata, Osaka 573-1121, Japan
Fax: +81-72-864-3184 E-mail: [email protected] doi.org/10.2334/josnusd.17-0422
DN/JST.JSTAGE/josnusd/17-0422
Vitamin E (VE) is localized in the phospholipid bilayer of the cell membrane and protects unsaturated fatty acids or other components that form the biological membrane from oxidative damage. In VE-deficient animals, in addi- tion to infertility, symptoms such as cerebral thrombosis, hepatic necrosis, nephropathy, hemolytic anemia, and muscular dystrophy develop.
The role of VE as an antioxidant in vivo is widely accepted, but recently many non-antioxidant functions of α-tocopherol, a major VE isoform, have been described at the cellular level, such as prevention of chromosomal damage, coal burning fluorosis-induced, endogenous antioxidant, oxidative stress evidenced by lower MDA levels, and higher degrees of immunostaining for VEGF and PARP-1 (10-14). VE is reportedly involved in various metabolic systems including the regulation of gene expression and specific binding proteins, and inhibi- tion of cell proliferation (15). These functions cannot be explained in terms of the antioxidant effect of VE (16). VE is known to have a positive effect on bone metabolism;
in normal male rats, VE increases bone formation and decreases bone resorption (17). Ebina et al. have reported that Fe-induced impairment of bone formation in rats was prevented by dietary VE supplementation (18). In addition, VE has been shown to stimulate trabecular bone formation in chicks (19). VE supplementation reduces the level of oxidative stress in diabetic patients and improves the action of insulin. A total of 8 VE homologs are known, including 4 types of tocopherol and 4 types of tocotrienol. These are characterized as α-, β-, γ-, and δ-forms based on the number of methyl groups on the chromanol ring. The most common VE homolog in blood and tissues is α-tocopherol. VE is absorbed from food as a mixture of tocopherols and tocotrienols and transported to the liver, where α-tocopherol transfer protein mediates the selective transfer of α-tocopherol to lipoproteins (7). Mice deficient in α-tocopherol transfer protein develop ataxia and infertility as a result of reduced serum α-tocopherol concentrations, but this can be reversed by dietary supplementation with α-tocopherol (20,21).
Against this background, we investigated the function of α-tocopherol in the present study.
Recent studies investigating the inhibitory action of α-tocopherol on cell proliferation concluded that its effect was exerted at the level of genetic information transmis- sion (22,23). α-Tocopherol has also been reported to have hypocholesterolemic, anti-cancer, anti-diabetic, and neuroprotective properties (24), suggesting that it might affect bone formation and bone remodeling. However, the direct effects of α-tocopherol on bone tissue at the cellular level are unclear. Despite previous in vivo studies
on bone metabolism, little is known about the effects of α-tocopherol on bone marrow mesenchymal cells in rats with type II DM.
A recent study has shown that ingestion of excess α-tocopherol by mice activates giant osteoclasts, leading to bone resorption and osteoporosis (25). However, no detailed investigation of the influence of α-tocopherol on bone marrow mesenchymal cells in DM has been reported. The effect of α-tocopherol has been investi- gated in relation to periodontology, however (26-29).
α-Tocopherol activates osteoclasts by promoting the production of osteoclast activating factor from osteo- blasts while suppressing the proliferation of the latter, leading to osteoporosis. Large doses of α-tocopherol may be helpful for reducing the risk of heart disease and stroke in patients with type II DM (30). In the present study, we investigated the effect of α-tocopherol on cell prolif- eration, H2O2 activity, and antioxidant and inflammatory cytokine production by bone marrow mesenchymal cells (BMMCs) under well-controlled glucose concentra- tions. It was anticipated that clarifying the dynamics of α-tocopherol might lead to therapeutic avenues for bone marrow cell oxidative stress such as that in patients with type II DM.
Materials and Methods
Cell culture
BMMCs were isolated from the femurs of 8-weeks- old GK rats, a model of type II DM. Briefly, rats were euthanatized using 4% isoflurane (Pfizer Inc., NY, USA), and the bones were aseptically excised from the hind limbs. The proximal end of the femur and the distal end of the tibia were clipped. A 21-gauge needle (Terumo, Tokyo, Japan) was inserted into a hole in the knee joint of each bone, and the marrow was flushed from the shaft with growth medium containing Eagle’s minimal essential medium (EMEM; Nakarai Tesque Inc., Kyoto, Japan) supplemented with 10% fetal bovine serum (FBS;
Fraction V: Pierce Biotechnology, Waltham, IL, USA), penicillin (500 U/mL; Nakarai Tesque Inc.), strepto- mycin (500 μg/mL; Nakarai Tesque Inc.) and fungizone (1.25 μg/mL; Nakarai Tesque Inc.). The resulting marrow pellet was dispersed by trituration, and cell suspensions from all bones were combined in a centrifuge tube. Cells at passages 3-5 were seeded at a density of 5.0 × 10⁴ cells/cm2 into 24-well or 96-well tissue culture plates (Becton Dickinson Labware, Franklin Lakes, NJ, USA) containing titanium disks. The cells were cultured at 37°C in a humidified 5% CO2/95% air atmosphere.
This study was performed under the Guidelines for Animal Experimentation of Osaka Dental University
(Approval No. 1508001).
α-Tocopherol concentration
The α-tocopherol concentrations used for this study were chosen to reflect normal, excessive and deficient levels, i.e., 10 μM, 100 μM, and 1.0 μM, respectively.
After culture of GK-BMMCs for 2 days, the medium was removed and replaced with growth medium containing 10% FBS and α-tocopherol.
Cell proliferation
Proliferation of GK-BMMCs was measured using the Cell Titer-Blue Cell Viability Assay (Promega, Madison, WI, USA) in accordance with the manufacturer’s protocol. Briefly, GK-BMMCs were seeded on the samples at a density of 5.0 × 10⁴ cells/cm2. After culture of GK-BMMCs for 2 days, the medium was removed and replaced with growth medium containing EMEM (Nararai Tesque Inc.) supplemented with 10% fetal bovine serum (FBS; Fraction V: Pierce Biotechnology), penicillin (500 U/mL; Nakarai Tesque Inc.), streptomycin (500 μg/mL;
Nakarai Tesque Inc.), fungizone (1.25 μg/mL; Nakarai Tesque Inc.) and α-tocopherol (four concentrations), and the cells were allowed to attach for 1, 3, and 24 h.
To dissolve the highly lipophilic α-tocopherol in aqueous culture media, α-tocopherol (Nakarai Tesque Inc.) was dissolved in dimethyl sulfoxide at various concentrations. The resulting 0, 1.0, 10, or 100 μM α-tocopherol solutions were added to GK-BMMCs for 1, 3, or 24 h.
At each prescribed time point, non-adherent cells were removed by rinsing with phosphate-buffered saline (PBS). Cell Titer-Blue Reagent (50 μL) and PBS (250 μL) were then added to each well. After incubation at 37°C for 1 h, the solution was removed from the 96-well tissue culture plates and 100 μL was added to a new 96-well tissue culture plate. The OD560/590 value of the remaining solution was measured. The difference between the two optical densities was defined as the proliferation value.
Measurement of H2O2 activity
H2O2 activity levels were measured directly in the culture supernatant with α-tocopherol (four concentrations) after 1, 3, or 24 h of growth culture using a hydrogen peroxide fluorometric detection kit (Enzo Biochem Inc., Farming- dale, NY, USA) in accordance with the manufacturer’s instructions.
Quantitative real-time PCR analysis
Gene expression was evaluated using a real-time reverse-
transcription polymerase chain reaction (PCR) assay (TaqMan; Applied Biosystems, Thermo Fisher Scientific, Foster City, CA, USA). GK-BMMCs were seeded at a density of 5.0 × 10⁴ cells/cm2 in normal culture medium (1 mL/well). The medium was replaced with growth medium containing α-tocopherol (0, 1.0, 10, 100 μM), and the cells were cultured for a further 3 and 24 h. Total RNA was isolated using an RNeasy Mini Kit (QIAGEN, Hilden, Germany). RNA (10 μL) from each sample was reverse-transcribed into complementary DNA using a PrimeScript Reagent Kit (Takara Bio, Shiga, Japan).
Gene expression for tumor necrosis factor-α (TNF-α), interleukin (IL)-1β and IL-6 (Taqman Gene Expression Assay: TNF-α; Rn01525859_g1, IL-1β; Rn00580432_
m1, IL-6; Rn01410330_m1) was quantified using the StepOnePlus Real-Time PCR System (Applied Biosys- tems, Thermo Fisher Scientific). The reactive gene expression rate in each group was calculated using the
∆∆Ct method, relative to the gene expression rate in the negative control group.
Western blot Analysis
The ERK signaling pathway is a subfamily of the MAPK signaling pathway, which is activated by epidermal growth factor, serum stimulation, and oxidative stress.
The ERK signaling pathway is activated by hydrogen peroxide and osmotic stimulation (31); therefore, in this study we aimed to investigate the relationship between the ERK signaling pathway and oxidative stress.
Total protein was extracted using a buffer solution supplemented with a protease inhibitor cocktail. Total protein concentrations were measured using a TaKaRa BCA Protein Assay Kit (Takara Bio). Protein samples were electrophoresed in 12.5% sodium dodecyl sulfate gel for 30 min and transferred onto polyvinylidene difluoride membranes using a wet system for 65 min.
The membranes were treated with blocking solution and incubated overnight at 4°C with a primary antibody (phospho-Extracellular Signal-regulated Kinase; pERK, Cell Signaling Technology, Danvers, MA, USA). This was followed by incubation with horseradish peroxidase- conjugated secondary antibodies for 1 hour at room temperature. Immunoreactive bands were visualized using a chemiluminescence kit, and signals were detected with a western blot system.
Measurement of catalase activity
The catalase (CAT) activity in GK-BMMCs was measured using a Catalase Assay Kit (Cayman Chemical, Ann Arbor, MI, USA) after 3 and 24 h of culture. The method was based on the reaction of CAT with methanol
in the presence of H2O2. The formaldehyde produced was then measured chromatically (450 nm) with 4-amino-3- hydrazino-5-mercapto-l,2,4-triazole as the chromogen.
In brief, 20 μL of cell supernatant obtained by scraping, sonicating, and centrifugation (10,000 ×g, 15 min) of a cell monolayer (2.0 × 10⁶ cells) in a cold environment (4°C) was added to 100 μL of assay buffer (100 mM potassium phosphate, pH 7.0) and 30 μL methanol in a 96-well plate.
Standards were prepared by mixing 100 μL of assay buffer with 30 μL methanol and 20 μL formaldehyde (0, 5, 15, 30, 45, 60, or 75 μM). The reaction was started by adding 20 μL diluted H2O2 (40 μL H2O2 with 9.96 mL HPLC grade water) into all wells. The plate was then incubated for 20 min at room temperature on a shaker.
The reaction was stopped by adding 30 μL 0.5 M KOH and 30 μL chromogen, and the plate was measured spec- trometrically (540 nm) using an ELISA reader (Molecular Devices, Sunnyvale, CA, USA). The standard curve of absorbance versus formaldehyde concentration was plotted, and used to calculate formaldehyde concentra- tions in the samples.
CAT activity was expressed as nmol/min/mL by assuming that 1 unit of enzyme produces 1 nmol of formaldehyde at 25°C.
Statistical analysis
Data were analyzed using SPSS 19.0 software (IBM,
Armonk, NY, USA). All experiments were performed in triplicate. All data are shown as the means ± standard deviation (SD). In all analyses, statistical significance was determined using one-way analysis of variance (ANOVA) followed by Bonferroni’s Least Significant Difference test. Differences at P < 0.05 were considered significant.
Results
Cell proliferation
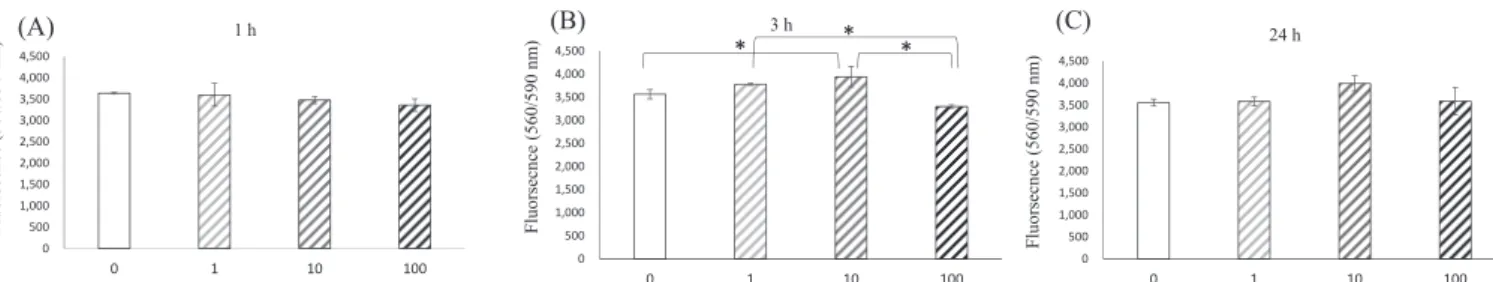
Proliferation of GK-BMMCs after 1, 3, and 24 h of culture was assessed using four concentrations of α-tocopherol in growth medium (Fig. 1). α-Tocopherol promoted cell proliferation at 1.0 and 10 μM after 3 h of culture, but there was no significant difference in cell proliferation between these α-tocopherol concentrations after 1 h and 24 h of culture.
H2O2 activity
H2O2 activities were determined using four concentra- tions of α-tocopherol in growth medium at 1, 3, and 24 h of culture (Fig. 2). H2O2 activity in the presence of 100 μM α-tocopherol was significantly higher than at other concentrations at all time points. Additionally, H2O2 activity in the presence of 1.0 μM α-tocopherol was similar to that of untreated cells (0 μM) at all time points, and that in the presence of 10 μM was similar to that at 0 μM except after 3 h of culture.
0 500 1,000 1,500 2,000 2,500 3,000 3,500 4,000 4,500
0 1 10 100
3 h
0 500 1,000 1,500 2,000 2,500 3,000 3,500 4,000 4,500
0 1 10 100
1 h
0 500 1,000 1,500 2,000 2,500 3,000 3,500 4,000 4,500
0 1 10 100
* * * 24 h
Fluorsecnce(560/590 nm) Fluorsecnce(560/590 nm) Fluorsecnce(560/590 nm)(A) (B) (C)
0 0.5 1 1.5 2
0 1 10 100
1 h
0 0.5 1 1.5 2
0 1 10 100
3 h
*
0 0.5 1 1.5 2
0 1 10 100
* * * * 24 h
*
* * * *
H2O2
(A) (B) (C)
H2O2(μM)
(μM) H2O2(μM)
Fig. 1 Proliferation of GK-BMMCs (A) after 1 h of incubation, (B) after 3 h of incubation, and (C) after 24 h of incubation in medium containing α-tocopherol at four concentrations (0, 1.0, 10, and 100 μM) measured by the Cell Titer-Blue Cell Viability Assay. *P < 0.05.
Fig. 2 H2O2 activities of GK-BMMCs (A) after 3 h of incubation, (B) after 6 h of incubation, and (C) after 24 h of incubation in medium containing α-tocopherol at four concentrations (0, 1.0, 10, and 100 μM) measured by a hydrogen peroxide fluorometric detection kit. *P
< 0.05.
Inflammatory cytokine expression
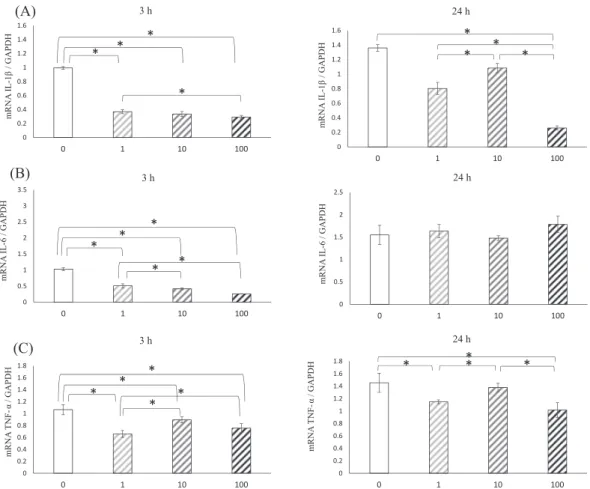
The expression of inflammatory cytokine genes, including IL-1β, IL-6, and TNF-α was assessed by real-time PCR after 3 and 24 h of culture with the four concentrations of α-tocopherol (Fig. 3). Gene expression of IL-1β (Fig.
3a) was lower in the treated groups than in the untreated
group at all time points. Although α-tocopherol at 10 μM increased the gene expression of IL-1β, this was signifi- cantly decreased in the presence of 100 μM α-tocopherol after 24 h of culture. Gene expression of IL-6 (Fig. 3b) was lower in the treated groups than in the untreated group, and that at 100 μM was significantly lower after 3 h of culture.
However, gene expression of IL-6 was the same regardless of the α-tocopherol concentration after 24 h of culture. Gene expression of TNF-α (Fig. 3c) was lower in the treated groups tha in the untreated group. Addi- tionally, α-tocopherol at 10 μM increased TNF-α gene expression relative to other α-tocopherol concentrations at all time points.
Normal α-tocopherol activates the ERK signaling pathway
The levels of expression of proteins involved in the ERK signaling pathway were assessed by western blotting after 24 h of culture with four concentrations of α-tocopherol (Fig. 4). α-Tocopherol at 10 and 100 μM increased the Fig. 3 Inflammatory cytokine gene expression by GK-BMMCs cultured for 3 and 24 h in growth medium
containing four α-tocopherol concentrations (0, 1.0, 10, and 100 μM), IL-1β (A), IL-6 (B), TNF-α (C). Data were obtained by real-time PCR analysis and are shown as means ± SD expressed relative to GAPDH. *P < 0.05.
Fig. 4 Effects of various α-tocopherol concentrations (0, 1.0, 10, and 100 μM) on the ERK signaling pathway.
0 0.2 0.4 0.6 0.8 1 1.2 1.4 1.6
0 1 10 100
24 h
0 0.2 0.4 0.6 0.8 1 1.2 1.4 1.6
0 1 10 100
3 h
* *
*
*
* *
* *
0 0.5 1 1.5 2 2.5 3 3.5
0 1 10 100
3 h
0 0.5 1 1.5 2 2.5
0 1 10 100
24 h
* *
* * *
mRNA IL-1β/ GAPDHmRNA IL-6 / GAPDH mRNA IL-1β/ GAPDHmRNA IL-6 / GAPDH
(A)
(B)
0 0.2 0.4 0.6 0.8 1 1.2 1.4 1.6 1.8
0 1 10 100
3 h
0 0.2 0.4 0.6 0.8 1 1.2 1.4 1.6 1.8
0 1 10 100
24 h
* *
* *
* ** *
*
mRNA TNF-α/ GAPDH
mRNA TNF-α/ GAPDH
(C)
levels of ERK signaling pathway proteins, the greatest change being evident at 10 μM.
Catalase production by GK-BMMCs
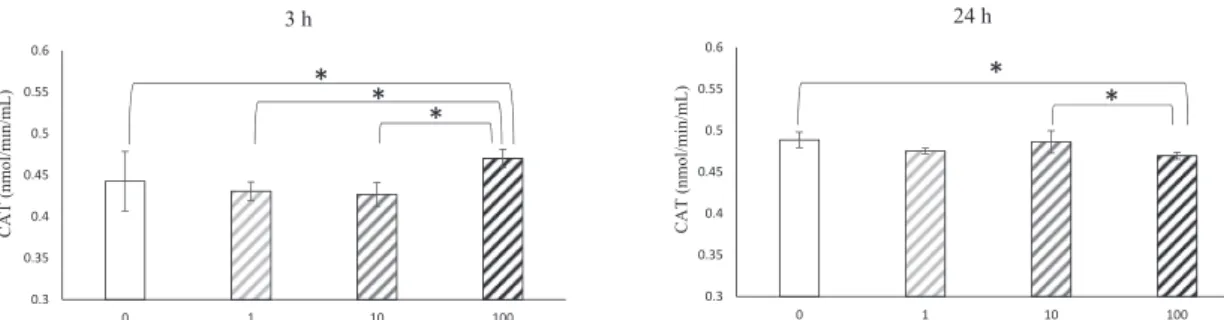
The expression levels of CAT were assessed after 3 and 24 h of culture with the four concentrations of α-tocopherol (Fig. 5). Expression levels of CAT were high after incuba- tion with 100 μM α-tocopherol compared with the other concentrations. There was no significant difference in CAT levels in the 0, 1.0 and 10 μM α-tocopherol groups after 3 h of culture. However, after 24 h of culture, the levels of CAT in the 100 μM group were lower than for other α-tocopherol concentrations. There was no signifi- cant difference in CAT levels between the 0, 1.0, and 10 μM α-tocopherol groups.
Discussion
The physiological activity of VE has been evaluated from both nutritional and medical viewpoints. Specific oxida- tive stress reflects a state of VE deficiency or excess, and measurement of VE can indicate the degree of influence it has at any particular time.
When the blood α-tocopherol concentration is within the range 6-12 μmol/L, the hemolysis reaction due to hydrogen peroxide is increased, and this is used as an indicator of VE nutritional status (32). For this purpose, 1.0 μM VE can be defined as a deficient concentration, 10 μM as normal, and 100 μM as an excess.
Osteoblast differentiation and proliferation are not altered by α-tocopherol treatment, indicating that VE affects bone mass through osteoclasts rather than osteo- blasts (33). This reflects the finding that α-tocopherol treatment did not alter the proliferation of GK-BMMCs.
Tocopherol has several functions at the cellular level that are independent of its antioxidant properties. One of the most important of its non-antioxidant functions is inhibition of protein kinase C activity through dephos- phorylation of the enzyme, resulting in inhibition of cell
proliferation (34-37). α-Tocopherol is also reported to have positive effects on bone regeneration (38). Studies of bone mineralization and formation, and the thickness of mineralized zones in growth cartilage have suggested that VE is important for bone formation and mineraliza- tion, and for normal endochondral ossification. These results suggest a protective role for VE against lipid peroxidation in cartilage and bone cells, which show optimal activity during bone modeling and endochondral ossification (39). Furthermore, VE has been shown to increase bone strength without a change in bone density (38,40), suggesting higher proliferation of osteoblast-like cells. It is clear that this breakdown of balance between active oxygen and antioxidant enzyme leads to disease, oxidative stress and disease, which in turn are closely related to diabetes. Oxidative stress caused by increased reactive oxygen species leads to deterioration of disease states. Clinical and experimental studies have implicated oxidative stress in the development of osteoporosis (41,42), and an increased level of oxidative stress leads to decreased differentiation and survival of osteoblasts (43).
In a healthy state, cell proliferation is suppressed in a concentration-dependent manner, and this is maintained by continuous α-tocopherol stimulation. In addition, the production of IL-6 and IL-1β by osteoblasts is dependent on α-tocopherol concentration. MC3T3-E1 adhesion and cell proliferation are remarkably suppressed by α-tocopherol (50 μM) stimulation. There- fore, α-tocopherol induces activation of osteoclasts by promoting the production of osteoclast activating factor from osteoblasts while suppressing the proliferation of osteoblasts, thus leading to osteoporosis (25). In this study, a high α-tocopherol concentration increased the proliferation of BMMCs and decreased their production of inflammation cytokines.
Several studies have shown that high-dose α-tocopherol supplementation may have a negative effect on bones
0.3 0.35 0.4 0.45 0.5 0.55 0.6
0 1 10 100
3 h
0.3 0.35 0.4 0.45 0.5 0.55 0.6
0 1 10 100
24 h
* *
* * *
CAT (nmol/min/mL) CAT (nmol/min/mL)
Fig. 5 The expression levels of CAT were assessed after 3 and 24 h of culture in growth medium containing four α-tocopherol concentra- tions (0, 1.0, 10 and 100 μM). Data were obtained by real-time PCR analysis and are shown as means ± SD expressed relative to GAPDH.
*P < 0.05.
in normal animals, whereas it has a protective role in
“stressed” animals (36,41). The GK rat is a model of type II DM “stress”. In this study, we used BMMCs derived from “stressed” animals. However, high α-tocopherol concentrations promoted H2O2 production, indicating a negative effect on GK-BMMCs.
Proinflammatory cytokines such as IL-1, IL-6, and TNF-α are important mediators of bone resorption (44) and are also implicated in the pathogenesis of postmeno- pausal osteoporosis (45).
α-Tocopherol is a natural biological antioxidant that protects cells from the damaging effects of free radicals by preventing the accumulation of peroxides (46). VE has also been reported to act as an anti-inflammatory agent by inhibiting key events of inflammation such as the release of IL-1β from activated monocytes (47), monocyte adhesion to endothelial cells (48) and the respiratory burst phenomenon (49). α-Tocopherol also reduced the level of IL-1β in this study.
Signaling by IL-6 promotes the activation of macro- phages to limit endotoxemia and obesity-associated insulin resistance, and high α-tocopherol concentrations have protective effects in “stressed” animals (50). High α-tocopherol concentrations are reported to increase IL-6 production in DM rats, and TNF-α induces the expression of TRANCE (RANKL/OPGL/ODF/TNFSF11/CD254) when acting on osteoblasts (51). In addition, previous studies have reported that TNF-α directly induces the differentiation of osteoclasts independent of TRANCE, and Choi et al. have reported the mechanism of TRANCE involvement in RANK knockout mice (52-54).
Normal α-tocopherol concentrations increase the expression of TNF-α, indicating a decrease of bone mass independent of its antioxidant activity. VE inhibits cell proliferation and the ERK signaling pathway, independent of its antioxidant effect (55). Thus, a high α-tocopherol concentration inhibits the ERK signaling pathway. This effect of α-tocopherol on the ERK signaling pathway was same that of TNF-α at 0 and 10 mM. TNF-α downregu- lates cell death-inducing DFF45-like effector C (CIDEC) expression through phosphorylation and nuclear export of PPARγ by the MEK/ERK cascade (56), suggesting that TNF-α triggers the ERK signaling pathway. In the early stage of α-tocopherol stimulation, VE may stabilize the mRNAs of antioxidant enzymes after transcription and enhance the translation of the derived enzyme proteins (57). Subsequently, H2O2 activity and CAT production are increased at all α-tocopherol concentrations.
It has been reported that the level of serum α-tocopherol is lower in type II DM patients than in healthy subjects (58,59). Several studies have demonstrated increased
oxidative stress in diabetic patients, especially those with poor glycemic control (60).
Oxidative stress is strictly controlled by a balance between the generation of active oxygen and its elimina- tion. Active oxygen is involved in the onset and progress of disease, and is necessary for maintenance of health by promoting defense from infectious diseases as well as having a role in signaling. A balanced diet containing vitamins with antioxidant capacity such as α-tocopherol might inhibit the overproduction of active oxygen, and antioxidant ability might be improved by exercise (61).
Patients with type II DM have a lower concentration of α-tocopherol than normal individuals. We suggest that type II DM patients could maintain a low concentra- tion of α-tocopherol by not taking it in the diet, as an increased concentration might be counterproductive.
Active oxygen is an important factor closely involved in biostabilization. As more patients are diagnosed with diabetes, it is thought that the relationship between health and oxidative stress will become more obvious.
This study has shown that the α-tocopherol concen- tration is related to H2O2 production, inflammation and oxidant enzyme production by GK-BMMCs. We suggest that a low α-tocopherol concentration has beneficial effects on GK-BMMCs, and that increasing the α-tocopherol concentration to a normal level would have adverse effects in terms of progressive inflamma- tion. Careful control of the α-tocopherol concentration is important for GK-BMMCs, and any increase in the α-tocopherol concentration is considered detrimental for patients with type II DM.
Acknowledgments
This work was supported by Grants-in-Aid for Scientific Research (16K11617, 16K20551, 17K11818, 17H07266) from the Japan Society for the Promotion of Science, and a Research Promotion Grant (16-02) from Osaka Dental University.
Conflict of interest
The authors have no conflict of interest to declare.
References
1. Hattner R, Epker BN, Frost HM (1965) Suggested sequential mode of control of changes in cell behaviour in adult bone remodelling. Nature 206, 489-490.
2. Giugliano D, Ceriollo A, Paolisso G (1996) Oxidative stress and diabetic vascular complications. Diabetes Care 19, 257-267.
3. Lalla E, Lamster IB, Drury S, Fu C, Schmidt AM (2000) Hyperglycemia, glycoxidation and receptor for advanced glycation endproducts: potential mechanisms underlying
diabetic complications, including diabetes-associated peri- odontitis. Periodontol 2000 23, 50-62.
4. Fatokun AA, Stone TW, Smith RA (2008) Responses of differentiated MC3T3-E1 osteoblast-like cells to reactive oxygen species. Eur J Pharmacol 587, 35-41.
5. Ha H, Kwak HB, Lee SW, Jin HM, Kim HM, Kim HH et al.
(2004) Reactive oxygen species mediate RANK signaling in osteoclasts. Exp Cell Res 301, 119-127.
6. Collier A, Wilson R, Bradley H, Thomson JA, Small M (1990) Free radical activity in type 2 diabetes. Diabet Med 7, 27-30.
7. Hwang C, Sinskey AJ, Lodish HF (1992) Oxidized redox state of glutathione in the endoplasmic reticulum. Science 257, 1496-1502.
8. Sagar S, Kallo IJ, Kaul N, Ganguly NK, Sharma BK (1992) Oxygen free radicals in essential hypertension. Mol Cell Biochem 111, 103-108.
9. Moran JP, Cohen L, Greene JM, Xu G, Feldman EB, Hames CG et al. (1993) Plasma ascorbic acid concentrations relate inversely to blood pressure in human subjects. Am J Clin Nutr 57, 213-217.
10. Loboda A, Damulewicz M, Pyza E, Jozkowicz A, Dulak J (2016) Role of Nrf2/HO-1 system in development, oxidative stress response and diseases: an evolutionarily conserved mechanism. Cell Mol Life Sci 73, 3221-3247.
11. Alqudah MAY, Al-Ashwal FY, Alzoubi KH, Alkhatatbeh M, Khabour O (2017) Vitamin E protects human lymphocytes from genotoxicity induced by oxaliplatin. Drug Chem Toxicol 41, 281-286.
12. Tian Y, Xiao Y, Wang B, Sun C, Tang K, Sun F (2017) Vitamin E and lycopene reduce coal burning fluorosis-induced sper- matogenic cell apoptosis via oxidative stress-mediated JNK and ERK signaling pathways. Biosci Rep, BSR20171003.
13. Eder K, Siebers M, Most E, Scheibe S, Weissmann N, Gessner DK (2017) An excess dietary vitamin E concentra- tion does not influence Nrf2 signaling in the liver of rats fed either soybean oil or salmon oil. Nutr Metab (Lond) 14, 71.
14. Omar SS, Aly RG, Badae NM (2017) Vitamin E improves testicular damage in streptozocin-induced diabetic rats, via increasing vascular endothelial growth factor and poly(ADP- ribose) polymerase-1. Andrologia, doi.org/10.1111/
and.12925.
15. Landrier JF, Gouranton E, El Yazidi C, Malezet C, Balaguer P, Borel P et al. (2009) Adiponectin expression is induced by vitamin E via a peroxisome proliferator-activated receptor gamma-dependent mechanism. Endocrinology 150, 5318- 5325.
16. Traber MG, Packer L (1995) Vitamin E: beyond antioxidant function. Am J Clin Nutr 62, 1501S-1509S.
17. Mehat MZ, Shuid AN, Mohamed N, Muhammad N, Soelaiman IN (2010) Beneficial effects of vitamin E isomer supplementation on static and dynamic bone histomorphom- etry parameters in normal male rats. J Bone Miner Metab 28, 503-509.
18. Ebina Y, Okada S, Hamazaki S, Toda Y, Midorikawa O
(1991) Impairment of bone formation with aluminum and ferric nitrilotriacetate complexes. Calcif Tissue Int 48, 28-36.
19. Murphy TP, Wright KE, Pudelkiewicz WJ (1981) An apparent rachitogenic effect of excessive vitamin E intakes in the chick. Poult Sci 60, 1873-1878.
20. Jishage K, Arita M, Igarashi K, Iwata T, Watanabe M, Ogawa M et al. (2001) Alpha-tocopherol transfer protein is important for the normal development of placental labyrinthine tropho- blasts in mice. J Biol Chem 276, 1669-1672.
21. Radimer K, Bindewald B, Hughes J, Ervin B, Swanson C, Picciano MF (2004) Dietary supplement use by US adults:
data from the National Health and Nutrition Examination Survey, 1999-2000. Am J Epidemiol 160, 339-349.
22. Azzi A, Boscoboinik D, Marilley D, Ozer NK, Stäuble B, Tasinato A (1995) Vitamin E: a sensor and an information transducer of the cell oxidation state. Am J Clin Nutr 62, 1337S-1346S.
23. Tasinato A, Boscoboinik D, Bartoli GM, Maroni P, Azzi A (1995) d-alpha-tocopherol inhibition of vascular smooth muscle cell proliferation occurs at physiological concentra- tions, correlates with protein kinase C inhibition, and is independent of its antioxidant properties. Proc Natl Acad Sci USA 92, 12190-12194.
24. Aggarwal BB, Sundaram C, Prasad S, Kannappan R (2010) Tocotrienols, the vitamin E of the 21st century: its potential against cancer and other chronic diseases. Biochem Phar- macol 80, 1613-1631.
25. Fujita K, Iwasaki M, Ochi H, Fukuda T, Ma C, Miyamoto T et al. (2012) Vitamin E decreases bone mass by stimulating osteoclast fusion. Nat Med 18, 589-594.
26. Nizam N, Discioglu F, Saygun I, Bal V, Avcu F, Ozkan CK et al. (2014) The effect of α-tocopherol and selenium on human gingival fibroblasts and periodontal ligament fibroblasts in vitro. J Periodontol 85, 636-644.
27. Chung JH, Kim YS, Noh K, Lee YM, Chang SW, Kim EC (2014) Deferoxamine promotes osteoblastic differentiation in human periodontal ligament cells via the nuclear factor erythroid 2-related factor-mediated antioxidant signaling pathway. J Periodontal Res 49, 563-573.
28. Dodington DW, Fritz PC, Sullivan PJ, Ward WE (2015) Higher intakes of fruits and vegetables, β-carotene, vitamin C, α-tocopherol, EPA, and DHA are positively associated with periodontal healing after nonsurgical periodontal therapy in nonsmokers but not in smokers. J Nutr 145, 2512-2519.
29. Torshabi M, Rezaei Esfahrood Z, Jamshidi M, Mansuri Torshizi A, Sotoudeh S (2017) Efficacy of vitamins E and C for reversing the cytotoxic effects of nicotine and cotinine.
Eur J Oral 125, 426-437.
30. Devaraj S, Jialal I (2000) Low-density lipoprotein postse- cretory modification, monocyte function, and circulating adhesion molecules in type 2 diabetic patients with and without macrovascular complications: the effect of alpha- tocopherol supplementation. Circulation 102, 191-196.
31. Klevernic IV, Stafford MJ, Morrice N, Peggie M, Morton S, Cohen P (2006) Characterization of the reversible phosphory-
lation and activation of ERK8. Biochem J 394, 365-373.
32. Horwitt MK, Century B, Zeman AA (1963) Erythrocyte survival time and reticulocyte levels after tocopherol deple- tion in man. Am J Clin Nutr 12, 99-106.
33. Fujita K, Iwasaki M, Ochi H, Fukuda T, Ma C, Miyamoto T et al. (2012) Vitamin E decreases bone mass by stimulating osteoclast fusion. Nat Med 18, 589-594.
34. Boscoboinik D, Szewczyk A, Azzi A (1991) Alpha-tocopherol (vitamin E) regulates vascular smooth muscle cell prolif- eration and protein kinase C activity. Arch Biochem Biophys 286, 264-269.
35. Boscoboinik D, Szewczyk A, Hensey C, Azzi A (1991) Inhibition of cell proliferation by alpha-tocopherol. Role of protein kinase C. J Biol Chem 266, 6188-6194.
36. Hosomi A, Arita M, Sato Y, Kiyose C, Ueda T, Igarashi O et al. (1997) Affinity for alpha-tocopherol transfer protein as a determinant of the biological activities of vitamin E analogs.
FEBS Lett 409, 105-108.
37. Jiang Q, Yin X, Lill MA, Danielson ML, Freiser H, Huang J (2008) Long-chain carboxychromanols, metabolites of vitamin E, are potent inhibitors of cyclooxygenases. Proc Natl Acad Sci U S A 105, 20464-20469.
38. Smith BJ, Lucas EA, Turner RT, Evans GL, Lerner MR, Brackett DJ et al. (2005) Vitamin E provides protection for bone in mature hindlimb unloaded male rats. Calcif Tissue Int 76, 272-279.
39. Xu H, Watkins BA, Seifert MF (1995) Vitamin E stimulates trabecular bone formation and alters epiphyseal cartilage morphometry. Calcif Tissue Int 57, 293-300.
40. Arjmandi BH, Juma S, Beharka AA, Bapna MS, Akhter M, Meydani SN (2002) Vitamin E improves bone quality in the aged but not in young adult male mice. J Nutr Biochem 13, 543-549.
41. Cervellati C, Bonaccorsi G, Cremonini E, Romani A, Fila E, Castaldini MC et al. (2014) Oxidative stress and bone resorption interplay as a possible trigger for postmenopausal osteoporosis. Biomed Res Int 2014, 569563.
42. Ibáñez L, Ferrándiz ML, Brines R, Guede D, Cuadrado A, Alcaraz MJ (2014) Effects of Nrf2 deficiency on bone micro- architecture in an experimental model of osteoporosis. Oxid Med Cell Longev 2014, 726590.
43. Yang Y, Su Y, Wang D, Chen Y, Wu T, Li G et al. (2013) Tanshinol attenuates the deleterious effects of oxidative stress on osteoblastic differentiation via Wnt/FoxO3a signaling.
Oxid Med Cell Longev 2013, 351895.
44. McLean RR (2009) Proinflammatory cytokines and osteopo- rosis. Curr Osteoporos Rep 7, 134-139.
45. Brincat SD, Borg M, Camilleri G, Calleja-Agius J (2014) The role of cytokines in postmenopausal osteoporosis. Minerva Ginecol 66, 391-407.
46. Brigelius-Flohé R, Kelly FJ, Salonen JT, Neuzil J, Zingg JM, Azzi A (2002) The European perspective on vitamin E:
current knowledge and future research. Am J Clin Nutr 76, 703-716.
47. Devaraj S, Li D, Jialal I (1996) The effects of alpha tocoph-
erol supplementation on monocyte function. Decreased lipid oxidation, interleukin 1 beta secretion, and monocyte adhe- sion to endothelium. J Clin Invest 98, 756-763.
48. Wu D, Koga T, Martin KR, Meydani M (1999) Effect of vitamin E on human aortic endothelial cell production of chemokines and adhesion to monocytes. Atherosclerosis 147, 297-307.
49. Cachia O, Benna JE, Pedruzzi E, Descomps B, Gougerot- Pocidalo MA, Leger CL (1998) Alpha-tocopherol inhibits the respiratory burst in human monocytes. Attenuation of p47(phox) membrane translocation and phosphorylation. J Biol Chem 273, 32801-32805.
50. Mauer J, Chaurasia B, Goldau J, Vogt MC, Ruud J, Nguyen KD et al. (2014) Signaling by IL-6 promotes alternative activation of macrophages to limit endotoxemia and obesity- associated resistance to insulin. Nat Immunol 15, 423-430.
51. Wei S, Kitaura H, Zhou P, Ross FP, Teitelbaum SL (2005) IL-1 mediates TNF-induced osteoclastogenesis. J Clin Invest 115, 282-290.
52. Azuma Y, Kaji K, Katogi R, Takeshita S, Kudo A (2000) Tumor necrosis factor-alpha induces differentiation of and bone resorption by osteoclasts. J Biol Chem 275, 4858-4864.
53. Kobayashi K, Takahashi N, Jimi E, Udagawa N, Takami M, Kotake S et al. (2000) Tumor necrosis factor alpha stimulates osteoclast differentiation by a mechanism independent of the ODF/RANKL-RANK interaction. J Exp Med 191, 275-286.
54. Kim N, Kadono Y, Takami M, Lee J, Lee SH, Okada F et al. (2005) Osteoclast differentiation independent of the TRANCE-RANK-TRAF6 axis. J Exp Med 202, 589-595.
55. Yano T, Yajima S, Hagiwara K, Kumadaki I, Yano Y, Otani S et al. (2000) Vitamin E inhibits cell proliferation and the activation of extracellular signal-regulated kinase during the promotion phase of lung tumorigenesis irrespective of antioxidative effect. Carcinogenesis 21, 2129-2133.
56. Tan X, Cao Z, Li M, Xu E, Wang J, Xiao Y (2016) TNF-α downregulates CIDEC via MEK/ERK pathway in human adipocytes. Obesity 24, 1070-1080.
57. Lii CK, Ko YJ, Chiang MT, Sung WC, Chen HW (1998) Effect of dietary vitamin E on antioxidant status and antioxi- dant enzyme activities in Sprague-Dawley rats. Nutr Cancer 32, 95-100.
58. Ahmad M, Khan MA, Khan AS (2003) Naturally occurring antioxidant vitamin levels in patients with type II diabetes mellitus. J Ayub Med Coll Abbottabad 15, 54-57.
59. Merzouk S, Hichami A, Madani S, Merzouk H, Berrouiguet AY, Prost J et al. (2003) Antioxidant status and levels of different vitamins determined by high performance liquid chromatography in diabetic subjects with multiple complica- tions. Gen Physiol Biophys 22, 15-27.
60. Giugliano D, Ceriello A, Paolisso G (1996) Oxidative stress and diabetic vascular complications. Diabetes Care 19, 257-267.
61. Sutton JR, Toews CJ, Ward GR, Fox IH (1980) Purine metabolism during strenuous muscular exercise in man.
Metabolism 29, 254-260.