PAPER
A Unified Statistical Rating Method for Team Ball Games and Its Application to Predictions in the Olympic Games
Eiji KONAKA†a),Member
SUMMARY This study tries to construct an accurate ranking method for five team ball games at the Olympic Games. First, the study uses a statistical rating method for team ball games. A single parameter, called a rating, shows the strength and skill of each team. We assume that the difference between the rating values explains the scoring ratio in a match based on a logistic regression model. The rating values are estimated from the scores of major international competitions that are held before the Rio Olympic Games. The predictions at the Rio Olympic Games demonstrate that the proposed method can more accurately predict the match results than the official world rankings or world ranking points. The proposed method enabled 262 correct predictions out of 370 matches, whereas using the official world rankings resulted in only 238 correct predictions. This result shows a significant difference between the two criteria.
key words: sports, ball games, prediction model, rating rand ranking method
1. Introduction
This study tries to construct an accurate ranking method for five team ball games (basketball, handball, hockey, volley- ball, and water polo) at the Olympic Games.
Accurate ranking systems are important for players, event organizers, and sports enthusiasts. Players use rank- ings to evaluate and estimate their skill levels. Event orga- nizers use rankings as a criterion in tournament design tasks such as group draws, player (team) seeding, guest player (team) selection, and so on. Sports enthusiasts use rank- ings to evaluate the skill of a team and to predict the results of matches. Inaccurate ranking systems confuse and disap- point event organizers, players, and enthusiasts by increas- ing the gap between predictions and match results. There- fore, accurate rankings aid in creating attractive and consis- tent sporting events.
The number of wins and the percentage of victories are the most “fair” ranking criteria if all players are matched in a round-robin format. However, a fair round robin is not possible when the number of teams participating is larger than the number of schedulable matches. In particular, the national teams of major sports cannot all compete in a fair round-robin format. As a result, teams have different oppo- nents and play different numbers of matches.
To rank and order teams according to their abilities, the international association of each sport designs its own orig-
Manuscript received September 18, 2018.
Manuscript revised December 17, 2018.
Manuscript publicized March 11, 2019.
†The author is with the Dept. of Information Engineering, Meijo University, Nagoya-shi, 468–8502 Japan.
a) E-mail: [email protected] DOI: 10.1587/transinf.2018EDP7315
inal ranking system. The most popular ranking system is based on an accumulative method[1]. This system calcu- latesranking pointsfor each team. Ranking points are cal- culated as the sum of the points attributed to international tournaments and the standings in the tournaments. The sum is calculated for a designated period, such as four years.
The five ball games examined here determine their world rankings using this method[2]–[5]. The F´ed´eration Interna- tionale de Natation (FINA) does not disclose world rankings and ranking points for water polo on their website. Thus, the rankings and ranking points for water polo used here are collected from personal websites and sports news.
These ranking points have no clear mathematical or sta- tistical basis, therefore, the ranking points do not directly measure of the scoring ability of the teams. For instance, Konaka[6]reports that the F´ed´eration Internationale de Vol- leyball (FIVB) ranking points have many problems as quan- titative measure of teams’ skill owing to their inconsistent design.
A points-exchange is another possible ranking system.
Here, each team has a ranking point, which they exchange based on match results. For example, several points may be moved from the losing team to the winning team after a match. The most popular points-exchange system is the Elo rating[7]used in chess ranking. Rugby also uses a mod- ified Elo-based ranking system[8]. In these systems, the calculated ranking points converge to the real values if the abilities of all teams are constant and a sufficiently large number of matches are played within a certain period. In general, ranking points in a points-exchange system require more calculation than those in accumulative points systems.
1.1 Ranking and Rating
Here, we definerankingandratingas follows:
• ranking: the order of teams.
• rating: a quantitative value associated with the ability of each team.
The objective of this study is to create a ranking based on ratings.
Assume that the following two elements affect the re- sult of a match:
1. the stable and constant skill and ability of each team.
2. condition, form, luck, and other unstable and non- constant elements.
Copyright c2019 The Institute of Electronics, Information and Communication Engineers
The ranking points in the accumulative method include both sets of elements. On the other hand, a point-exchange sys- tem estimates the first set of elements by denoising the ef- fects of the second set. In this study, the rating is a quantita- tive value calculated using a statistical method based on the first set of elements.
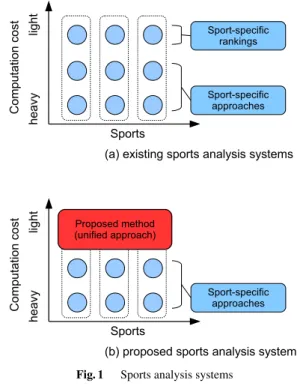
1.2 Sports Analysis as an Information System
Sports-analysis systems are increasingly being viewed as in- formation systems, including sensing and statistical analy- ses. Two different approaches, specific and unified, are nec- essary to construct a sports-analysis system.
Many statistical skill-assessment studies have been conducted for various sports. For instance, volleyball stud- ies have examined how elementary techniques (service, re- ception, spike, dig, block, and set) and strategies contribute to scores and wins[9]–[14].
The Association for Professional Basketball (APBR)[15], established in 1997, analyzes basketball using objective evidence.
Detailed and sport-specific skill assessments and anal- yses are assumed to improve the skills of players or the tac- tics of a team. These analyses require complex information- processing systems, including video, wearable medical sensors, and so on. The construction and information- processing costs of such systems cannot be ignored.
The rating system proposed here uses only the scores of matches and has a light computation cost. This ap- proach tries to construct a unified evaluation method for different sports. By comparing the actual and predicted re- sults, players/teams can seek to improve their performance.
In addition, as described in the previous section, the pro- posed method can replace conventional sports-specific rank- ing systems. Figure 1 summarizes this section.
1.3 Objective
As mentioned above, few studies have examined quantita- tive ability-evaluation methods for national ball game teams.
In particular, there is no unified prediction model reported for different ball games.
The main objective and contribution of this study is to use a simple and unified rating framework for different ball games, and to evaluate its prediction performance. The unified method should use only commonly recorded values among the different sports. All five ball games considered here have a common value: a score. A single parame- ter, called a rating, shows the strength and ability of each team. We assume that the difference between the rating val- ues explains the scoring ratio in a game, based on a logis- tic regression model. The rating values are estimated from major international competition results, including those of world championships, worldwide league competitions, and the Olympic continental and world qualifying tournaments held before the Rio Olympic Games.
The results of these ball games in the Rio Olympic
Fig. 1 Sports analysis systems
Games are estimated based on the calculated rating values.
The prediction results demonstrate that using the proposed method can more accurately predict a result than when using official world rankings or world ranking points. The predic- tion method correctly predicted 262 out of 370 matches in 10 events, whereas the official world rankings made only 238 correct predictions. This result shows a significant dif- ference between the two criteria. The method also cor- rectly predicted 10 out of 30 medals, together with their medal colors (33.3%). Moreover, we made 19 correct pre- dictions of podium finishes (63.3%). These prediction re- sults are better than those provided by Sports Illustrated (26.7%, 53.3%), USA Today (23.3%, 46.7%), and Gra- cenote (33.3%, 46.7%). Note that these results do not show any statistically significant difference because the samples are too small.
This method can be utilized to evaluate the inherent prediction difficulties for each event, and to compare the randomness between sports. This problem is discussed in Lundh[16]. In this study, a “tournament stability index” is calculated from the match results of the evaluation target tournament (e.g., Olympic Games) to quantify the random- ness and uncertainty for different tournaments and sports. In contrast to conventional works, this study proposes an index that evaluates the skill distribution of the participating teams before the evaluation target tournament.
2. Definition and Calculation of Rating
2.1 Current Ranking Systems
The FIVB, the world governing body for volleyball, regu- larly reports the rankings of its member nations’ teams. The
FIVB Board of Administration has designed a system of point attribution for selected FIVB world and other official competitions[5].
The design shows significant inconsistencies. For in- stance, there are no clear mathematical and statistical basis on the following point attribution designs.
• The champions of several competitions each awarded equally 100 points.
• The differences in points between standings.
• The continental championships all awarded the same ranking points.
Basketball[2], handball[3], and hockey[4]have simi- lar accumulative ranking systems, essentially based on the standings in international competitions, but do not explain the mathematical fundamentals of the systems. In fact, as of 2016, FINA no longer even discloses the world rankings for water polo.
2.2 Proposed Method
As mentioned above, official ranking points do not directly measure scoring ability of each team.
We propose a unified and simple statistical estimation method of scoring ratios based on the score in each match, which is always officially recorded and is common to all ball games.
Assume that the scoring ratio of team i in a match against team j (iand jare team indices), denoted as pi,j, is estimated as
pi,j= 1
1+e−(ri−rj), (1)
whereriis defined as theratingof teami. Given (si,sj), the actual scores in a match betweeniandj,
si,j= si
si+sj =pi,j+i,j, (2) wheresi,jandi,jare the actual scoring ratio and the estima- tion error, respectively.
This mathematical structure is the well-known logis- tic regression model. It is widely used in areas such as the winning probability assumption of Elo ratings in chess games[7], and the correct answer probability for questions in item response theory[17],[18].
The update method is designed to minimize the sum of the squared error between the result and the predictionE2, defined by the following equation:
E2=
(i,j)∈all matches
(si,j−pi,j)2. (3) It is straightforward to obtain the following update based on the steepest-descent method:
ri←ri−α·∂E2
∂ri , (4)
whereαis a constant.
Of these five sports, hockey matches have the lowest scores. Shut-out results such as 1−0 or 3−0 occur fre- quently. Thus, a simple scoring ratio can result in invalid skill evaluation. Therefore, for hockey, the scoring ratio is modified to
si,j= si+1
(si+1)+(sj+1) = si+1
si+sj+2. (5) This modification is known as Colley’s method[19], and was originally used to rank college football teams.
By definition, the rating is an interval scale. Therefore, its origin, r =0, can be selected arbitrarily and a constant value can be added to allri. For example,
r←r−(maxr)·1 (6)
implies thatr=0 always shows the highest rating, andr<0 shows the distance from the top team.
2.2.1 Convert Rating on Scoring Ratio to Winning Proba- bility
The ratingri in (1) explains the scoring ratio. This differs between sports in terms of showing how the scoring ratio affects the winning probability.
Once we have the scoring ratiopi,jgiven in (1), assume that the following independent Bernoulli process is executed Ntimes, starting from (si,sj)=(0,0) and with the parame- ter 0< β≤1.
⎧⎪⎪⎪⎪⎨
⎪⎪⎪⎪⎩
si←si+1 with probability βpi,j, sj←sj+1 with probability β
1−pi,j
, si←si,sj←sj with probability (1−β).
(7) This is a unified (and approximated) model of a scoring pro- cess for five different ball games, where si and sj model the scores of teams i and j, respectively. By definition, E(si+sj)=Nβ,E(si)=Nβpi,j, andE
si/(si+sj)
=pi,j. The parametersNandβvary among the sports and be- tween definitions of a unit of play. For example, in volley- ball, the only one net sport of the five sports, a unit of play is defined from service to scoring. Under this definition,β=1 and N 45 in one set of a volleyball match. The other four sports are goal sports with different durations. In these sports, a unit of play is a short period of time. For exam- ple, in basketball, if a unit of play is defined as 10[s], we have N = 40[min]×60[s]/10 = 240. βis determined as β=E(si+sj)/N.
At the end of the match,si>sjshows that teamiwins against team j. Figure 2 shows the simulated winning prob- ability for differentNβand rating gap (ri−rj), withN=240.
This probability is expressed by the cumulative distribution function for a normal distribution. In many applications, it is common to use a logistic regression model rather than a cumulative distribution[20].
Based on the discussions above, we convert the rating on the scoring ratio to that of a winning probability, as fol- lows:
wi,j=1 (iwins), or 0 (jwins), (8) which denotes a win or loss for teamiagainst team j. Find D∗k,wherekis an index of sports, that satisfies
wˆi,j= 1
1+exp
−Dk
ri−rj
, (9)
D∗k=arg min
Dk wi,j−wˆi,j
2
. (10)
Then,riis converted as follows:
¯
ri=D∗kri, i=1,2,· · ·,NT. (11) Therefore, ¯riis a rating that explains the winning probabil- ity, and it can be utilized in match result predictions.
In Eqs. (3) and (10), the sum of squared errors are used as a loss function instead of the cross-entropy. This is be- cause these problems are regression problems, not classifi- cation ones.
2.3 Event Competitiveness Measured by Entropy Func- tions
Once the estimated winning probability ˆwis calculated, the following binary entropy functionIT Ccan be used to evalu- ate the distribution of the competitive strength of the teams participating in an event:
IT C
=−1 N
wˆi,jlog2wˆi,j+ 1−wˆi,j
log2 1−wˆi,j
, (12) where (i,j) is taken from a set of match-ups of the event andNis the number of matches in the event. By definition, IT C∈[0,1]. Here,IT C=1 implies that all teams have equal strength, that is ˆwi,j=0.5 for all matches. On the other hand,
Fig. 2 Rating gap and winning probability
a smallIT Cimplies that the skill gaps between the teams are large and many one-sided games are included in the event.
3. Rating Calculation for Five Ball Games and Its Ap- plication to Match Result Predictions in the Rio Olympic Games
3.1 Data Set
We calculate the rating values for the national teams of the following five ball games: basketball, handball, hockey, vol- leyball, and water polo. The match results used in the rating calculation include the following:
• Rio Olympics qualifying tournaments, including conti- nental championships.
• Worldwide tournaments: for example, world champi- onships, and the World League (men’s volleyball), held from 2014 to 2016/8 (just before Rio 2016).
The number of teams participating in at least one tour- nament and the number of matches in the data set are listed in Table 1.
The following official world rankings are also used in the discussion:
• Basketball: FIBA ranking, 2016/7.
• Handball: IHF ranking, 2016/7.
• Hockey: FIH ranking, 2016/6.
• Volleyball: FIVB ranking, 2016/7.
• Water polo: FINA ranking, 2014/8.
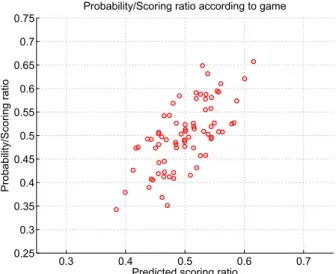
3.2 Results
Figure 3 shows the results of all 38 matches (30 group round-robin matches, four quarterfinals, two semifinals, and two medal matches) of the men’s basketball in Rio 2016.
The horizontal and vertical axes show the predicted scoring ratio from the calculated rating values and the real scoring ratio, respectively.
As a comparison, in Fig. 4, the horizontal axis now shows the difference in the official world rankings.
Figure 5 shows the relation between the FIBA rank- ing points for men (horizontal axis) and the proposed nor- malized rating (vertical axis) just before the Rio Olympic
Table 1 Number of teams and matches Sport Sex Teams Matches
Basketball M 69 334
Handball M 69 375
Hockey M 48 280
Volleyball M 43 466
Water polo M 31 346
Sport Sex Teams Matches
Basketball W 57 238
Handball W 44 311
Hockey W 42 265
Volleyball W 36 337
Water polo W 26 294
Games. Spearman’s rank correlation coefficientρkbetween the official ranking points and the proposed normalized rat- ing is calculated for ten events. The values are listed in Ta-
Fig. 3 Predicted and real scoring ratio in each game (Rio 2016, basket- ball, men)
Fig. 4 Ranking gap and real scoring ratio in each game (Rio 2016, bas- ketball, men)
Table 3 Prediction accuracy in Rio 2016
Correct Corr. Coeff. IT C
Matches Rating Ranking Ideal Rating Ranking Ideal
Basketball M 38 30 29 32 0.679 −0.542 0.878 0.6082
Handball M 38 25 20 30 0.592 −0.492 0.654 0.7927
Hockey M 38 21 21 30 0.725 −0.729 0.863 0.4847
Volleyball M 38 30 27 32 0.731 −0.790 0.853 0.6124
Water polo M 42 27 20 32 0.560 −0.438 0.644 0.6797
Basketball W 38 33 28 36 0.818 −0.698 0.902 0.4950
Handball W 38 22 30 33 0.579 −0.572 0.785 0.6785
Hockey W 38 21 18 31 0.764 −0.608 0.847 0.6380
Volleyball W 38 34 31 36 0.731 −0.663 0.900 0.5571
Water polo W 24 19 14 22 0.905 −0.697 0.926 0.5716
All M 194 133 117 156
All W 176 129 121 158
All 370 262 238 314
bold: better performance
ble 2.
Table 3 compares the prediction accuracies of the pro- posed method and the official world rankings. The predic- tion law is simple: “a team with a higher rating (ranking) scores more.” Draws are judged as incorrect in both meth- ods. The column “Corr. Coeff.” lists the following values:
• Rating: the correlation coefficient between the scoring ratio and the predicted scoring ratio from the rating gap
• Ranking: the correlation coefficient between the scor- ing ratio and the ranking gap
• Ideal: the correlation coefficient between the scoring ratio and the predicted scoring ratio from the ideal rat- ing gap. “Ideal rating”, denoted as rideal, refers to rating values calculated from the actual results of the Rio Olympic Games. The ideal (i.e., maximum) num-
Fig. 5 FIBA ranking points (men, 2016/7) and proposed rating
Table 2 Spearman’s rank correlation coefficient between the official ranking points and the proposed normalized rating
Sex ρk
Basketball M 0.7557 Handball M 0.5412
Hockey M 0.9710
Volleyball M 0.7165 Water polo M 0.8215
Sex ρk
Basketball W 0.7225 Handball W 0.6094
Hockey W 0.9646
Volleyball W 0.8873 Water polo W 0.7991
ber of correct predictions is also listed in the column
“Correct”-“Ideal.”
This table also listsIT Cdefined in Sect. 2.3.
Table 4 lists the normalization parametersD∗k.
Table 5 lists the detailed predictions for the men’s bas- ketball. The rating values are normalized usingD∗k, and are shifted so that the lowest rating is zero. All 38 matches are simulated 106times. The table lists the average values. The underlined and bold numbers denote the prediction and the result, respectively.
The teams winning medals are predicted for 10 events in five sports. The prediction is evaluated from two view- points, “Medal with color” and “Podium finishes.” For ex- ample, the prediction in Table 5 tells us that the gold, silver, and bronze medals would have been awarded to USA, ESP, and SRB, respectively. The actual result is USA, SRB, and ESP. In this case, the proposed method predicts one medal with color and three podium finishes.
The proposed prediction result is compared to the pre- dictions seen in
• Official rankings,
• Sports Illustrated (SI)[21],
• USA Today[22], and
• Gracenote[23].
Table 6 shows the results. Bold numbers show the most accurate prediction.
Figures 6 and 7 show the rating distributions in 10 events in five sports. All teams participating in at least one match in the data set are included in these figures. The rating values are normalized byD∗k. Figure 8 shows the normal- ized rating of the qualified teams for Rio 2016. In these fig- ures, the rating values are shifted so that the top-rated team
Table 4 Normalization parametersD∗k Sex D∗k
Basketball M 11.660 Handball M 12.299
Hockey M 4.509
Volleyball M 15.019 Water polo M 5.288
Sex D∗k Basketball W 9.193 Handball W 9.090
Hockey W 3.463
Volleyball W 9.868 Water polo W 4.055
Table 5 Medal prediction (basketball, men)
Team Rating Group Gold Silver Bronze 4th
(normalized)
FRA 3.3714 A 0.0236 0.1281 0.1692 0.1849
USA 5.9376 A 0.7933 0.1077 0.0695 0.0060
VEN 0.7395 A 0.0000 0.0001 0.0003 0.0019
SRB 3.6863 A 0.0453 0.2225 0.2658 0.1836
CHN 0.0000 A 0.0000 0.0000 0.0000 0.0004
AUS 3.3972 A 0.0248 0.1272 0.2097 0.2392
ARG 2.1873 B 0.0008 0.0112 0.0143 0.0522
ESP 4.3037 B 0.1081 0.3611 0.1796 0.0656
BRA 2.2445 B 0.0007 0.0122 0.0266 0.0851
LTU 2.3811 B 0.0024 0.0173 0.0419 0.1135
CRO 2.1984 B 0.0010 0.0125 0.0229 0.0659
NGR 0.9001 B 0.0000 0.0001 0.0002 0.0017
underline: prediction,bold: result
is zero.
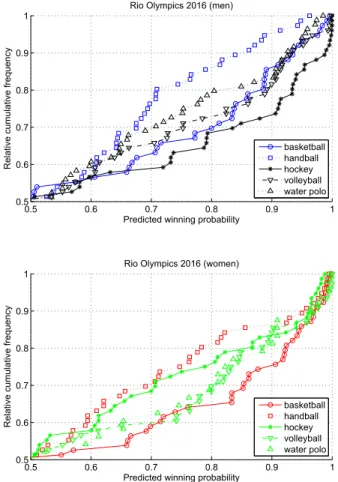
Figure 9 shows another view of the ability distribution in Rio 2016. This figure shows the distribution of the pre-
Table 6 Medal predictions
All Medal Podium
medals with color finishes
Proposed 30 10 19
Official Rankings 30 6 14
SI 30 8 16
USA Today 30 7 14
Gracenote 30 10 14
bold: best prediction
Fig. 6 Normalized rating of five sports (men)
Fig. 7 Normalized rating of five sports (women)
dicted winning probability of the highly rated teams for ev- ery match in 10 events.
3.3 Discussion
Figure 5 and Table 2 show that the FIBA ranking cannot ac- curately measure the scoring skill for each team. For exam- ple, some European teams (indicated by diamond markers) with similar ratings (approximately 3.0) have very different ranking points (ranging from almost zero to 500). On the other hand, teams with very few ranking points around zero are evaluated as totally different scoring skill (from −11.0 to 2.0). Spearman’s rank correlation implies that what the ranking measures depends on their design. For instance, it seems that the IHF ranking for handball measures something other than scoring skills.
Table 3 shows that the proposed rating method realizes a more accurate prediction (262 correct out of 370 matches, 70.8%) than that using the official (accumulative) world ranking system (238 correct out of 370 matches, 64.3%).
Table 7 classifies the prediction results by the proposed rating and the official ranking. The null hypothesis that “the prediction accuracy of the proposed method is the same as that of the official world ranking system” is rejected by Mc- Nemar’sχ2 test with p = 6.0×10⁻³ < 0.01. The script written by Cardillo[24]is used to obtain thep−value.
Moreover, the correlation between the predicted and
Fig. 8 Clustering result of normalized rating of five sports in Rio 2016 for qualified teams
Table 7 Classification table Ranking Correct Incorrect
Rating Correct 215 47 262
Incorrect 23 85 108
238 132 370
the real scoring ratios is stronger than that between the rank- ing gap and the ratio. This result implies that the proposed rating value is a better quantitative measure of the ability of national teams of these five ball games than the official world ranking.
Table 4 shows thatD∗kis larger in men’s events than in women’s events in the same sport.D∗kis a parameter used to convert the rating on the scoring ratio to a rating on the win- ning probability. A largeD∗implies that many men’s teams are equally matched and that many matches are closely con- tested; that is, the scoring ratio is around 0.5. Table 3 also shows that the official ranking system does not provide accu- rate ability evaluations, especially for men’s competitions.
Table 6 shows that the proposed method provides bet- ter predictions than those provided by the official world rankings, a well-known sports magazine (Sports Illustrated), and a nationwide newspaper (USA Today). These are com- pared with the statistics provided by a company (Gracenote).
However, the advantage of the proposed method for medal
Fig. 9 Distribution of predicted winning probability of highly rated teams
predictions cannot be tested statistically because of the small sample sizes.
Surprisingly, the proposed method achieves better pre- diction results than those of the official ranking system and professional sports journalists, even though the proposed method uses one unified model and does not include fea- tures specific to each sport and event.
Figure 8 shows the normalized rating values of the probability of winning for the qualified teams. The rating values can be compared between different sports because they are normalized. These figures and the prediction re- sults imply the following:
• It is difficult to predict the results of hockey because the matches have low scores (4.973 and 3.395 goals per match in men’s and women’s competitions, respec- tively). In other words, the ability gap between two teams are rarely reflected in the actual score and score the difference.
– The low scores in hockey matches lead to frequent draws. In Rio 2016, six games resulted in a draw in each of the men’s and women’s events.
• In handball, there is no clearly strongest team. Six teams with ¯r > −1 qualified for Rio 2016 in both the men’s and the women’s events. Therefore, it is
difficult to predict the match results (¯r = −1 implies that the team beats the top-rated team with probabil- ity 1/
1+e1
= 0.2689). As a result, the prediction accuracy of the proposed method was not good.
• The other four sports have one to three outstanding teams (i.e., ¯r>−1).
• Except for the abovementioned outstanding teams, the slope of the plot of the men’s rating is more moderate than that of the women’s rating. This implies that there are many equally matched teams in the men’s event.
In the women’s event, match results tend to follow the match previews because there are clear differences in the abilities of the teams. Therefore, the prediction ac- curacy for the women’s event (73.3%, 129 correct out of 176 matches) is higher than that for the men’s event (68.6%, 133 correct out of 194 matches).
Figure 9 can also be used to evaluate the competitive- ness of each event. In this figure, an event is competitive if the corresponding plot lies in the upper-left section of the graph (e.g., men’s handball; IC = 0.7927 is the largest value among the men’s events). On the other hand, if the plot lies in the bottom-right section, then the correspond- ing event had many one-sided games (e.g., women’s basket- ball;IC =0.4975 is the smallest value among the women’s events).
4. Conclusion
This paper has presented the prediction results of five ball games, namely, basketball, handball, hockey, volleyball, and water polo, in the Rio Olympic Games based on a unified statistical rating method. Both a unified rating method and its calculation method are proposed. The rating values for all teams participating in Olympic qualification tournaments within one or two years are calculated.
Surprisingly, the proposed method achieves better pre- diction results than the official ranking system and profes- sional sports journalists, even though the proposed method uses a unified model and does not include features specific to each sport and event.
Future work will extend the proposed framework to other sports in upcoming Olympic Games, especially Tokyo 2020. The proposed method can be applied to sports involv- ing individuals, not only team events. For example, bad- minton, fencing, judo, table tennis, and wrestling could be covered by the proposed method because worldwide com- petitions with top players are held regularly in these sports.
On the other hand, soccer and baseball are difficult to predict using the proposed method. In the Olympic Games, soccer has a different age restriction (players should be younger than 23) to that of standard international A-matches. In the case of international baseball, there are too few competi- tions. Thus, the skill of the national teams cannot be evalu- ated.
References
[1] S. Ray, “The methodology of officially recognized international sports rating systems,” Journal of Quantitative Analysis in Sports, vol.7, no.4, 2011.
[2] FIBA, “FIBA world ranking,” http://www.fiba.com/rankingmen, 2016, accessed 2016/12/22.
[3] IHF, “Ranking table,” http://www.ihf.info/en-us/thegame/ rankingtable.aspx, 2016, accessed 2016/12/22.
[4] FIH, “FIH men’s and women’s Hero world ranking,”
http://www.fih.ch/rankings/outdoor/, 2017, accessed 2017/4/7.
[5] FIVB, “FIVB volleyball world rankings,” http://www.fivb.org/en/ volleyball/Rankings.asp, 2016, accessed 2016/6/14.
[6] E. Konaka, “Statistical rating method for volleyball national teams and its application to result prediction and competition format de- sign,” Proceedings of the Institute of Statistical Mathematics, vol.65, no.2, pp.251–269, 2017 (in Japanese).
[7] A.E. Elo, Ratings of Chess Players Past and Present, hardcover ed., Harper Collins Distribution Services, 1979.
[8] World Rugby, “Rankings explanation,” http://www.worldrugby.org/ rankings/explanation, 2014, accessed 2016/6/14.
[9] H.J. Eom and R.W. Schutz, “Statistical analyses of volleyball team performance,” Research Quarterly for Exercise and Sport, vol.63, no.1, pp.11–18, 1992. PMID: 1574656.
[10] E. Zetou, A. Moustakidis, N. Tsigilis, and A. Komninakidou, “Does effectiveness of skill in complex i predict win in men’s olympic vol- leyball games?,” Journal of Quantitative Analysis in Sports, vol.3, no.4, 2007.
[11] L.W. Florence, G.W. Fellingham, P.R. Vehrs, and N.P. Mortensen,
“Skill evaluation in women’s volleyball,” Journal of Quantitative Analysis in Sports, vol.4, no.2, 2008.
[12] R.M. Ara´ujo, J. Castro, R. Marcelino, and I.R. Mesquita, “Rela- tionship between the opponent block and the hitter in elite male volleyball,” Journal of Quantitative Analysis in Sports, vol.6, no.4, pp.1–12, 2010.
[13] M. Ferrante and G. Fonseca., “On the winning probabilities and mean durations of volleyball,” Journal of Quantitative Analysis in Sports, vol.10, no.2, pp.91–98, 2014.
[14] T. Burton and S. Powers, “A linear model for estimating optimal service error fraction in volleyball,” Journal of Quantitative Analysis in Sports, vol.11, no.2, pp.117–129, 2015.
[15] The Association for Professional Basketball, APBR.org, http://www.apbr.org/, accessed 2018/8/3.
[16] T. Lundh, “Which ball is the roundest? - a suggested tournament stability index,” Journal of Quantitative Analysis in Sports, vol.2, no.3, 2006.
[17] R. Hambleton, H. Swaminathan, and H. Rogers, Fundamentals of Item Response Theory (Measurement Methods for the Social Sci- ence), new edition, Sage Publications, 1991.
[18] R.J. de Ayala, The Theory and Practice of Item Response Theory (Methodology in the Social Sciences), 1st ed., Guilford Press, 2008.
[19] W.N. Colley, “Colley’s bias free college football ranking method:
The Colley matrix explained,” http://www.colleyrankings.com/, 2002, accessed 2018/8/3.
[20] J. Lasek, Z. Szl´avik, and S. Bhulai, “The predictive power of ranking systems in association football,” Int. J. of Applied Pattern Recogni- tion, vol.1, no.1, pp.27–46, 2013.
[21] B. Cazeneuve, “Olympic medal predictions: Picking gold, silver, bronze in all 306 events,” http://www.si.com/olympics/2016/08/01/ rio-2016-olympics-medal-picks-predictions-projected-medal-count, 2016, accessed 2016/8/1.
[22] USA Today, “2016 Rio Olympics medal projections,”
http://www.usatoday.com/story/sports/olympics/2016/07/30/ 2016-rio-olympics-medal-projections/87779154/, 2016, accessed 2016/8/1.
[23] Gracenote, “Gracenote’s data analytics predicts winners and losers
of 2016 rio olympics,” http://www.gracenote.com/gracenotes-data- analytics-predicts-winners-losers-2016-rio-olympics/, 2016, ac- cessed 2016/8/1.
[24] G. Cardillo, “McNemar test: perform the mcnemar test on a 2x2 matrix,” http://www.mathworks.com/matlabcentral/fileexchange/ 15472, 2007.
Eiji Konaka received his B.E., M.E., and Ph.D. degrees in Electrical Engineering from Nagoya University, Japan, in 2000, 2002, and 2005, respectively. Currently, he is an Associate Professor at the Department of Information En- gineering, Meijo University. His research inter- ests are in the areas of intelligent control sys- tems and statistic prediction models of sports.
He is a member of IEEJ, IEICE, SICE, and IEEE.