Journal of Rural Medicine
Original article
Relationships between daily life behaviors and physical activity measured using a triaxial accelerometer in
elderly community-dwelling Japanese individuals
Masahiro Ishikubo1, 2, and Tohru Yoshida2, 3
1 Faculty of Nursing, Jobu University, Japan
2 Former affiliation: Graduate School of Health Sciences, Gunma University, Japan
3 Faculty of Human Life, Jumonji University, Japan
Abstract
Objective: This study aimed to measure the physical activity (exercise and non-exercise) of community-dwelling elderly Japanese individuals and to investigate the relationships between physical activity and daily life behaviors.
Methods: Community-dwelling elderly Japanese individuals who resided in town A, city B, Gunma Prefecture, Japan, and were not certified as requiring long-term care were included in this study. Physical activity in 1 week was measured using a triaxial ac- celerometer. A self-administered questionnaire was applied to assess daily life behaviors. Hierarchical multiple regression analysis was used to examine the factors affecting physical activity.
Results: A total of 107 elderly Japanese (46 men and 61 women) individuals were included. The mean amount of physical activity in men was 37.9 Metabolic equivalents (METs)*h/wk, whereas that in women was 33.8 METs*h/wk. The proportion of exercise to physical activity for men and women was 43.2% and 26.0%, respectively. Men and women took an average of 47,393.7 and 35,305.6 steps/wk, respectively. Step counts and the presence or absence of plant cultivation were the factors associated with the amount of physical activity. The exercise component of physical activity was associated with step count, whereas the non-exercise component was associated with step count, plant cultivation, and frequent outings.
Conclusion: Among community-dwelling elderly Japanese individuals, physical activity levels appear to be affected by step count and the presence or absence of certain factors, such as plant cultivation and frequent outings.
Key words: community-dwelling elderly, physical activity, triaxial accelerometer, daily life behaviors
(J Rural Med 2020; 15(1): 8–15)
Introduction
The percentage of the aging population (≥65 years) in Japan is 27.3%, and it is expected to reach its peak of 38.8%
by 20601). Therefore, Japan faces numerous problems related to medical and long-term care for the elderly.
In the field of geriatrics, there is rising concern about the concept of frailty, including physical, mental, psychologi-
cal, and social factors2). The Japan Gerontological Society considers sarcopenia one of the chief causes of frailty. Sar- copenia is characterized by the systemic decline of skeletal muscle mass and strength3, 4) and is primarily observed in the elderly; thus, several studies have focused on this topic and its relation to frailty within the scope of long-term care prevention.
The Ministry of Health, Labour and Welfare established the “Physical Activity Reference for Health Promotion 2013”
in March 20135) and reported that sarcopenia increases the risk of becoming bedridden. These criteria, which recom- mend that individuals should engage in adequate physical activity even in old age, were the first to focus on the asso- ciation between physical activity and sarcopenia prevention.
Oshima et al.6) measured the steps and total moderate- to-vigorous physical activity (MVPA) levels of the elderly aged 60 years and above without exercise restriction using a triaxial accelerometer, and found that men take 6,821 ±
Received: October 15, 2018 Accepted: September 26, 2019
Correspondence: Masahiro Ishikubo, Faculty of Nursing, Jobu Uni- vesrity, 270-1 Sinmachi, Takasaki City, Gunma 370-1393, Japan E-mail: [email protected]
This is an open-access article distributed under the terms of the Creative Commons Attribution Non-Commercial No Derivatives (by-nc-nd) License <http://creativecommons.org/
licenses/by-nc-nd/4.0/>.
Journal of Rural Medicine
2,869 steps and engage in 21.8 ± 10.9 Metabolic equivalents (METs)*h/wk total MVPA, whereas women take 6,303
± 2,396 steps and engage in 26.1 ± 12.8 METs*h/wk total MVPA. Additionally, Honda et al.7) used a triaxial acceler- ometer to measure the total daily MVPA of the elderly aged
≥ 65 years who did not have long-term care certification, and reported a total MVPA of 2.7 ± 2.1 METs*h /day.
However, in Aoyagi’s8) interdisciplinary study on the physical activity as well as the physical and psychological health of elderly individuals (aged ≥65 years) conducted over 10 years, it was reported that moderate intensity activ- ity of 4,000 steps or five minutes of fast walking can prevent depression and 8,000 steps or 20 minutes of fast walking can prevent hypertension and diabetes.
In contrast, it has been considered that, in addition to physical and mental health, the number of steps and physi- cal activity of the elderly may also be affected by some kind of unintended daily life behavior that can be intervened.
Furthermore, it is thought that increase in physical activity could be possible even with non-exercise at the same inten- sity as walking in daily life behaviors.
Although there are descriptive studies on physical activ- ity in the elderly and reports of physical and mental health being related to physical activity, there are no studies that place intervenable non-exercise on the cause side.
Therefore, this study aimed to measure the amount of physical activity performed by Japanese elderly aged >65 years without long-term care certification. Additionally, the relationships between physical activity and daily life behav- iors in this population were investigated.
This study provides insights into physical activity in this population, thereby leading to recommendations for preven- tive methods for frailty and sarcopenia, which elderly indi- viduals can implement in their daily lives. The study also furthers the discussion on effective approaches to enhance health-promotion activities in this population.
Materials and Methods Participants
Residents were selected from communities that readily cooperated and where the study could be conducted eas- ily. The participants were elderly men and women (aged ≥ 65 years as of September 1, 2016) residing in wards 1–5 of Town A, City B, Gunma Prefecture, Japan, who were not certified as long-term care dependent.
Town A is located in the southwestern region of Gunma prefecture and comprises wards 1–10. Each ward is repre- sented by a neighborhood association level, and the com- munities include a mix of agricultural and residential ar- eas. The town has a population of 12,587 (6,157 men and 6,430 women)9). Wards 1–5 have a population of 3,162 (1,533 men and 1,629 women), of which 1,059 (455 men and 604
women) are aged ≥ 65 years. Wards 1–5 are in the proximity of Town A’s Japan Railway line station. The wards com- prise many old residential homes, and the community has not undergone any major changes. The residents of Town A have participated in at least two physical activity stud- ies conducted by research institutions. Of these, one study focused on elderly individuals; thus, this community gener- ally readily participates in research studies. The leader of each ward was asked to identify all the individuals eligible for participation.
The survey was conducted between September and No- vember 2016, the time of the year with average annual tem- perature and weather (average yearly temperature at a cer- tain place is 15.8°10)), to account for variations in the levels of seasonally dependent physical activities.
Measurement of physical activity
A triaxial accelerometer (Active Style Pro; HJA-750C, OMRON HEALTHCARE Co., Ltd., Kyoto, Japan) was used to measure the amount of physical activity and its compo- nents, exercise and non-exercise, and step counts.
The triaxial accelerometer uses original algorithms to detect acceleration in the three axes and applies different estimated formulas to each to achieve highly accurate activ- ity intensity estimates. Furthermore, this device can classify movements wherein there are no changes in the degree of inclination of the upper body as exercise, and activities that are accompanied by inclination changes of the upper body, such as carrying objects or using a vacuum cleaner, as non- exercise, regardless of the intensity of the activity. These classifications are based on changes in the gravitational ac- celeration signal. It uses relational expressions between re- sultant acceleration and activity intensity during each physi- cal activity to measure the relative amounts of exercise and non-exercise movements11, 12). High resolution is required to detect slight motions, including the activities of daily living.
The triaxial accelerometer has an extremely fine resolution of 3 mG13) and is thus ideal for measuring the amount of non-exercise.
The recommended epoch length of the triaxial accel- erometer for children is <60 s14–17); however, for assessing physical activity in adults, there are no noted benefits of us- ing an epoch length of <60 s18, 19). As the participants of this study were elderly individuals, and considering the memory capacity of the device, an epoch length of 60 s was selected.
The individuals were asked to wear their triaxial accel- erometers from the time they woke up on Monday morning until bedtime on Sunday. They were instructed to remove the accelerometer only while bathing and sleeping so as to detect their amount of physical activity over a duration of one week.
In accordance with previous studies on adults, includ- ing the elderly8, 20–22), we only considered data from triaxial
Journal of Rural Medicine
accelerometers worn for ≥ 10 hours per day. Furthermore, only data from those who met the criteria for ≥ 5 days were included in the analysis. The weekly amounts of physical activity, exercise, non-exercise, and step counts were calcu- lated based on the following equation:
Cumulative values of measurements taken/number of days the triaxial accelerometer was worn × 7.
The values for amounts of physical activity, including exercise and non-exercise, were estimated only for activities that had an intensity of ≥ 3 METs.
Basic characteristics and daily life behaviors Basic characteristics and daily life behaviors were sur- veyed using a questionnaire that included sex, age (six cat- egories), and number of cohabitating family members and their relationship with the participant (spouse, child, grand- child, or parent).
The following parameters of daily life behaviors were assessed on a binomial scale: intentional or planned exer- cise for maintaining or improving physical strength (here- after, intentional or planned exercise), frequent outings, frequency of engagement in household chores (hereafter, frequent household chores), plant cultivation, having a pet that requires walking, community roles, and frequent par- ticipation in community events. The means of transporta- tion for outings (walking, bicycle, car, motorcycle) were also surveyed. Furthermore, in addition to inquiring as to each participant’s mean daily time spent on outings (min), body movement (min), and household chores (min), we surveyed the mean frequency of planned exercise per week and mean duration per planned exercise session to calculate the mean weekly total exercise time (min) as a product of the two.
Statistical analysis
We analyzed the effects of daily life behaviors on the amount of physical activity, exercise, and non-exercise for all participants by sex and early old/late old age categories.
First, we measured the participants’ physical activity. Next, a t-test was performed to determine the difference between the two groups according to sex or according to age catego- ries. Differences between four or more groups with respect to age and sex in the early old age and late old age categories were analyzed using one-way analysis of variance.
Next, the proportion of the amount of physical activity that consisted of exercise was investigated based on sex and age groups. Furthermore, the relations between daily life behaviors and other variables (amounts of physical activity, exercise, and non-exercise and step counts) were examined using the t-test and Pearson’s correlation coefficient. Items that emerged as significant during relational testing were considered independent variables, and a hierarchical multi- ple regression analysis was performed; the analysis included the amount of physical activity, exercise, and non-exercise
as dependent variables. We entered age and sex groups in Step 1, step count in Step 2, and items of daily life behav- iors that were statistically significant in the t-test or correla- tion analysis in Step 3. We also confirmed that there was no multicollinearity among any of the independent variables in the regression analysis (variance inflation factor (VIF) <5).
IBM SPSS Statistics Version 23 was used for all analyses, and p<0.05 was considered statistically significant.
Ethical considerations
This study was approved by the Gunma University Ethi- cal Review Board for Medical Research Involving Human Subjects (receipt no. 160096) and the Ethics Committee of Jobu University (16-N02).
Results
Participant selection
Of the 128 individuals introduced by the ward leader, six refused to participate in the survey. In addition, 15 who did not meet the criteria for wearing the triaxial accelerom- eter were excluded, and the remaining 107 were included in the analysis. The number of men was 46 (43.0%), and the number of individuals classified as early old was 51 (47.7%).
The valid response rate among the population of elderly in- dividuals residing in the study region was 10.1%.
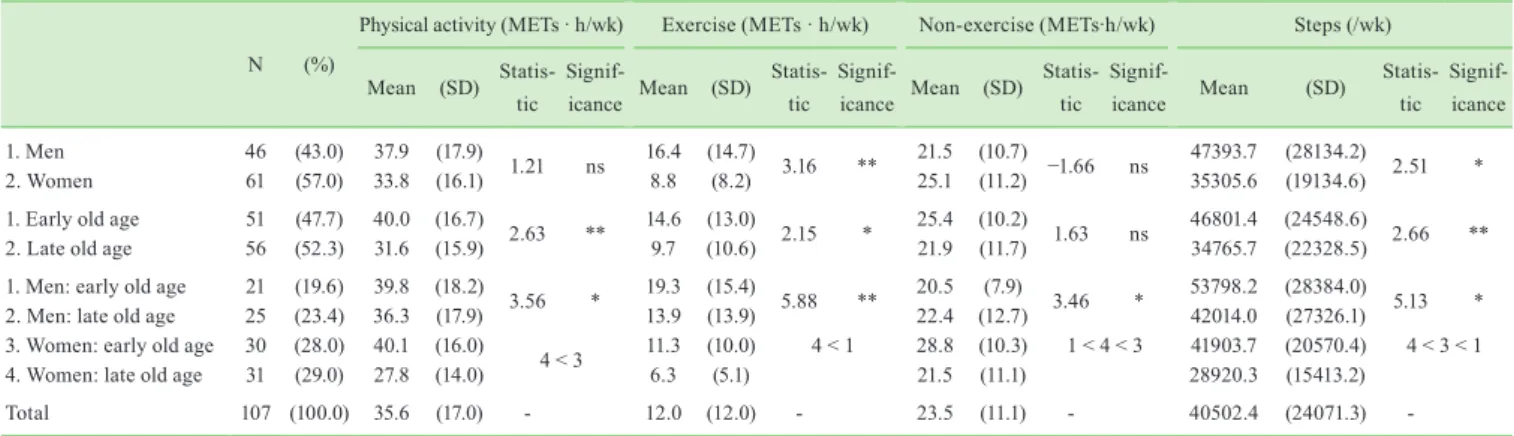
Amount of physical activity (amount of exercise and non-exercise) and step counts (Table 1)
Men engaged in a mean amount of physical activity of 37.9 METs*h/wk, of which exercise accounted for a mean of 16.4 METs*h/wk and non-exercise accounted for a mean of 21.5 METs*h/wk. The mean amount of physical activity for women was 33.8 METs*h/wk, of which exercise accounted for a mean of 8.8 METs*h/wk and non-exercise accounted for a mean of 25.1 METs*h/wk. Men engaged in a signifi- cantly higher amount of exercise than women (p<0.01). Ex- ercise accounted for 43.2% and 26.0% of the overall physi- cal activity in men and women, respectively. This difference was statistically significant, with men proportionally engag- ing in more exercise than women (p<0.01). The mean step count was 47,393.7 steps/wk for men and 35,305.6 steps/w for women; men took significantly more steps per week (p<0.05).
The mean amount of physical activity among the par- ticipants in early old age was 40.0 METs*h/wk, of which exercise accounted for a mean of 14.6 METs*h/wk and non- exercise accounted for a mean of 25.4 METs*h/wk. The mean amount of physical activity in participants in late old age was 31.6 METs*h/wk, of which exercise accounted for a mean of 9.7 METs*h/wk and non-exercise accounted for a mean of 21.9 METs*h/wk; both the amount of physical activity (p<0.01) and the amount of exercise (p<0.05) were
Journal of Rural Medicine
significantly higher among participants in early old age. Ex- ercise accounted for 36.5% and 30.7% of the overall physical activity among individuals in early old age and late old age, respectively, indicating no significant between-group differ- ences with regard to age.
The step count of the participants in early old age was 46,801.4 steps/wk, whereas that of individuals in late old age was 34,765.7 steps/wk; individuals in early old age took significantly more steps than those in late old age (p<0.01).
Next, the individuals were divided into four groups based on sex and age. As a result, significant differences were found among the four groups for all parameters, in- cluding the amount of non-exercise.
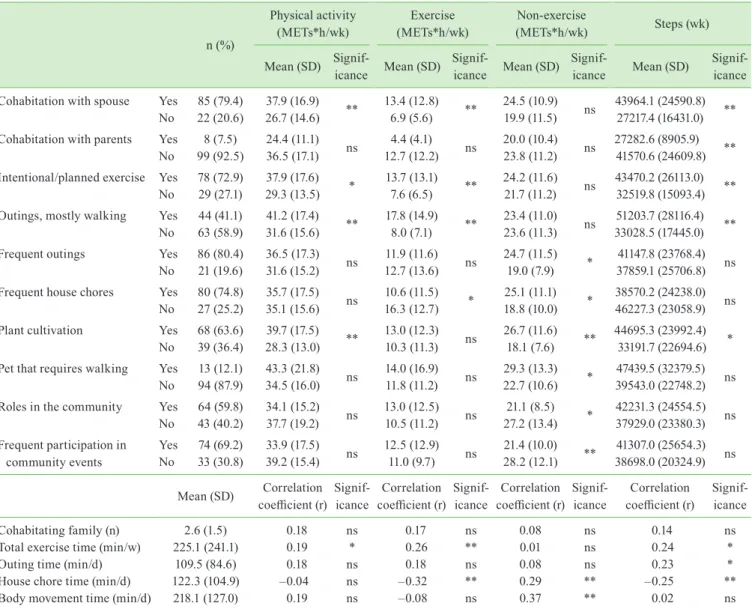
Relationship between physical activity/step counts and daily life behaviors (Table 2)
Individuals who engaged in more physical activity tended to live with a spouse (p<0.01), engage in intentional/
planned exercise (p<0.05), walk for outings (p<0.01), and cultivate plants (p<0.01). There was a significant positive relation between the amount of physical activity and total exercise time (p<0.05).
Individuals who exercised more also tended to live with a spouse (p<0.01), engage in intentional/planned exercise (p<0.01), and walk for outings (p<0.01); however, they did not frequently perform household chores (p<0.05). A sig- nificant positive correlation was observed between exercise level and total exercise time (p<0.01), and a significant neg- ative correlation was observed between exercise level and time spent performing household chores (p<0.01).
Individuals with high amounts of non-exercise tended to take frequent outings (p<0.05), frequently engage in house- hold chores (p<0.05), cultivate plants (p<0.01), and have a pet in need of walking (p<0.05); however, they had no roles in the community (p<0.05) and did not frequently partici- pate in community events (p<0.01). A significant positive correlation was observed of the level of non-exercise physi-
cal activity with time spent performing household chores (p<0.01) and overall body movement time (p<0.01).
Individuals who took more steps tended to live with a spouse (p<0.01), live away from their parents (p<0.01), engage in intentional/planned exercise (p<0.01), walk for outings (p<0.01), and do plant cultivation (p<0.05). A sig- nificant positive correlation of step count was observed with total exercise time (p<0.05) and time spent on outings (p<0.05), and a significant negative correlation was noted between step count and time spent performing household chores (p<0.01).
Hierarchical multiple regression analysis of physical activity (Tables 3–5)
An analysis focusing on the amount of physical activ- ity as the dependent variable reported a negative association with age in Step 1, although this association was not signifi- cant in Step 2. There was a significant relationship between step count and plant cultivation in Step 3 (Table 3).
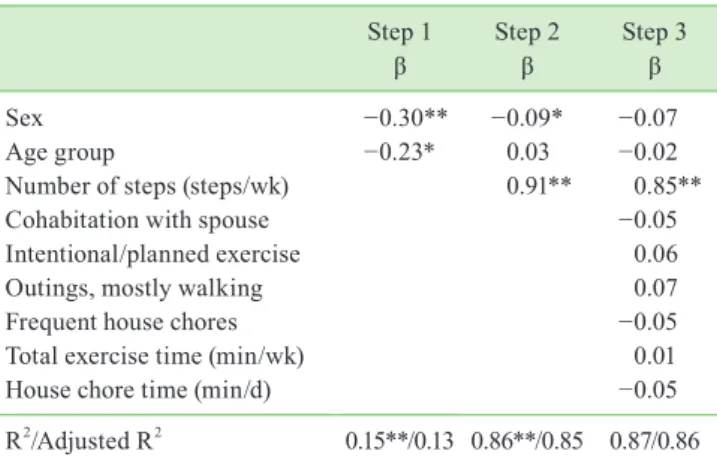
Using the amount of exercise as the dependent variable, a significant relationship was reported between sex and age group in Step 1; however, the relationship with age group became insignificant in Step 2. Furthermore, there was a significant association between the level of exercise and step count. In Step 3, wherein the parameters of daily life behav- iors were added, only step count continued to demonstrate a significant association with the level of exercise (Table 4).
Using the amount of non-exercise as the dependent vari- able, no significant relationships were observed in Step 1;
however, there was a significant relationship between sex and step count in Step 2. In Step 3, sex was no longer a significant factor; however, a significant relationship was observed between number of steps, plant cultivation, and frequent outings (Table 5). Additionally, the VIF was <2 among all the independent variables in the regression analy- sis examined at this step; thus, there were no strong correla- tions among the respective independent variables.
Table 1 Amount of physical activity (exercise and non-exercise) and step counts by sex and age group
N (%)
Physical activity (METs · h/wk) Exercise (METs · h/wk) Non-exercise (METs·h/wk) Steps (/wk) Mean (SD) Statis-
tic Signif-
icance Mean (SD) Statis- tic
Signif-
icance Mean (SD) Statis- tic
Signif-
icance Mean (SD) Statis-
tic Signif- icance
1. Men 46 (43.0) 37.9 (17.9)
1.21 ns 16.4 (14.7)
3.16 ** 21.5 (10.7)
−1.66 ns 47393.7 (28134.2)
2.51 *
2. Women 61 (57.0) 33.8 (16.1) 8.8 (8.2) 25.1 (11.2) 35305.6 (19134.6)
1. Early old age 51 (47.7) 40.0 (16.7) 2.63 ** 14.6 (13.0) 2.15 * 25.4 (10.2) 1.63 ns 46801.4 (24548.6) 2.66 **
2. Late old age 56 (52.3) 31.6 (15.9) 9.7 (10.6) 21.9 (11.7) 34765.7 (22328.5)
1. Men: early old age 21 (19.6) 39.8 (18.2) 3.56 * 19.3 (15.4) 5.88 ** 20.5 (7.9) 3.46 * 53798.2 (28384.0) 5.13 *
2. Men: late old age 25 (23.4) 36.3 (17.9) 13.9 (13.9) 22.4 (12.7) 42014.0 (27326.1)
3. Women: early old age 30 (28.0) 40.1 (16.0)
4 < 3 11.3 (10.0) 4 < 1 28.8 (10.3) 1 < 4 < 3 41903.7 (20570.4) 4 < 3 < 1
4. Women: late old age 31 (29.0) 27.8 (14.0) 6.3 (5.1) 21.5 (11.1) 28920.3 (15413.2)
Total 107 (100.0) 35.6 (17.0) - 12.0 (12.0) - 23.5 (11.1) - 40502.4 (24071.3) -
ns: not significant; *p˂0.05, **p˂0.01. Differences between two groups were assessed by the t-test and differences between the three or four groups were analyzed using one-way analysis of variance.
Journal of Rural Medicine
Discussion
Physical activity in community-dwelling elderly Japanese individuals (aged ≥65 years) who were not long-term care dependent
In this study, we visited elderly people over 65 years who were not certified as long-term care-dependent and who were introduced to us by the leader of each ward. We asked them to participate in our study consisting of triaxial accelerometer measurements and a questionnaire survey to obtain objective and subjective measurements of physical activity in daily life behaviors; we then examined the rela- tionship between physical activity and daily life behaviors.
The results showed that non-exercise in daily life behavior has elements of physical activity.
The average amounts of physical activity, exercise, and non-exercise were 37.9 METs*h/wk, 16.4 METs*h/wk, and 21.5 METs*h/wk for men, respectively, and 33.8 METs*h/
wk, 8.8 METs*h/wk, and 25.1 METs*h/wk for women, re- spectively.
Oshima’s study6) was based on a triaxial accelerometer for measuring the physical activity of elderly people (≥60 years) who mainly resided in Kyoto City and among whom medical examination revealed no disease-related physical restrictions. In comparison, the participants of the present study had higher levels of physical activity and non-exer- cise, whereas the amount of exercise was almost the same.
Moreover, the proportion of the amount of exercise rela- tive to the total amount of physical activity was low. This indicates that the amount of non-exercise in participants in
Table 2 Associations between physical activity/step counts and daily life behaviors n (%)
Physical activity (METs*h/wk)
Exercise (METs*h/wk)
Non-exercise
(METs*h/wk) Steps (wk)
Mean (SD) Signif-
icance Mean (SD) Signif-
icance Mean (SD) Signif-
icance Mean (SD) Signif- icance Cohabitation with spouse Yes No 22 (20.6)85 (79.4) 26.7 (14.6)37.9 (16.9) ** 13.4 (12.8)6.9 (5.6) ** 24.5 (10.9)19.9 (11.5) ns 43964.1 (24590.8)27217.4 (16431.0) **
Cohabitation with parents Yes No 99 (92.5)8 (7.5) 36.5 (17.1)24.4 (11.1) ns 12.7 (12.2)4.4 (4.1) ns 20.0 (10.4)23.8 (11.2) ns 27282.6 (8905.9)41570.6 (24609.8) **
Intentional/planned exercise Yes No 78 (72.9)29 (27.1) 29.3 (13.5)37.9 (17.6) * 13.7 (13.1)7.6 (6.5) ** 24.2 (11.6)21.7 (11.2) ns 43470.2 (26113.0)32519.8 (15093.4) **
Outings, mostly walking Yes No 63 (58.9)44 (41.1) 31.6 (15.6)41.2 (17.4) ** 17.8 (14.9)8.0 (7.1) ** 23.4 (11.0)23.6 (11.3) ns 33028.5 (17445.0)51203.7 (28116.4) **
Frequent outings Yes No 86 (80.4)21 (19.6) 31.6 (15.2)36.5 (17.3) ns 11.9 (11.6)12.7 (13.6) ns 24.7 (11.5)19.0 (7.9) * 37859.1 (25706.8)41147.8 (23768.4) ns Frequent house chores Yes No 80 (74.8)27 (25.2) 35.1 (15.6)35.7 (17.5) ns 10.6 (11.5)16.3 (12.7) * 18.8 (10.0)25.1 (11.1) * 46227.3 (23058.9)38570.2 (24238.0) ns Plant cultivation Yes No 68 (63.6)39 (36.4) 28.3 (13.0)39.7 (17.5) ** 13.0 (12.3)10.3 (11.3) ns 26.7 (11.6)18.1 (7.6) ** 44695.3 (23992.4)33191.7 (22694.6) * Pet that requires walking Yes No 13 (12.1)94 (87.9) 34.5 (16.0)43.3 (21.8) ns 14.0 (16.9)11.8 (11.2) ns 29.3 (13.3)22.7 (10.6) * 39543.0 (22748.2)47439.5 (32379.5) ns Roles in the community Yes No 64 (59.8)43 (40.2) 34.1 (15.2)37.7 (19.2) ns 13.0 (12.5)10.5 (11.2) ns 27.2 (13.4)21.1 (8.5) * 37929.0 (23380.3)42231.3 (24554.5) ns Frequent participation in
community events Yes No 74 (69.2)33 (30.8) 39.2 (15.4)33.9 (17.5) ns 12.5 (12.9)11.0 (9.7) ns 21.4 (10.0)28.2 (12.1) ** 38698.0 (20324.9)41307.0 (25654.3) ns Mean (SD) Correlation
coefficient (r) Signif-
icance
Correlation coefficient (r)
Signif- icance
Correlation coefficient (r)
Signif- icance
Correlation coefficient (r)
Signif- icance
Cohabitating family (n) 2.6 (1.5) 0.18 ns 0.17 ns 0.08 ns 0.14 ns
Total exercise time (min/w) 225.1 (241.1) 0.19 * 0.26 ** 0.01 ns 0.24 *
Outing time (min/d) 109.5 (84.6) 0.18 ns 0.18 ns 0.08 ns 0.23 *
House chore time (min/d) 122.3 (104.9) –0.04 ns –0.32 ** 0.29 ** –0.25 **
Body movement time (min/d) 218.1 (127.0) 0.19 ns –0.08 ns 0.37 ** 0.02 ns
ns: not significant. *p˂0.05, **p˂0.01. The nominal scale was analyzed by t-test and the ratio scale was analyzed by the Pearson product-moment correlation coefficient.
Journal of Rural Medicine
the present study increased their amount of overall physical activity.
Relationships between physical activity and daily life behaviors
Considerable age-related differences were observed in participants’ physical activity levels. Furthermore, consid- erable age- and sex-related differences were observed in the amount of exercise. A four-group comparison by sex and age group revealed considerable differences in the amount of physical activity, exercise, and non-exercise; however, the hierarchical multiple regression analysis revealed no such significant relationships. This indicates that sex and age group were not directly associated with the amount of physi- cal activity, exercise, and non-exercise. In contrast, the hi- erarchical multiple regression analysis revealed significant
associations between step count and total physical activity, amount of exercise, and amount of non-exercise. This in- dicates that step count considerably influences the physical activity of elderly individuals.
It should be noted that no multicollinearity was observed, because the VIF was <5 for all independent variables in the regression analysis in this time.
Health Japan 21 (2nd term)23) expresses physical activity goals in accordance with an individual’s step count. Our re- sults indicate that high-value step counts are associated with increased physical activity, reaffirming the importance of setting goals in terms of step counts. Increasing the daily or weekly step counts may be a relevant way to prevent frailty and sarcopenia through activities that the elderly can prac- tice in their daily lives.
However, the hierarchical multiple regression analysis revealed no significant relationship between the self-de- clared time spent engaging in intentional/planned exercise and the amount of physical activity or exercise. This indi- cates that reporting having spent more time engaging in intentional/planned exercise was not directly related to ei- ther the amount of physical activity or objectively measured exercise. The Ministry of Land, Infrastructure, Transport and Tourism (MLIT), in the Nationwide Person Trip Survey (2015)24), reported that “hobbies and recreation” and “trav- els and excursions” are some of the most popular activities in which elderly individuals engage during their free time;
however, a considerable number of elderly also take part in “learning, self-development and training” and “sports”.
This indicates that hobbies, recreation, travel, and excur- sions contribute to increased physical activity and exercise, even when the individual performing these activities is not intentionally trying to be more active or exercise more.
Regarding daily life behaviors, a significant relationship was observed between the amount of physical activity/non- exercise and plant cultivation.
Table 3 Amount of physical activity determined using hierarchical multiple regression analysis
Step 1
β Step 2
β Step 3
β
Sex −0.10 0.10 0.06
Age group −0.25* −0.01 0.00
Number of steps (steps/wk) 0.85** 0.80**
Cohabitation with spouse 0.06
Intentional/planned exercise 0.08
Outings, mostly walking −0.34
Plant cultivation 0.13*
Total exercise time (min/wk) −0.04
R2/Adjusted R2 0.08*/0.06 0.70**/0.69 0.72/0.69
*p<0.05, **p<0.01.
Table 4 Amount of exercise determined using hierarchical multiple regression analysis
Step 1
β Step 2
β Step 3
β
Sex −0.30** −0.09* −0.07
Age group −0.23* 0.03 −0.02
Number of steps (steps/wk) 0.91** 0.85**
Cohabitation with spouse −0.05
Intentional/planned exercise 0.06
Outings, mostly walking 0.07
Frequent house chores −0.05
Total exercise time (min/wk) 0.01
House chore time (min/d) −0.05
R2/Adjusted R2 0.15**/0.13 0.86**/0.85 0.87/0.86
*p<0.05, **p<0.01.
Table 5 Amount of non-exercise determined using hierarchical mul- tiple regression analysis
Step 1
β Step 2
β Step 3
β
Sex 0.17 0.24** −0.05
Age group −0.13 −0.04 −0.04
Number of steps (steps/wk) 0.32** 0.22*
Frequent outings 0.22*
Frequent house chores 0.10
Plant cultivation 0.25*
Pet that requires walking 0.14
Roles in the community −0.12
Frequent participation in
community events −0.20
House chore time (min/d) 0.10
Body movement time (min/d) 0.16
R2/Adjusted R2 0.04/0.03 0.13**/0.11 0.43**/0.37
*p<0.05, **p<0.01.
Journal of Rural Medicine
All individuals in the present study were community dwellers, and 63.6% cultivated plants in farmlands and gardens. Therefore, a reason for the higher amount of non- exercise could be frequent participation in outdoor activi- ties, such as fruit and vegetable farming and activities that require frequent crouching or bending.
Cultivation requires going outdoors almost daily, and observing the growth of plants can be fulfilling. Therefore, it is reasonable to assume that plant cultivation exerts long- lasting effects on the motivation to go outdoors and may, therefore, contribute to increased amounts of physical ac- tivity by increasing the amount of non-exercise. Weeding and farm work have estimated intensities of 3.5 and 4.3–7.8 METs, respectively5). In the present study, plant cultivation included activities that involved bending, such as plant cul- tivation and watering plants, with intensities equivalent to
≥ 3 METs. Plant cultivation also included time spent in the same position, such as transplanting a nursery tree, activi- ties such as shoveling soil or mud, and moderate-to-high intensity activities (e.g., carrying and transporting heavy objects). Given that there were considerable differences in step counts depending on the presence or absence of plant cultivation, added amounts of non-exercise (such as those involved in plant cultivation), plus increased step counts re- sulting from regular outings may have increased the overall amount of physical activity.
Furthermore, considering the features7, 10–12, 23, 24) of the triaxial accelerometer used in this study, the results may have been affected by activities that require bending, includ- ing indoor activities, such as using the vacuum cleaner or doing laundry.
A significant relationship was observed between fre- quent outings and the amount of non-exercise independent of step counts. According to an MLIT survey23), outings for the elderly frequently include “shopping for daily items”
and “dining, socializing, and participating in recreation,”
followed by “medical visits,” with a mean frequency of three outings per month23).
The triaxial accelerometer has three axes; therefore, the amount of activity other than the vertical movement of the body is reflected in the results. While the participants of the present study might have engaged in non-exercise of an in- tensity of ≥ 3 METs, such activities might not be reflected in step counts. Thus, increasing the step count and encourag- ing activities of daily living, such as plant cultivation and
frequent outings, can increase the physical activity in com- munity-dwelling elderly Japanese.
The limitations of this study included a possible selec- tion bias in favor of highly compliant individuals who were introduced by the ward leader. Moreover, the participants may have demonstrated relatively high amounts of physical activity at baseline. In addition, because this study targeted elderly people ≥ 65 years without certification for need of long-term care, we did not collect data on their past or pres- ent medical history. Therefore, it is possible that restricted daily life behaviors could have increased or decreased some participants’ levels of physical activity. Moreover, the tri- axial accelerometer cannot measure physical activity un- derwater or on a bicycle. Therefore, the above-mentioned activities were not reflected in this data, and may, thus, have been underestimated.
Further studies are warranted to better understand the mechanisms through which plant cultivation and frequent outings facilitate the increase in the amounts of non-exer- cise and physical activity. Furthermore, future investiga- tions should determine if the same results can be obtained with a larger population of elderly individuals living in dif- ferent locations, such as urban or hilly rural areas.
Conclusion
The amounts of physical activity, exercise, and non-ex- ercise in community-dwelling elderly Japanese individuals were associated with step counts. Moreover, the amount of physical activity was related to the presence or absence of plant cultivation. The amount of non-exercise was related to plant cultivation and frequent outings, thereby indicating that daily life behaviors, other than walking, may contribute to physical activity.
Presentation at a conference: A part of this study was presented at the 21st International Epidemiological Associa- tion, World Congress of Epidemiology (WCE2017).
Funding: This study was conducted with the support of the 2015-2017 KAKENHI Grant-in-Aid for Scientific Re- search (C) (Grant number, 15K11774).
Conflicts of interest: The authors have no conflicts of interest to declare.
References
1. Cabinet Office, Government of Japan Annual Report on the Aging Society 2017 (Japanese version only). http://www8.cao.go.jp/kourei/whitepaper/
w-2017/zenbun/29pdf (accessed 22 August 2019) [in Japanese].
2. The Japan Gerontological Society Statement from the Japan Gerontological Society on Frailty http://www.jpn-geriat-soc.or.jp/info/topics/
Journal of Rural Medicine
3. Delmonico MJ, Harris TB, Lee JS, et al. Health, Aging and Body Composition Study Alternative definitions of sarcopenia, lower extremity performance, and functional impairment with aging in older men and women. J Am Geriatr Soc 2007; 55: 769–774. [Medline] [CrossRef]
4. Goodpaster BH, Park SW, Harris TB, et al. The loss of skeletal muscle strength, mass, and quality in older adults: the health, aging and body composition study. J Gerontol A Biol Sci Med Sci 2006; 61: 1059–1064. [Medline] [CrossRef]
5. Ministry of Health, Labour and Welfare. Physical Activity Reference for Health promotion 2013. http://www.mhlw.go.jp/stf/houdou/2r9852000002xpleatt /2r9852000002xpqt.pdf (accessed 22 August 2019) [in Japanese].
6. Oshima Y, Hikihara Y, Ohkawara K, et al. Daily steps corresponding to the reference quantity of physical activity of amount of Exercise and Physical Activ- ity Reference for Health Promotion 2006 (EPAR2006) assessed by accelerometer. Jpn J Phys Fitness Sports Med 2012; 61: 193–199 [in Japanese, Abstract in English]. [CrossRef]
7. Honda T, Narazaki K, Chen T, et al. Association between tri-axial accelerometer-derived sedentary time and obesity in a Japanese community-dwelling older population. Research in Exercise Epidemiology 2014; 16: 24–33 [in Japanese, Abstract in English].
8. Aoyagi Y. Sex differences in sarcopenia and frailty. Geriatric Medicine 2014; 52: 343–347 [in Japanese].
9. Jinkou toukei labo [Demographics Labo]. http://toukei-labo.com/2010/danjo.php (accessed 2 August 2019) [in Japanese].
10. Japan Meteorological Agency http://www.data.jma.go.jp/obd/stats/etrn/view/annually (accessed 22 August 2019) [in Japanese].
11. Oshima Y, Kawaguchi K, Tanaka S, et al. Classifying household and locomotive activities using a triaxial accelerometer. Gait Posture 2010; 31: 370–374.
[Medline] [CrossRef]
12. Ohkawara K, Oshima Y, Hikihara Y, et al. Real-time estimation of daily physical activity intensity by a triaxial accelerometer and a gravity-removal clas- sification algorithm. Br J Nutr 2011; 105: 1681–1691. [Medline] [CrossRef]
13. Kumagai S, Tanaka S, Kishimoto H, et al. Measure of physical activity and sedentary behavior by tri-axial accelerometers and their application to epide- miological studies. Research in Exercise Epidemiology 2015; 17: 90–102 [in Japanese, Abstract in English].
14. Edwardson CL, Gorely T. Epoch length and its effect on physical activity intensity. Med Sci Sports Exerc 2010; 42: 928–934. [Medline] [CrossRef]
15. Rowlands AV, Powell SM, Humpreys R, et al. The effect of accelerometer epoch on physical activity output measures. J Exerc Sci Fit 2006; 4: 52–58.
16. Trost SG. Objective measurement of physical activity in youth: current issues, future directions. Exerc Sport Sci Rev 2001; 29: 32–36. [Medline] [Cross- Ref]
17. Vale S, Santos R, Silva P, et al. Preschool children physical activity measurement: importance of epoch length choice. Pediatr Exerc Sci 2009; 21: 413–420.
[Medline] [CrossRef]
18. Trost SG, McIver KL, Pate RR. Conducting accelerometer-based activity assessments in field-based research. Med Sci Sports Exerc 2005; 37(Suppl):
S531–S543. [Medline] [CrossRef]
19. Gabriel KP, McClain JJ, Schmid KK, et al. Issues in accelerometer methodology: the role of epoch length on estimates of physical activity and relationships with health outcomes in overweight, post-menopausal women. Int J Behav Nutr Phys Act 2010; 7: 53. [Medline] [CrossRef]
20. Matthews CE, Chen KY, Freedson PS, et al. Amount of time spent in sedentary behaviors in the United States, 2003-2004. Am J Epidemiol 2008; 167:
875–881. [Medline] [CrossRef]
21. Gardiner PA, Clark BK, Healy GN, et al. Measuring older adults’ sedentary time: reliability, validity, and responsiveness. Med Sci Sports Exerc 2011; 43:
2127–2133. [Medline] [CrossRef]
22. Tanaka C, Tanaka S. Contribution of non-locomotive activity to habitual physical activity in Japanese workers. Jpn J Phys Fitness Sports Med 2012; 61:
435–441 [in Japanese, Abstract in English]. [CrossRef]
23. Ministry of Health, Labour and Welfare. Health Japan (2nd term). http://www.mhlw.go.jp/bunya/kenkou/dl/ kenkounippon21_01.pdf (accessed 22 August 2019) [in Japanese].
24. Ministry of Land, Infrastructure, Transport and Tourism. Nationwide Person Trip Survey (2015) http://www.mlit.go.jp/common/001176318.pdf (accessed 22 August 2019) [in Japanese].