Original Article
Intra-rater Reliability and Criterion-related Validity of Using an Accelerometer to Measure the Impact Force and Knee Joint Sway during Single-leg Drop Landing
SHOGO OKAMOTO, RPT, MS1,2), RYUTA SAITO, RPT, MS1,2), MASAAKI SAKAMOTO, RPT, PhD1)
1) Graduate School of Health Sciences, Gunma University: 3-39-22 Showa, Maebashi, Gunma 371-8514, Japan 2) Department of Rehabilitation, Gunma Chuo Hospital, Japan
INTRODUCTION
Rehabilitation after anterior cruciate ligament (ACL) reconstruction has an expectation to prevent re-injury, as it is important to lower the strain on the reconstructive ligament to achieve stable motions and high performance. Noncontact ACL injuries tend to occur within 40 msec from foot contact with the ground1), and injury occurrence approximately matches the occurrence timing of the peak vertical ground reaction forces (pVGRF)2). In addition, increased pVGRF has been associated with increased strain to the ACL3,4). Therefore, a soft-landing to decrease the vertical ground reaction force (VGRF) by increasing hip and knee flexion angles during landing have been deemed as one of the re-injury prevention training programs. Some patients or athletes after ACL reconstruction have performed a soft- landing, but sometimes present knee mid-lateral sway in the frontal plane, which seems knee instability during postural remaining. The quantification of this phenomenon has relied on the subjective experiences of physiotherapists because this can only be visually observed.
A few simple and easy-to-use measuring methods used clinically can quantify the magnitude of the VGRF during landing5,6). Many researchers have reported pVGRF by using force plates7-9), although they require too wide of a space and are too expensive to use as clinical-based tools. It is visually difficult to evaluate the magnitude of impact force immediately after foot contact with the ground.
Moreover, the commonly quantified methods regarding amplitude measurements of knee joint sway have not been reported. While the measurement of the center of pressure (COP) during the landing motions using the force plate has been researched10), the COP measurement can signify a parameter that synthesizes the sway of each body segment. On the other hand, sway measurement using the accelerometer has advantages to measure sway of an attached site.
In recent years, motion sensors with two accelerometers of different detection ranges built into one have been developed. By using this in the current study, we thought that it is possible to quantify the impact force and the amplitude of knee joint sway during landing motion simultaneously. Thus, the purpose of this study was to clarify the intra-rater reliability of the impact force measurement and the knee joint sway measurement during single-leg drop landing in one motion sensor with two accelerometers and to reveal the criterion- related validity of them between the accelerometer and force plate data.
Abstract. [Purpose] The aim of this study was to clarify the reliability and validity of the impact force and knee joint sway measurement during single-leg drop landing by using a motion sensor with two built-in accelerometers. [Participants and Methods] Ten healthy college students (4 males and 6 females) who joined the basketball club participated in this study. Peak vertical acceleration, time between initial contact and peak vertical acceleration, and knee joint mediolateral sway were measured using the accelerometer during the landing motion. Reliability of the measurement by accelerometer and criterion-related validity between accelerometer and force plate data were examined. [Results] The coefficients of the ICC indicated that peak vertical acceleration was 0.88, time between initial contact and peak vertical acceleration was 0.96, and knee joint mediolateral sway was 0.62. The magnitude and the timing of the peak values between both measurement instruments showed high validity. [Conclusion] The measurement method using a motion sensor for the evaluation of the impact force and knee joint sway during landing has a moderate to high reliability and criterion-related validity. A motion sensor measurement might be a helpful method to evaluate easily the landing impact force and knee joint stability.
Key words: accelerometer; impact force; knee joint sway
PARTICIPANTS AND METHODS
Ten healthy participants (4 males and 6 females: mean age of 21.1 ± 1.1 years, height of 167.8 ± 9.9 cm, weight of 59.4 ± 7.0 kg, body-mass index of 21.0 ± 1.0, and competitive experience of 8.4 ± 2.9 years) who belong to the basketball club in college, with no history of serious injuries or surgery in the lower extremities or trunk participated in this study. The dominant leg was defined as the leg used to kick a ball11), and nine of the ten participants were right-leg dominant. Ethical approval for this study was obtained from the Ethics Committee of Gunma University (approval code 2018-059). This study was conducted in accordance with the Declaration of Helsinki. Written informed consent was obtained from all participants.
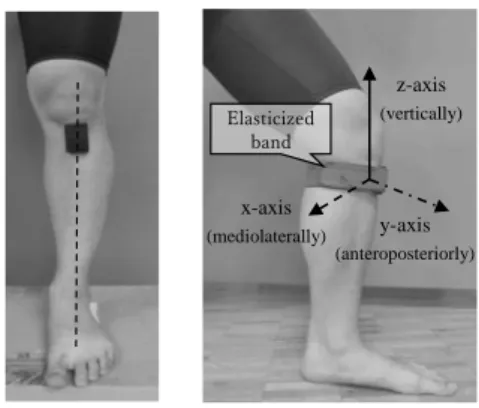
All participants performed the movements barefoot and wore athletic shirts and shorts. The reflective markers were placed on each body landmark and a motion sensor was attached to the tibial tuberosity on their dominant leg after a warm-up of light stretches and squats. They practiced three single-leg drop landings to get comfortable with the task motion before data collection. Subsequently, the participants stood on a 30-cm box with their dominant leg and the knee of the other leg flexed at approximately 90°, with neutral hip joint, arms crossed in front of their chest to exclude the effect of upper extremity movement. The participants dropped to the center of the force plate 30-cm ahead of the box without upward intention and landed on their dominant leg and maintained balance for 3 sec.
Instructions of the landing method included “Hop off the box without any upward intention, land on the same foot you are standing on, and hold the posture for 3 seconds after landing.”12). If the foot moved or slid after landing, the opposite foot touched the floor or force plate, or if the arms left their chest, the trial was excluded. Two trials were carried out on the same day and the motion sensor was removed and re-attached once between trials.
Kinematic data were collected with a 10-camera, three-dimensional motion capture system (VICON Motion System Ltd.), operating at a sampling rate of 250 Hz. The VGRF and COP data were obtained by using a force plate (AMTI Corp.) operating at a sampling rate of 1000 Hz that synchronized with the motion capture system. A total of 27 reflective markers with a 9.5-mm diameter were placed on body landmarks of the participants using double-sided tape according to Plug-in gait model as follows: bilateral front head, back head, acromion, lateral epicondyle of humerus, radial styloid process, anterior superior iliac spine, lateral epicondyle of femur, lateral of thigh, lateral of tibia, lateral malleolus, second metatarsal head, calcaneus, and 7th cervical vertebrae, 10th thoracic vertebrae, and between the posterior superior iliac spine. Motion data were calculated using Visual 3D (C-Motion, Inc). Calculated angles included trunk forward inclination/backward inclination and lateral inclination, hip flexion/extension and adduction/abduction, knee flexion/extension and abduction/adduction, and ankle dorsiflexion/plantarflexion and eversion/inversion angles. The positive direction of each angle was defined as trunk forward inclination, trunk lateral inclination on the ipsilateral for the supporting leg, hip flexion, hip adduction, knee flexion, knee abduction, ankle dorsiflexion, and ankle eversion angles, respectively. The pVGRF, time to pVGRF (Δt), and loading rate (f-loading rate) were calculated from the VGRF data. The pVGRF was normalized by body weight. The Δt was defined as the time from initial contact (IC-f), which was the moment when VGRF exceeded 10 N by a force plate to the pVGRF (Fig. 1)13). The f-loading rate indicated the ability of shock-absorption via the force plate calculations and the value calculated as pVGRF divided by the Δt and body weight9,14). The root mean square values of the mediolateral COP distance (COP-RMS) between the moment of maximum knee joint flexion position (MKF) after landing and 1 second later was calculated.
A lightweight (width of 38 mm, depth of 53 mm, height of 11 mm, and weight of 24 g) 8-axial wireless motion sensor (SS-MS- SMA5G3A200XY, Sports Sensing Co., Ltd) with a tri-axial accelerometer with a full-scale range of ±5 G and a two-axial accelerometer with of ±200 G were used, each operating at a sampling rate of 1000 Hz was used. The advantage which the motion sensor was equipped with tri-axial and two-axial accelerometers is an improvement in measurement accuracy when measuring simultaneously an action indicating greatly different acceleration values such as impact force and knee joint sway during single-leg drop landing. In order to measure the acceleration value accurately, the magnitude of the acceleration of the target motion should be as close as possible to the detection range of the instrument. The motion sensor was calibrated on a flat floor before attachment, then was attached on the front of tibial tuberosity on the dominant leg, as located perpendicular to the floor using double-sided tape and a fixed elasticized band (Fig. 2).
Three axes of the tri-axial accelerometer were taken such that the x-axis was aligned mediolaterally, y-axis anteroposteriorly, and z-axis vertically. The two axes of the two-axial accelerometer were taken with the x-axis aligned mediolaterally and z-axis vertically. The motion sensor was synchronized with motion capture system and the force plate by dedicated wireless synchronous equipment (SS- WSY12, Sports Sensing Co., Ltd). Acceleration data were taken out from a dedicated PC application as CSV format data. The x-axis data of the tri-axial accelerometer (±5 G) were filtered using a low-pass filter with a cutoff frequency of 15 Hz using analytical software KineAnalyzer (Kissei Comtec Co., Ltd.). The z-axis data of the two-axial accelerometer (±200 G) was not filtered to obtain the maximum amplitude at IC. These data were analyzed in the present study. The peak vertical acceleration value (acc-pV), the time to acc-pV (Δt’), and the loading rate (acc-loading rate) were calculated from the acceleration data. The acc-pV was normalized by body weight. The Δt’
was defined as the time from initial contact (IC-a), which consisted of the moment when the onset went in the minus direction of the acc-pV waveform to the acc-pV (Fig. 1). The acc-loading rate indicates the ability of shock-absorption calculated by an accelerometer.
The values calculated as acc-pV divided by the Δt’ and body weight. The RMS values of mediolateral acceleration (acc-RMS), which measured the x-axis of the tri-axial accelerometer as the evaluation of the knee joint sway, was used. The acc-RMS was calculated between the moment of MKF after landing and the 1 second later.
-40 -30 -20 -10 0 10 20
0 500 1000 1500 2000 2500 3000 3500
0 0.1 0.2 0.3 0.4 0.5 0.6 0.7
VGRF acc-V
(N) (G)
Time (sec) lC-f defined
with force plate lC-a defined with
acceleration
pVGRF defined with force plate
acc-pV defined with acceleration
The Shapiro-Wilk test was used to assess the normality of the data. For the examination of intra-rater reliability, the intraclass correlation coefficients (ICC 1,1) were calculated for each analysis index value measured by the accelerometers. Standard error of measurement (SEM) and MDC95, which is the minimal detectable change of the 95% confidence interval (CI) were calculated to examine the absolute reliability15). Bland-Altman analysis was performed to investigate whether fixed bias and/or proportional bias occurred16). The limit of agreement (LOA), which shows tolerance of the error between the two measurements (trial 1 and trial 2), was determined. For the examination of the criterion-related validity between accelerometers and force plate measurement values, the Pearson correlation coefficient and a simple linear regression analysis were conducted using the average of each two trial values as measures of central tendency. Bland-Altman analysis and calculation of LOA were also determined to confirm the error or bias between Δt’ and Δt.
The statistical analyses were performed using IBM SPSS Statistics version 25.0 for Windows, with a significance level of 5%.
RESULTS
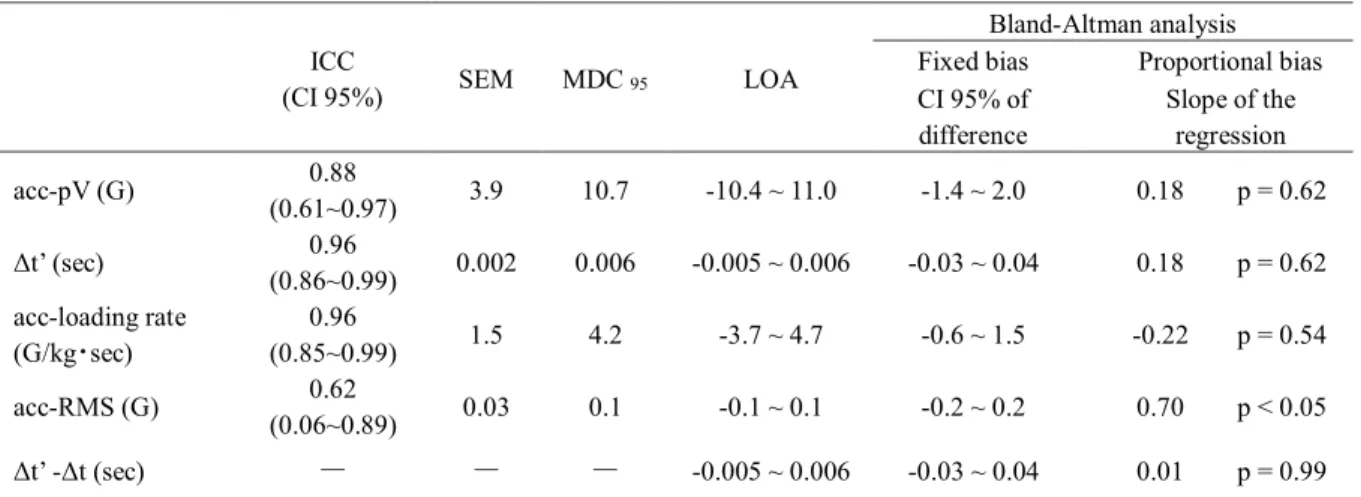
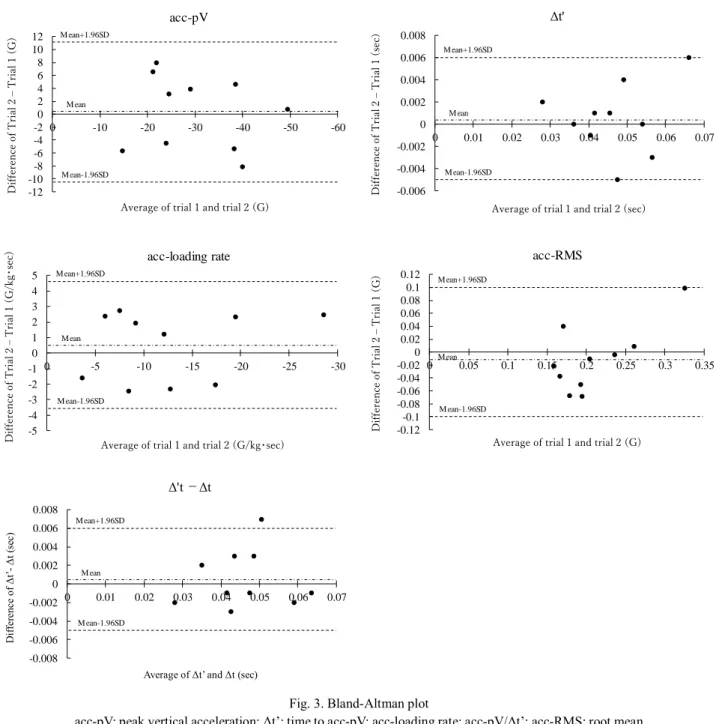
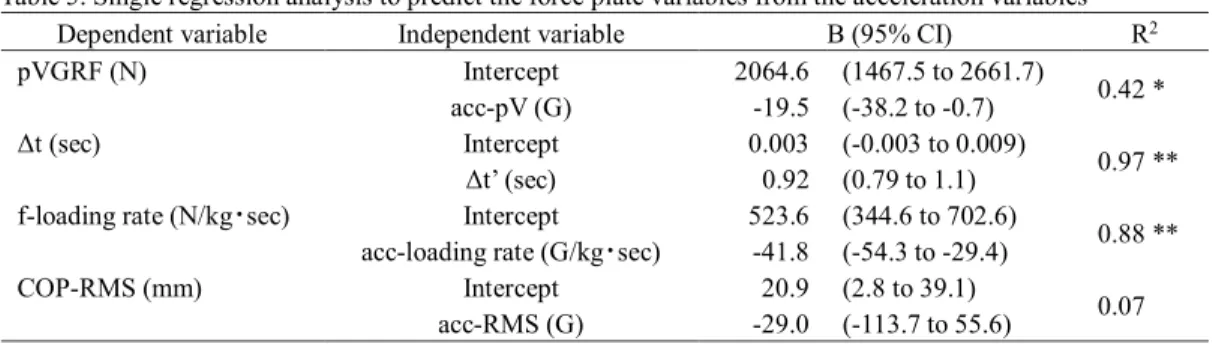
The average value of each joint angle for each phase during single-leg drop landing is shown in Table 1. The first and second measured values and their average value of each calculation item by the accelerometers and the force plate is shown in Table 2. The results of the intra-rater reliability for the measured variables, Bland-Altman analysis, SEM, MDC95, and LOA are shown in Fig. 3 and Table 3. The coefficients of the ICC (95% CI) were indicated as follows: acc-pV 0.88 (0.61~0.97), Δt’ 0.96 (0.86~0.99), acc-loading rate 0.96 (0.85~0.99), and acc-RMS 0.62 (0.06~0.89). Neither fixed bias nor proportional bias was observed in the acc-pV, Δt’, acc-loading rate, and between Δt’ and Δt, but the acc-RMS had proportional bias. The relationships between each variable for the two measuring instruments were significantly high correlation. Significant associations were found between acc-pV and pVGRF (r = -0.76, p=0.011), Δt’ and Δt (r = 0.99, p<0.01), and acc-loading rate and f-loading rate (r = -0.94, p<0.01), respectively. The acc-RMS and COP-RMS were not significantly associated (r = -0.27, p=0.45) (Table 4). The results of simple linear regression analysis are shown in Table 5.
Although the regression formula predicting the acc-pV was shown to be significant (p<0.05), the coefficient of determination was 0.42.
The Δt’ and acc-loading rate were determined as significantly and were calculated by the regression formula, and the coefficient of determinations were 0.97 and 0.88, respectively. The acc-RMS did not significantly affect the regression formula.
DISCUSSION
In the reports using accelerometers for high-speed motions, such as sports performance, running, or landing motion, there were targets Fig. 1. A typical acceleration waveform and definitions of initial contact by
accelerometer and force plate
During acceleration, a negative change indicates acceleration in the downward direction and a positive change indicates acceleration in the upper direction.
In force plate, a negative change indicates decreasing the ground reaction force and a positive change indicates increasing the ground reaction force.
VGRF: vertical ground reaction force; pVGRF: peak vertical ground reaction force; acc-pV: peak vertical acceleration; IC-a: initial contact defined by accelerometer; IC-f: initial contact defined by force plate
Fig. 2. The site of motion sensor and the definition of the direction of axes The motion sensor was attached on the front of tibial tuberosity on the dominant leg, as located perpendicular to the floor using double-sided tape and a fixed elasticized band. Three axes of the tri-axial accelerometer were taken such that the x-axis was aligned mediolaterally, y-axis anteroposteriorly, and z-axis vertically (the positive direction indicates medial, anterior, and upper, respectively). The two axes of the two-axial accelerometer were taken with the x- axis aligned mediolaterally and z-axis vertically (the positive direction indicates medial and upper, respectively).
x-axis
(mediolaterally) y-axis (anteroposteriorly)
z-axis (vertically) Elasticized
band
Table 1. Average value of each joint angle during single-leg drop landing in each phase (°)
Table 2. The variables on each trial’s measured values and average values measured by the accelerometer and force plate
Table 3. Intra-rater reliability and Bland-Altman analysis measured by accelerometer and force plate
IC pVGRF MKF
Trunk forward inclination 8.4 ± 8.4 9.1 ± 8.7 19.4 ± 11.1
lateral inclination 2.5 ± 2.5 2.4 ± 2.7 1.8 ± 3.8
Hip flexion 27.1 ± 7.4 34.6 ± 9.1 51.4 ± 10.0
adduction -10.2 ± 2.5 -8.5 ± 3.2 2.6 ± 5.3
Knee flexion 9.9 ± 3.0 27.5 ± 4.9 61.5 ± 5.5
abduction 7.7 ± 3.6 12.1 ± 5.0 20.8 ± 10.2
Ankle dorsiflexion -19.3 ± 6.7 4.7 ± 4.2 26.3 ± 3.5
eversion -5.7 ± 5.6 0.2 ± 3.4 -1.5 ± 6.8
First Second Average
(First + Second) / 2 Accelerometers
acc-pV (G) -30.3 ± 10.2 -30.0 ± 11.1 -30.1 ± 10.9
Δt’ (sec) 0.046 ± 0.010 0.047 ± 0.011 0.046 ± 0.011
acc-loading rate (G/kg・sec) -12.7 ± 7.4 -12.3 ± 6.9 -12.5 ± 7.5
acc-RMS (G) 0.21 ± 0.036 0.20 ± 0.069 0.21 ± 0.049
Force plate
pVGRF (N) 2680.5 ± 286.2 2621.6 ± 398.0 2651.1 ± 327.8
Δt (sec) 0.046 ± 0.010 0.046 ± 0.010 0.046 ± 0.010
f-loading rate (N/kg・sec) 1064.7 ± 325.9 1027.3 ± 323.9 1046.0 ± 332.8
COP-RMS (mm) 15.2 ± 5.9 14.5 ± 6.9 14.9 ± 5.6
ICC
(CI 95%) SEM MDC 95 LOA
Bland-Altman analysis Fixed bias Proportional bias CI 95% of
difference
Slope of the regression
acc-pV (G) 0.88
(0.61~0.97) 3.9 10.7 -10.4 ~ 11.0 -1.4 ~ 2.0 0.18 p = 0.62
Δt’ (sec) 0.96
(0.86~0.99) 0.002 0.006 -0.005 ~ 0.006 -0.03 ~ 0.04 0.18 p = 0.62 acc-loading rate
(G/kg・sec)
0.96
(0.85~0.99) 1.5 4.2 -3.7 ~ 4.7 -0.6 ~ 1.5 -0.22 p = 0.54
acc-RMS (G) 0.62
(0.06~0.89) 0.03 0.1 -0.1 ~ 0.1 -0.2 ~ 0.2 0.70 p < 0.05
Δt’ -Δt (sec) ― ― ― -0.005 ~ 0.006 -0.03 ~ 0.04 0.01 p = 0.99
All data are presented as mean ± SD.
IC: initial contact; pVGRF: peak vertical ground reaction force; MKF: maximum knee flexion
All data are presented as mean ± SD.
acc-pV: peak vertical acceleration; Δt’: time to acc-pV; acc-loading rate: acc-pV/Δt’; acc-RMS: root mean square values of mediolateral acceleration; pVGRF: peak vertical ground reaction force; Δt: time to pVGRF; f-loading rate:
pVGRF/Δt; COP-RMS: root mean square values of mediolateral center of pressure
ICC: intraclass correlation coefficients (1.1); CI: confidence interval; SEM: standard error of measurement; MDC95: minimal detectable change 95; LOA: limit of agreement; acc-pV: peak vertical acceleration; Δt’: time to acc-pV; acc-loading rate:
acc-pV/Δt’; acc-RMS: root mean square values of mediolateral acceleration; Δt: time to peak vertical ground reaction force
Table 4. Correlation between acceleration variables and force plate variables
Variables r
acc-pV ― pVGRF -0.76 *
Δt’ ― Δt 0.99 **
acc-loading rate ― f-loading rate -0.94 **
acc-RMS ― COP-RMS -0.27
Average of trial 1 and trial 2 (G) -12
-10 -8 -6 -4 -2 0 2 4 6 8 10 12
-60 -50 -40 -30 -20 -10 0
acc-pV
M ean+1.96SD
M ean-1.96SD M ean
Difference of Trial 2 – Trial 1 (G)
Average of trial 1 and trial 2 (sec) -0.006
-0.004 -0.002 0 0.002 0.004 0.006 0.008
0 0.01 0.02 0.03 0.04 0.05 0.06 0.07
Δt'
M ean+1.96SD
M ean-1.96SD M ean
Difference of Trial 2 – Trial 1 (sec)
Average of trial 1 and trial 2 (G/kg・sec) -5
-4 -3 -2 -1 0 1 2 3 4 5
-30 -25 -20 -15 -10 -5
0
acc-loading rate
M ean+1.96SD
M ean-1.96SD M ean
Difference of Trial 2 – Trial 1 (G/kg・sec) Difference of Trial 2 – Trial 1 (G)
-0.12 -0.1 -0.08 -0.06 -0.04 -0.02 0 0.02 0.04 0.06 0.08 0.1 0.12
0 0.05 0.1 0.15 0.2 0.25 0.3 0.35
acc-RMS
M ean+1.96SD
M ean-1.96SD M ean
Average of trial 1 and trial 2 (G)
Difference of Δt’- Δt (sec)
Average of Δt’ and Δt (sec) -0.008
-0.006 -0.004 -0.002 0 0.002 0.004 0.006 0.008
0 0.01 0.02 0.03 0.04 0.05 0.06 0.07
Δ't -Δt
M ean+1.96SD
M ean-1.96SD M ean
acc-pV: peak vertical acceleration; Δt’: time to acc-pV; acc-loading rate: acc- pV/Δt’; acc-RMS: root mean square values of mediolateral acceleration;
pVGRF: peak vertical ground reaction force; Δt: time to pVGRF; f-loading rate: pVGRF/Δt; COP-RMS: root mean square values of mediolateral center of pressure
*: Significant correlation at p<0.05; **: Significant correlation at p<0.01 Fig. 3. Bland-Altman plot
acc-pV: peak vertical acceleration; Δt’: time to acc-pV; acc-loading rate: acc-pV/Δt’; acc-RMS: root mean square values of mediolateral acceleration; Δt: time to peak vertical ground reaction force
Table 5. Single regression analysis to predict the force plate variables from the acceleration variables
during landing has been deemed as one of the injury prevention training programs in rehabilitation for patients and athletes for various knee tendinopathies or after ACL reconstruction8,9,18). On the other hand, reduction of knee joint instability (i.e. mediolateral sway) after landing is also important to prevent injury and improve performance. Therefore, we tried to simultaneously measure both the amounts of the impact force and the knee joint sway during single-leg drop landing by using one motion sensor with two accelerometers in this study and clarified the intra-rater reliability and the criterion-related validity.
The results of the ICC (1,1) showing the reliability within the examiner, acc-pV, Δt’, and acc-loading rate took the range of the coefficient from 0.88 to 0.96. These criteria, based on Landis et al.19), were indicated to be “almost perfect” and showed high reliability.
The LOA of Δt’ was also found from -0.005 to 0.006 sec. This yields a small measurement error; thus, it is probably possible to know the short time change from IC to peak vertical component force value using accelerometers, which is difficult for a therapist to judge visually. However, the LOA of the acc-pV and acc-loading rate ranged from -10.4 to 11.0 (G) and -3.7 to 4.7 (G) respectively, which seems like a large error. A cause of this might be that the motion speed from the standing position to landing was different between trials.
Thereby, although these items have a high reliability, it is necessary to pay attention to the small changes that may not be accurately measured when this measurement application is used clinically. The result of the ICC (1,1) of the acc-RMS was 0.62 so there is moderate reliability. Meanwhile, it cannot be stated that reliability is high because the 95% CI took a wide range from 0.06 to 0.89. The difficulty of the motion task (i.e. the single-leg drop landing motion from a height of 30-cm box) in this study may been high because some participants failed a few trials. Moreover, it is inferred that there were more differences and various strategies during the landing motion after MKF compared with the landing motion from IC to MKF. For the above reasons, the reliability of the acc-RMS may not have been high. In the results of the Bland-Altman analysis, no systematic error was found for acc-pV, Δt’, and acc-loading rate; thus, the measurement errors in these items were thought to be influenced by random error. Therefore, it has been concluded that accuracy can be improved by repeating the measurement. By contrast, it was found that only acc-RMS has a proportional error. This indicates the possibility that the measurement error tends to become larger when measured values are large. In Bland-Altman plot (Fig. 3), one participant had a large difference between two measurements (i.e., 0.1). This participant had a large difference between the first and second measurements in the trunk lateral inclination angles at MKF (the first measurement was 5.0°, the second was 13.5°) compared to other subjects. These postural differences might have been related to the degree of the knee joint sway after MKF. The proportional error was presented in acc-RMS due to this influence, in which it may be necessary to increase the sample size.
Significant associations were found between acc-pV and pVGRF, Δt’ and Δt, and acc-loading rate and f-loading rate (r = -0.76, 0.99, -0.94), respectively. Moreover, the result of the Bland-Altman analysis showed no fixed error or proportional error between Δt’ and Δt so that the agreement was indicated as high. It is maybe that Δt’ and Δt have a very high correlation because the sampling frequencies of both instruments are the same (1000Hz) and the current participants tend to have the stiff landing compared to previous study20). The influence of distance between the sensor and COM might be reduced when a stiff landing was carried out, so that the agreement between Δt’ and Δt seems to be high. In addition, the regression formulas of Δt’ and acc-loading rate shows a significantly high prediction accuracy.
From the above, the criterion-related validity between the accelerometer and force plate data is shown. On the other hand, although a significant regression formula was obtained for acc-pV, its prediction accuracy was low (R2=0.42). Because the motion sensor was attached to the tibial tuberosity, the differences in inclination of the tibia, depending on the knee flexion angles, influenced the axis and measured values. The mounting position, which is further from the COM, also seems to have contributed an influence. However, a significant correlation has been recognized and is considered to have a certain amount of validity. Regarding the relationship between acc-RMS and COP-RMS, no significant correlation was found. In other words, this indicates that the accelerometer can measure the sway of the knee joint.
A limitation of this study involves the difficulty and speed of the motion task, which was not unified, and may differ depending on individual participants. Furthermore, an influence due to the accelerometer’s deviation from the body surface seems to exist.
Dependent variable Independent variable B (95% CI) R2
pVGRF (N) Intercept 2064.6 (1467.5 to 2661.7)
0.42 * acc-pV (G) -19.5 (-38.2 to -0.7)
Δt (sec) Intercept 0.003 (-0.003 to 0.009)
0.97 **
Δt’ (sec) 0.92 (0.79 to 1.1) f-loading rate (N/kg・sec) Intercept 523.6 (344.6 to 702.6)
0.88 **
acc-loading rate (G/kg・sec) -41.8 (-54.3 to -29.4)
COP-RMS (mm) Intercept 20.9 (2.8 to 39.1)
0.07 acc-RMS (G) -29.0 (-113.7 to 55.6)
CI: confidence interval; pVGRF: peak vertical ground reaction force; Δt: time to pVGRF; f-loading rate:
pVGRF/Δt; COP-RMS: root mean square values of mediolateral center of pressure; acc-pV: peak vertical acceleration; Δt’: time to acc-pV; acc-loading rate: acc-pV/Δt’; acc-RMS: root mean square values of mediolateral acceleration
*: Significant correlation at p<0.05; **: Significant correlation at p<0.01
In conclusion, the results of this study suggested that using the accelerometer to evaluate the impact force and the time to peak value (i.e.
the ability of shock-absorption) during single-leg drop landing has high reliability and a certain amount of validity with the values measured using a force plate. In addition, the measurement method to determine knee joint mediolateral sway after landing indicates moderate reliability. Therefore, it is thought that the account of impact force and knee joint sway can be measured at the same time using a motion sensor with two accelerometers placed in different detection ranges built into one. Meanwhile, further verification is necessary since the measurement error tended to be large. We would like to verify the examination to improve accuracy of the measurement. In the future, the difference between the characteristics of patients with an impaired ACL or post-ACL reconstruction and healthy people should be compared.
Conflicts of interest
None.
REFERENCES
1) Koga H, Nakamae A, Shima Y, et al.: Mechanisms for noncontact anterior cruciate ligament injuries: knee joint kinematics in 10 injury situations from female team handball and basketball. Am J Sports Med, 2010, 38: 2218-2225.
2) Cerulli G, Benoit DL, Lamontagne M, et al.: In vivo anterior cruciate ligament strain behaviour during rapid deceleration movement: case report. Knee Surg Sports Traumatol Arthrosc, 2003, 11: 307-311.
3) Meyer EG, Haut RC: Anterior cruciate ligament injury induced by internal tibial torsion or tibiofemoral compression. J Biomech, 2008, 41: 3377-3383.
4) Yu B, Lin CF, Garrett WE: Lower extremity biomechanics during the landing of a stop-jump task. Clin Biomech (Bristol, Avon), 2006, 21: 297-305.
5) Rowlands AV, Stiles VH: Accelerometer counts and raw acceleration output in relation to mechanical loading. J Biomech, 2012, 45: 448-454.
6) Setuain I, Martinikorena J, Gonzalez-lzal M, et al.: Vertical jumping biomechanical evaluation through the use of an inertial sensor-based technology.
J Sports Sci, 2016, 34: 843-851.
7) Hewett TE, Myer GD, Ford KR, et al.: Biomechanical measures of neuromuscular control and valgus loading of the knee predict anterior cruciate ligament injury risk in female athletes: a prospective study. Am J Sports Med, 2005, 33: 492-501.
8) Shimokochi Y, Ambegaonkar JP, Meyer EG, et al.: Changing sagittal plane body position during single-leg landings influences the risk of non-contact anterior cruciate ligament injury. Knee Surg Sports Traumatol Arthrosc, 2013, 21: 888-897.
9) Aizawa J, Ohji S, Koga H, et al.: Correlations between sagittal plane kinematics and landing impact force during single-leg lateral jump-landings. J Phys Ther Sci, 2016, 28: 2316-2321.
10) Kawakami Y, Yonetani Y, Takao, et al.: Reproducibility of dynamic body balance measurement by center of foot pressure analysis immediately after single-leg hop landing. Kurume Med J, 2015, 62: 41-46.
11) Walsh M, Boling MC, McGrath M, et al.: Lower extremity muscle activation and knee flexion during a jump-landing task. J Athl Train, 2012, 47:
406-413.
12) Myer GD, Bates NA, DiCesare CA, et al.: Reliability of 3-dimensional measures of single-leg drop landing across 3 institutions: Implications for multicenter research for secondary ACL-injury prevention. J Sport Rehabil, 2015, 24: 198-209.
13) Mizer RL, Kawaguchi JK, Chmielewski TL: Muscle strength in the lower extremity does not predict postinstruction improvements in the landing patterns of female athletes. J Orthop Sports Phys Ther, 2008, 38: 353-361.
14) Paterno MV, Ford KR, Myer GD, et al.: Limb asymmetries in landing and jumping 2 years following anterior cruciate ligament reconstruction. Clin J Sport Med, 2007, 17: 258-262.
15) Faber MJ, Bosscher RJ, van Wieringen PCW: Clinical properties of the performance-oriented mobility assessment. Phys Ther, 2006, 86: 944-954.
16) Ludbrook J: Statistical techniques for comparing measurers methods of measurement: a critical review. Clin Exp Pharmacol Physiol, 2002, 29: 527- 536.
17) Wundersitz DW, Netto KJ, Aisbett B, et al.: Validity of an upper-body-mounted accelerometer to measure peak vertical and resultant force during running and change-of-direction tasks. Sports Biomech, 2013, 12: 403-412.
18) Aerts I, Cumps E, Verhagen E, et al.: A systematic review of different jump-landing variables in relation to injuries. J Sports Med Phys Fitness, 2013, 53: 509-519.
19) Landis JR, Koch GG: The measurement of observer agreement for categorical data. Biometrics, 1977, 33: 159-174.
20) Sinsurin K, Vachalathiti R, Jalayondeja W, et al.: Different sagittal angles and moments of lower extremity joints during single-leg jump landing among various directions in basketball and volleyball athletes. J Phys Ther Sci, 2013, 25, 1109-1113.