タイトル
Self-evaluation of phoneme production and rating
scale type
著者
米坂, スザンヌ
引用
北海学園大学人文論集(47): 27-46
Self-evaluation of phoneme production
and rating scale type
Suzanne M. Yonesaka
This study explores how scale type impacts the self-evaluation of pronunciation by Japanese university students. Participants (n=98) used a 5-point scale or a binary scale to evaluate their recordings of twelve phoneme contrasts. Both groups under-rated their perfor-mance about 20% of the time, but the Scale Group over-rated their pronunciation about twice as often as the Binary Group. The Scale Group submitted more repeated attempts, with a 38% mean accuracy on first attempts and 60% on second attempts. The Binary Group submitted fewer but more carefully selected recordings, with a mean accuracy of 64% on first attempts and 68% for second attempts. Results suggest that students learning to evaluate phoneme production will benefit from using a binary scale.
Introduction
In educational theories such as constructivism and learner auton-omy, a key concept is that of critical self-awareness. In second lan-guage (L2)learning as well, learners need to be able to evaluate their own performance. Self-evaluation often used interchangeably with self-monitoring,self-assessment,self-rating and other terms (Blanche& Merino, 1989) has been found to benefit learners in three areas: pedagogic, strategic, and administrative. Self-evaluation is also
important for pronunciation pedagogy, but its benefits in these three areas are less clear.
In general pedagogy, self-evaluation has been found to contribute to the learning process (Boud & Falchikov, 1989). Since the 1970s, pronunciation teaching has also emphasized the involvement of learners through overtly labeled self-monitoring (Morley,1991,p.493). This is because learners must notice not only the sounds that are produced by others (traditionally, native-speaker professionals), but the sounds made by the learners themselves. Learners need to be able to perceive their own pronunciation as well as the pronunciation of others, and to be able to hold both perceptions in their short-term memory long enough to compare them (Baker & Trofimovich, 2006). If a learner happens to produce a phoneme accurately,and recognizes that she has done so, then she can start to create an accurate long-term memory representation of that sound.
Pronunciation learners can benefit from being trained in how to monitor pronunciation. Ellis (1994) examined the effects of self-monitoring training on the production and self-self-monitoring of the triple consonant cluster /skt/ for 90 ESL students. She found that monitoring training had a significant effect on accuracy of self-monitoring and production,and also on the transfer of that learning to new words. In a similar study of 40 Spanish-speaking adult ESL students on the phonemes //and /t /,Hanlon (2005)found that students who had both discrimination and self-monitoring training (but not one or the other) improved significantly in phoneme production and in self-monitoring.
Important as it is in pedagogy, self-evaluation comes into its own in the the area of learner strategies. The ability to evaluate ones learning is a metacognitive strategy (Oxford, 1990) that fosters
self-management and learner independence (Rivers, 2001).
In the teaching of pronunciation, critical self-awareness is also recognized as an important strategy for informal and formal learning. Takeuchi(2003)analyzed the strategies used by good informal language learners as reported in 67 Japanese books about how I learned a foreign language . These good language learners reported listening to the L2 sounds many times,imitating them as perfectly as possible,and then checking the differences,if any,between the models and their own speech. Self-monitoring also has a central role in formal pronuncia-tion teaching, such as an expert German pronunciapronuncia-tion coaching pro-gram that develops pronunciation strategies with the ultimate goal of learner autonomy (Mehlhorn, 2005).
Another area that has reported to benefit from student self-monitoring is that of program administration. Self-evaluation can empower learners (Stefani, 1998), particularly those in a learner-centered classroom (Nunan, 1998) by involving them in the grading process and giving them some responsibility for grading. However, formal self-evaluation (or more precisely,self-assessment)in the area of pronunciation has not been found to be very successful. Dlaska and Krekeler (2008)reviewed research showing that self-rating in pronunci-ation is not reliable enough for grading. In their own study of 46 advanced learners of German,students and instructors rated over 1800 phonemes as acceptable or not. Although 85% of the ratings coincid-ed,in 184 instances (10% of the total)students rated their pronunciation as acceptable but the instructor did not. Still, although the authors argue that an 85% accuracy rate is not reliable enough for grading, these particular learners who were advanced learners residing in a country where the target language was spoken were very adept at self-evaluating their own pronunciation.
Purpose
Following Oxford s (1990) taxonomy of learning strategies, this study uses the term self-evaluation to refer to evaluating ones progress in the language. This study focuses on self-evaluation by students who are learning to pronounce the sounds, or phonemes, of English. The pedagogic goal of having the students self-evaluate is to help them form internalized concepts of phonemes, and to encourage their self-management and independence in pronunciation training.
Despite these benefits,many students are not naturally inclined to self-evaluate,thus the need for learner strategy training. In pronuncia-tion teaching, student resistance to self-management may be quite strong. In a quantitative and qualitative study of 1,228 Japanese university students, Timson (2007) found that the area in which they most desire feedback and correction is pronunciation, but that they prefer the teacher to be the source of this feedback.
Another difficulty is that evaluating pronunciation is especially problematic because of the vagueness of the criteria against which to judge pronunciation. When learners evaluate the acceptability or general correctness of their pronunciation,what might this encompass from their non-native and untrained point of view? Derwing and Munro (2005) suggest that pronunciation involves three partially in-dependent aspects:intelligibility(whether the listener can understand a speakers intended utterance), comprehensibility (the listeners level of irritation regarding pronunciation), and accent. Intelligibility is the most objective aspect, and accent is the most subjective.
When a learner monitors the pronunciation of her own recorded utterance, she cannot assess intelligibility because she already knows what she intended to say. Likewise, comprehensibility cannot be
assessed because by definition comprehensibility involves the listeners emotional reaction. So a learners assessment of the acceptability of her own pronunciation will probably be most strongly shaped by the least objective criteria: her perception of accentedness in her own speech.
Japanese learners have little exposure to non-native accented Englishes, and so their judgement of accent is not likely to be a very nuanced one. One qualitative study (Matsuda, 2003) found that Japanese secondary students have an American/British-centric view of English, and this all-or-nothing view also colors their beliefs about accent. Most of the students considered a Japanese accent to be incorrect, probably unintelligible, and not cool . This negative view of accent could result in learners evaluating their pronunciation too low.
On the other hand, learners tend to rate their pronunciation more highly than listeners do. Using quantitative and qualitative data from 282 university learners of French and Spanish, Lefkowitz and Hedg-cock (2002)found striking differences between learners perceptions of their pronunciation and their actual production. Learners tended to inflate self-assessments of their oral performance,mistakenly claiming that they could immediately recognize and repair their pronunciation errors.
Another factor that could impact student ability to evaluate pro-nunciation is their proficiency in English propro-nunciation. In a meta-analysis of 48 studies on self-rating in a variety of academic subjects, Boud and Falchikov (1989) found that, no matter what the subject is, weaker learners tended to overrate themselves they err on the side of optimism (p. 544). This trend has generally been found to be true for pronunciation as well (Blanche & Merino, 1989;Kihara, 2006).
Another issue is the question of instrumentation. When evaluat-ing pronunciation as one component of speech,ratevaluat-ing scales have often been used. Raters,learners,or their peers evaluate learners recorded oral communication within categories such as fluency, vocabulary, pronunciation, and communication strategies. Each category is un-defined, is considered to be generally understood, and is rated by a single item. Scales have had as few as four points (Lim, 2008)and as many as fifteen (Caban, 2004).
Researchers have also used scales for rating the pronunciation of individual phonemes, sometimes as part of global rating of oral profi-ciency and sometimes as discrete test. The scales used have had binary levels labeled correct/not correct (Dlaska & Krekeler, 2008), three levels labeled target-like/marginally non-target-like/clearly non-target-like (Iwashita et al., 2007), four levels (Kim, 2009), nine levels (Szpyra-Kozlowska, Frankiewicz, Nowacka, & Stadnicka,2005) and ten levels (Cucchiarini, Strik & Boves, 2000).
If students are likely to use accent as a criteria for judging,then it is useful to examine what kind of scales have been used in studies in which listeners rate the speakers accent. Southwood and Flege (1999) found that an equal-interval scale can be used by native speaker raters to judge accentedness, recommending a scale with at least nine points to avoid a ceiling effect. Scales with five points have been most commonly used in such studies,but scales with two,three,four,six,and nine points and even continuous scales have also been used (Piske, MacKay & Flege, 2001).
Instruments suitable for laboratory research may be less useful in classrooms,yet there is little information to help the classroom pronun-ciation teacher choose the most appropriate scale for self-evaluation. What type of rating scale might be most effective for student use?
This study examines the self-evaluation of phonemes by Japanese university students enrolled in an English Phonetics course. The purpose of this study is to explore how scale type (binary or equal-interval) impacts student self-evaluation in terms of accuracy and efficiency. A secondary question is whether scale type affects student improvement in their accuracy of self-evaluation of phoneme produc-tion, either within each phoneme or longitudinally over the course.
Method
Participants
The participants (n=98)were two intact groups of students major-ing in English Language and Culture who were enrolled in three course sections of a first-year course in introductory practical English pho-netics at a large private Japanese university during the 2009 academic year. Group 1 (n=62) consisted of students in two intact course sec-tions taught during the first semester (day course section=36 Ss; evening course section=26 Ss). Group 2 (n=36)consisted of students in one intact course section taught during the second semester. The participants are typical of most Japanese university students:they have little or no training in English pronunciation or linguistics and have intermediate English language skills,with a mean TOEIC score of 445, but a range from low (TOEIC 250) to high-intermediate (TOEIC 665). Informed consent was solicited in accordance with TESOL standards (TESOL, 2009).
Materials
The practical phonetics course, which met weekly for 90 minutes for approximately 13 weeks, was held in a computer laboratory with
instructor-produced materials available online through a learning management system (LMS). During the sections of the course in which students learned about vowels and consonants, they also practiced discrimination and pronunciation of some vowels and consonants. Based on previous experience and on standard resources (Avery & Ehrlich, 2004;Dale & Poms, 1994;Kenworthy, 1992), twelve phoneme contrasts that are typically problematic for Japanese speakers of English were chosen. The contrasts were:/i/・/I/(e.g.seat・sit);/ /・/
(e.g.bought・boat);/u/・ (e.g.pool・pull);/æ/・/ /(e.g.ran・run);/ /・/ /(e.g.cup・cop);/b/・/v/(e.g.best・vest);/si/・/i/(e.g.seat・sheet);/ s/・/θ/(e.g.sink・think);/z/・/ð/(e.g.breeze・breathe);initial tense vowel preceded by/j/or not (e.g.east・yeast);initial singleton /l/・/r/(e.g.lip・ rip);and initial /l/・/r/clusters (e.g. play・pray).
These twelve phoneme contrasts were practiced through listening and pronunciation exercises involving both sentences and minimal pairs. Ten minimal pairs were used for each phoneme contrast,except for /z/・/ð/and ±/j/+V which used only five because of the difficulty of finding contrasting words reasonably familiar to students: some contrastive phonemes simply have very few minimal pairs (Brown, 2005). Audio materials were recorded by the instructor, a speaker of West Coast American English. The written materials were in a class textbook prepared by the instructor.
As preparation before doing the listening exercises, the students read and listened to the minimal pairs. During the listening exercise, students heard twenty pairs of words,two for each minimal pair. Half of the pairs were different words (e.g.light and right)and half were two different tokens of the same word (e.g. light and light ). Students marked each pair same or different , checked their responses and recorded their score, which they later submitted to the instructor.
After completing each listening exercise, students did the corre-sponding pronunciation exercise. Exercises consisted of three sen-tences for each of the 12 phoneme contrasts. The first sentence contained several words highlighting the first phoneme, the second sentence contained several words highlighting the contrastive phoneme, and the third sentence contained both types of words.(In order to make reasonably natural sentences, the words containing the target phonemes were not the minimal pairs that had been used in the listening exercises.) Audio files of the sentences were uploaded and the sen-tences were printed in the textbook, with the letters representing the phonemes underlined and the IPA symbols appearing underneath.
Instrumentation
The purpose of this study is to explore how scale type impacts student participation and evaluation accuracy. For this study, stu-dents in Group 1 ( Scale Group ) used an equal-interval scale and students in Group 2 ( Binary Group )used a binary scale.
For the Scale Group, it was decided to use a 5-point assessment scale. Because the students were inexperienced in both practical phonetics and in self-evaluation, a scale with more than five points would have been overwhelming. On the other hand, a scale with less than 5 points was also rejected because it was expected that students and instructor would tend to avoid the lowest or highest rating, an expectation that was borne out. It was felt that 5 points would provide enough leeway to encourage students to submit multiple attempts,even when they were optional. The intention was to engage students in a sort of dialog about their pronunciation progress and to push students into making multiple attempts by adjusting the rating in small incre-ments.
The 5-point scale for assessing acceptability was explained to students as a grading rubric that would be used by both students and instructor. Descriptors were: 1=There is no difference between the two sounds;2=The two sounds are used randomly;3=The two sounds are sometimes used correctly;4=The two sounds are mostly correct; 5=The two sounds are always correct. Students receiving a rating of 1 or 2 were required to re-submit the exercise; students receiving a rating of 3 were encouraged but not required to do so. The rubric was distributed to students as a handout and was available on the LMS.
The Binary Group used a binary scale(yes-no)to rate their pronun-ciation,and it was explained that the same scale would be used by the instructor. Students were instructed to rate their pronunciation of the target phoneme as acceptable or not acceptable .
Procedure
Because audio files were stored on the LMS,students were able to complete the listening exercises and listen to the recorded pronuncia-tion examples at any time from any networked computer. However, few students had the capability of recording audio from at home, and the university computer room did not allow audio recording,so students completed the pronunciation recordings during class hours.
For each pronunciation exercise, students recorded the three sen-tences,converted the recording to mp3 format using Audacity freeware, then e-mailed the audio file as an attachment to a dedicated instructor account. In the body of the e-mail, students included a self-rating of the three sentences in each pronunciation exercise using the assigned grading rubric.
Students in the Scale Group sent a single self-rating of their production of the target phonemes in all three sentences of the
pronun-ciation exercise. Students in the Binary Group sent a separate yes/ no self-rating of the target phonemes for each of the three sentences in the pronunciation exercise. For both groups,the instructors assess-ment using the same rubric was e-mailed back to the student, often along with further individualized pronunciation feedback. Students in the Scale Group were required to re-record the exercise until they achieved level 3, after which further submissions were optional. Stu-dents in the Binary Group were required to record each sentence at least once,and were encouraged to re-record until they had received a
yes, acceptable rating from the instructor.
Results
Quantitative data consisted of self-evaluation scores of the twelve pronunciation exercises, and instructor assessments of the twelve pronunciation exercises. Data was checked for normalcy by plotting histograms for self-evaluation and instructor assessment of the first attempt of each of the twelve exercises. A non-normal or negative distribution was found for a majority of the instructor assessments,so non-parametric procedures were used for analysis.
The scale data were checked for statistical differences between the day and evening course sections that would not allow them to be combined as the Scale Group for this study. Mann-Whitney U and Wilcoxon W were used to test the null hypothesis that two independent samples come from the same population. No significant differences were found between the day and evening students self-evaluation. The instructor rating of pronunciation of the two groups differed significantly (p < .05) for only two exercises. It was not possible to reject the null hypothesis that the two groups come from the same
population, so the data from both groups was combined as the Scale Group.
The two instruments were judged for ease of use and for accuracy. Ease of use was considered to be related to frequency of attempts, because the easier an instrument is to use, the more attempts the students would be likely to make. Accuracy was simply defined as whether student evaluations matched the instructors.
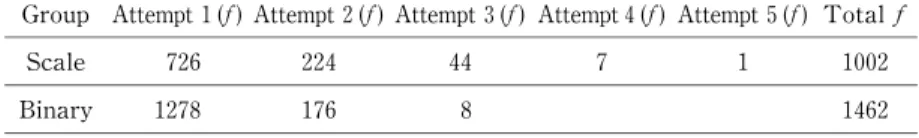
First, the frequency of total pronunciation attempts was checked for differences between the two groups. (Table 1) The Scale group submitted 1002 recordings, an average of 16 per student. The Binary Group submitted 1462 recordings, an average of 41 recordings per student. However,if the three-sentence recordings of the Scale Group had been submitted as single sentences,the average would be 48 record-ings per student, more attempts per student than the Binary Group. Nearly all students in both groups recorded and submitted each pronun-ciation exercise at least once. About a third of the students in the Scale Group made a second attempt, and a few students resubmitted recordings several times after that. In the Binary Group, less than 15% of the sentences were resubmitted a second time, and there were few third attempts.
Next,the accuracy of student evaluation was examined by compar-ing the number of student responses that were the same as,higher than, or lower than the instructors. The total number of attempts rated by both student and instructor was slightly lower than the total submitted
Table 1. Total pronunciation exercises submitted, by attempt
Group Attempt 1(f) Attempt 2(f) Attempt 3(f) Attempt 4(f) Attempt 5(f) Total f Scale 726 224 44 7 1 1002 Binary 1278 176 8 1462
in Table 1 because students occasionally neglected to send self-ratings. To allow a comparison, the data was collapsed slightly differently for the two groups.
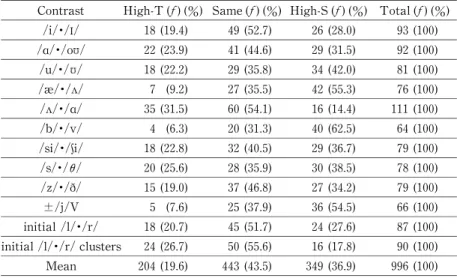
For the Scale Group,the student rating and the instructor rating of each pronunciation contrast was compared and labeled as High-T , Same,or High-S.(Table 2.)High-T indicates that the instructor rating is one point or more higher than the student rating.Same indicates that the instructor rating is within 0.5 points of the student rating.(Although the scale had five points, both the instructor and students sometimes used a half-point rating.)High-S indicates that the student rating is one point or more higher than the instructor rating.
For the Binary Group,the student rating and the instructor rating of each pronunciation contrast was also compared and labeled as High-T , Same, or High-S. (Table 3) For comparison with the Scale Group, the frequencies for the three sentences in each exercise were combined. High-T indicates that the instructor rating of the target
Table 2. Accuracy of ratings by contrast (Scale Group, all attempts) Contrast High-T (f)(%) Same(f)(%) High-S (f)(%) Total(f)(%)
/i/・/I/ 18 (19.4) 49 (52.7) 26 (28.0) 93 (100) / /・/o / 22 (23.9) 41 (44.6) 29 (31.5) 92 (100) /u/・/ / 18 (22.2) 29 (35.8) 34 (42.0) 81 (100) /æ/・/ / 7 (9.2) 27 (35.5) 42 (55.3) 76 (100) / /・/ / 35 (31.5) 60 (54.1) 16 (14.4) 111 (100) /b/・/v/ 4 (6.3) 20 (31.3) 40 (62.5) 64 (100) /si/・/i/ 18 (22.8) 32 (40.5) 29 (36.7) 79 (100) /s/・/θ/ 20 (25.6) 28 (35.9) 30 (38.5) 78 (100) /z/・/ð/ 15 (19.0) 37 (46.8) 27 (34.2) 79 (100) ±/j/V 5 (7.6) 25 (37.9) 36 (54.5) 66 (100) initial /l/・/r/ 18 (20.7) 45 (51.7) 24 (27.6) 87 (100) initial /l/・/r/clusters 24 (26.7) 50 (55.6) 16 (17.8) 90 (100) Mean 204 (19.6) 443 (43.5) 349 (36.9) 996 (100)
phoneme was Yes, acceptable but the student rating was No, not acceptable . Same indicates that the instructor and student rating are the same,whether acceptable or not.High-S indicates that the instruc-tor rating of the target phoneme was No but the student rating was
Yes .
Students in both groups under-rated their performance about 20% of the time. However, with 65% of ratings in the Same category, overall the Binary Group rated its phoneme production more accurately than the Scale Group, which had a 44% agreement with those of the instructor.
Finally, the data was checked to discover any development in self-evaluation accuracy over time, but neither group s self-evaluation accuracy improved over the course of the class. The data was also checked for differences in accuracy between the first and second attempt of each exercise. Within each exercise, the evaluation accu-racy of students in both groups improved on second attempts. The Table 3. Accuracy of ratings by contrast (Binary Group, all attempts)
Contrast High-T (f)(%) Same(f)(%) High-S (f)(%) Total(f)(%) /i/・/I/ 15 (12) 86 (70) 22 (18) 123 (100) / /・/o / 18 (14) 77 (59) 35 (27) 130 (100) /u/・/ / 27 (23) 76 (65) 14 (12) 117 (100) /æ/・/ / 36 (30) 70 (59) 13 (11) 119 (100) / /・/ / 13 (10) 81 (60) 40 (30) 134 (100) /b/・/v/ 29 (26) 78 (70) 5 (4) 112 (100) /si/・/i/ 16 (14) 89 (75) 13 (11) 118 (100) /s/・/θ/ 28 (23) 78 (65) 14 (12) 120 (100) /z/・/ð/ 29 (24) 80 (67) 11 (9) 120 (100) ±/j/V 29 (26) 80 (72) 2 (2) 111 (100) initial /l/・/r/ 23 (19) 76 (64) 20 (17) 119 (100) initial /l/・/r/clusters 11 (8) 70 (53) 52 (39) 133 (100) Mean 274 (19) 941 (65) 241 (16) 1456 (100)
Scale Group gave the same rating as the instructor for 38% of first attempts and for 60% of second attempts. The Binary Group gave the same rating as the instructor for 64% of first attempts and for 68% of second attempts.
Discussion
The purpose of this study was to explore how instrument type impacts efficiency and accuracy in self-evaluation of phonemes by Japanese university students. An effective rating scale would be one that is so easy to use that it encourages student participation. Overall, the Scale Group submitted slightly more recordings on average and produced more repeated recordings than the Binary Group. A few students in the Scale Group submitted exercises as many as four or five times:the scaled measure may have encouraged these perfectionists to persist. In contrast,only a few students in the Binary Group submitted exercises more than twice. However, most students in the Binary Group spent a very long time recording,listening,and re-recording the exercises before they submitted them, so their evaluations were more thoughtful. Overall, the two groups probably did not differ in how much actual pronunciation work they did.
An effective rating scale should also be one that is easy for the instructor to use. The instructor (who is the author)found the Binary Scale much faster to use because it did not require subtle judgements. However,another reason for the efficiency in rating the Binary Group was because the three sentences were rated separately instead of as a unit. Even though this involved sending more emails,less explanation was needed. When working with the Scale Group, the instructor needed to explain whether the problem lay in the first or the second
phoneme or both. For example,for / /・/ /,a typical email response to a student in the Binary Group was Instructor rating:Yes, No,No. Drop your jaw more. A typical response to a student in the Scale Group was Instructor rating:2.The vowel in cUp is OK,but drop your jaw more for the vowel in fAther.
An effective rating scale should also promote accurate evaluation. Overall, the Binary Group was much more accurate (65%) than the Scale Group (44%)in their self-evaluation. Unfortunately, this differ-ence cannot be attributed solely to the rating scale because the rating focus (sentence-by-sentence vs. entire exercise) also differed between groups. The Binary Group s relative accuracy was likely enhanced by the narrower focus of the materials because the more specific the learner is in self-evaluating, the more accurate the evaluation. (Ox-ford, 1990, p.162)
Neither group improved their self-evaluation accuracy over the course of the class, possibly because each new exercise presented a fresh challenge. Within each exercise, the accuracy of both groups improved on their second attempts, but in strikingly different ways. The Scale Group had extremely low accuracy (38%) for their first attempt, but improved to moderate accuracy (60%) on the second. During the second and subsequent attempts, the learners adjusted the assessment to meet instructor expectations,and the instructor adjusted the assessment to match individual students capability and motivation. However, any pedagogical value in this give-and-take is offset by the extremely low accuracy of the first attempt,representing wasted time and effort on the part of the learners and the instructor.
In contrast, the Binary Group self-rated with moderate accuracy (64%) even on the first attempt and improved slightly (68%) on the second. As noted earlier, after repeated re-recording, they submitted
their best efforts, not their first efforts, probably because of the pres-sure of the yes/no rating scale. Rather than seeking out the instruc-tors evaluation right away, they seemed to self-evaluate more care-fully. This is an important finding because the purpose of having students pay close and conscious attention to their speech is to raise their awareness and independence,ultimately so that they can continue to progress in their pronunciation skills even after completing the course (Miller, 2001).
The overall mediocre accuracy of 44% and 65% for the two groups supports the findings of earlier quantitative (Dlaska & Krekeler,2008) and qualitative (Lefkowitz & Hedgcock, 2002) research showing that student self-evaluation of pronunciation is not reliable enough for grading purposes. However, pronunciation instructors should take heart in the fact that small changes in the materials or rating instru-ment can greatly improve student ability to self-monitor. This study suggests that Japanese university students who are learning to monitor their pronunciation will probably benefit from materials that have as narrow a focus as possible and from a rating instrument that gives them fewer rather than more choices.
The results of this study cannot be generalized to other populations because, due to the two intact groups, it is not a true experimental study. Even though the difference in rating scale (binary vs. equal-interval) is confounded by the difference in materials (sentences vs. exercises), some insights have still been obtained.
Conclusion
Although intelligibility is a necessary element of oral communica-tion,many learners do not receive adequate pronunciation training due
to limited classroom time. However, self-evaluation empowers learners to continue improving their pronunciation outside the class-room and throughout their lives as self-managing,independent learners. Choosing the appropriate type of rating instrument is only one step there are many more in providing an efficient and effective experi-ence in the self-evaluation of pronunciation.
Other potentially useful classroom-based research in this area might be to investigate other instruments such as three-point scales,to do longitudinal studies of the development of learners ability to self-evaluate, and to explore the characteristics of learners who are extremely poor or extremely accurate judges of their own pronuncia-tion.
References
Avery, P., & Ehrlich, S. (2004). Teaching American English Pronunciation. Oxford:Oxford.
Baker, W., & Trofimovich, P. (2006). Perceptual paths to accurate produc-tion of L2 vowels:The role of individual differences.IRAL -Internaproduc-tional Review of Applied Linguistics in Language Teaching, 44(3), 231-250. Blanche,P.& Merino,B.(1989).Self-assessment of foreign-language skills:
Implications for teachers and researchers.Language Learning, 39 (3),313-338.
Boud, D. & Falchikov, N. (1989). Quantitative studies of student self-assessment in higher education: A critical analysis of findings. Higher Education, 18(5), 529-549.
Caban, H. (2003). Rater group bias in the speaking assessment of four L1 Japanese ESL students. Second Language Studies, 21(2), 1-44.
Cucchiarini, C., Strik, H., & Boves, L. (2000). Different aspects of expert pronunciation quality ratings and their relation to scores produced by speech recognition algorithms. Speech Communication, 30, 109-119. Dale, P., & Poms, L. (1994). English Pronunciation for Japanese Speakers.
Derwing,T.,& Munro,M.(2005).Second language accent and pronunciation teaching:A research-based approach. TESOL Quarterly, 39 (3), 379-398. Dlaska, A. & Krekeler, C. (2008). Self-assessment of pronunciation.System,
36(4), 506-516.
Ellis, D. (1994). Effects of self-monitoring and discrimination training on pronunciation change by nonstandard speakers of English.Ph.D.disserta-tion, City University of New York, United States. Abstract retrieved August 22,2010,from Dissertations & Theses:The Humanities and Social Sciences Collection. (Publication No. AAT 9431352).
Hanlon,E.(2005).The role of self-judgment and other-perception in English pronunciation attainment by adult speakers of Spanish. Ph.D. disserta-tion, City University of New York, United States. Retrieved August 22, 2010, from Dissertations & Theses:The Humanities and Social Sciences Collection. (Publication No. AAT 3159215).
Hsiao, T. Y. & Oxford, R. (2002). Comparing theories of language learning strategies:A confirmatory factor analysis.The Modern Language Journal, 86(3), 368-383.
Iwashita, N., Brown, A., McNamara, T., & OHagan, S. (2007). Assessed levels of second language speaking proficiency: How distinct? Applied Linguistics, 29 (1), 24-49.
Kenworthy, J. (1992). Teaching English pronunciation. London:Longman. Kihara,N.(2006).Gakusei no jikou tasha hyouka ni kansuru ichi kousatsu.
[A comparative analysis of self-,peer-,and teacher-assessment of English oral presentations.] The Journal of Nagasaki University of Foreign Studies, 10, 105-117.
Kim, Y.-H. (2009). An investigation into native and non-native teachers judgments of oral English performance: A mixed methods approach. Language Testing, 26(2), 187-217.
Lefkowitz, N. & Hedgcock, J. (2002). Sound barriers:Influences of social prestige,peer pressure and teacher (dis)approval on FL oral performance. Language Teaching Research, 6(3), 223-244.
Matsuda, A. (2003). The ownership of English in Japanese secondary schools. World Englishes, 22(4), 483-496.
Paper presented at the Phonetics Teaching and Learning Conference, University College London. Retrieved August 15, 2010 from http://www. phon.ucl.ac.uk/home/johnm/ptlc2005/ptlc2005.htm
Miller, S. (2001). Self-monitoring, self-help, and the route to intelligible speech. The CATESOL Journal, 13(1), 183-199.
Morley, J. (1991). The pronunciation component in teaching English to speakers of other languages. TESOL Quarterly, 25(3), 481-520.
Nunan, D. (1998). The learner-centered curriculum. Cambridge:Cambridge. Oxford, R. (1990). Language learning strategies: What every teacher should
know. New York:Newbury House.
Piske,T.,MacKay,I.& Flege,J.(2001).Factors affecting degree of foreign accent in an L2:A review. Journal of Phonetics, 29 (2), 191-215.
Rivers, W. P. (2001). Autonomy at all costs: An ethnography of metacognitive self-assessment and self-management among experienced language learners. The Modern Language Journal, 85(2), 279-290. Southwood, M. H. & Flege, J. (1999). Scaling foreign accent:Direct
magni-tude estimation versus interval scaling.Clinical Linguistics and Phonetics, 13(5), 335-349.
Stefani,L.(1998).Assessment in partnership with learners.Assessment and Evaluation in Higher Education, 23(4), 339-350.
Szpyra-Kozlowska, J., Frankiewicz, J., Nowacka, M., & Stadnicka, L. (2005). Assessing assessment methods:On the reliability of pronunciation tests in EFL. Paper presented at the Phonetics Teaching and Learning Conference, University College London. Retrieved August 15, 2010 from http://www.phon.ucl.ac.uk/home/johnm/ptlc2005/ptlc2005.htm
TESOL (2009).Informed consent policy statement and release.http://www. tesol.org/
Takeuchi, O. (2003). What can we learn from good foreign language learners?A qualitative study in the Japanese foreign language context. System, 31(3), 385-392.
Timson,S.(2007).An analysis of preferred error feedback styles of Japanese university EFL learners.Ph.D.dissertation,Lancaster University,United Kingdom. Abstract retrieved August 22, 2010, from Dissertations & Theses:The Humanities and Social Sciences Collection.(Publication No. AAT U239521).