Lat..
,,a,2
,,.
,,
,,,.,,
,,,.
,,
,.
,,
{OT",',".a,i,.O,l・
.fi;r
".Cf`"A'fl)a"Nd.
,C3osertr6:Itobn,,Ii[tggign7eeriRg
Spt3ffoaj
if
sliM#
$6ttt
Nffraith.e
:
DYNAMIC
PROPERTIES
AND
RESPONSE
ANALYSIS
OF
A
FULL-SCALE
REINFORCED
CONCRETE
SEVEN-STORY
STRUCTURE
-Part
of
the
U.
S.
-JAPAN
Cooperative
Research
by
YOSHIKAZU
KITAGAWA'
and
MITSUMASA
MIDORIKAWA",
Members
of
A.
I.
J,
1.
Introduction
As
part
ofthe
United
States-Japan
Coeperative
Research
Pregram
Utiiizing
Large-Scale
Testing
Facilitiesi),
full-scare
seismictests
on a seven-story reinforced concrete(RIC)
structure were recommendedin
orderto
makecomparisons among actual
full-scale
structuralbehavior,
small-scale modelbehavior
and analyticalstudies,
and
in
order
to
assessthe
damage
and safetylevels
of structuresdesigned
by
currentdesign
practices.
Consequently,
pseudo-dynamic
seismictests
werepeJformed
in
orderto
investigate
stiffness, strength andinelastic
behavior
of anRIC
test
structure subjectedto
simulated earthquakes ofdifferent
intensities.
Also,
vibrationtests
were carried outto
examine
the
dynamic
properties
of
both
elasticand
damaged
test
structures.This
paper
presents
the
results
of
vibrationtests
and
inelastic
dynamic
response analyses onthe
full-scale
seven-story
RIC
structure,In
vibrationtests,
the
structuraldynamic
properties,
such as naturalperiods
of
vibration, mode shapes and criticaldamping
ratios, were obtained atthe
beginning
andthe
end ofpseudo-dynamic
seismictests.
Vibration
tests
were carried outfive
times
throughout
alltest
programs.
Finally,
a change ofdynamic
properties
ofthe
test
structureis
discussed
andinterpreted.
In
additionto
vibrationtests,
inelastic
dynamic
response
analyses were
done
which consideredthe
dynamic
effects of strain rate andstress
relaxationduring
the
pseudo-dynamic
tests.
The
analytical results were compared withthe
pseudo-dynamic
test
results, andthe
dynamic
effects on
inelastic
behavior
ofthe
test
structure were examined.Pseudo-dynamic
tests
were comprised oftwo
phases.
In
the
first
phase,
the
structure without nonstructuralelements
wastested
under variousearthquake
motions6]・')・S}・ii}・i4)・iS)・i8).After
the
first
phase,
the
installation
ofvarious nonstructural
elements
followed
the
repair ofthe
damaged
structure.In
the
subsequent $econdphase,
the
effectiveness ef repair and
interaction
between
the
structural
and nonstructuTal elements was exarninedi2).In
this
paper,
the
test
resultsin
the
firSt
phase
arediscussed.
The
test
resultsin
the
secondphase,
however,
arelisted
andshown
in
the
tables
andfigures
for
reference.2.
Test
Program
andProcedure
ofVibration
Tests
2.1
Test
Building
Figure
1
illustrates
the
test
structure.In
pseudo-dynamic
tests,
the
load
was appliedin
the
X-clirection,
i.
e, ,the
longitudinal
<NS)
direction.
The
cross section of columns andgirders
was500
×500
mm and500
×300
mm,respectively.
The
structure
had
a
shearwall
of200
mmin
thickness
in
the
middleline
(B
Line)
parallel
to
the
NS
direction.
Shear
walls of150
mmin
thickness,
isolated
from
the
columns, were also arrangedin
the
exteriorframes,
1
and4
Lines,
parallel
to
the
Y-direction,
i.
e, ,the
transverse
(EW)
direction,
Cross
sectionsof
members arelisted
in
Table
1'S).
2.2
Test
P:ogram
Table
2
indicates
the
test
program
and sequence.Pseudo-dynarnic
tests
werecomprised
of
two
phases
as
mentioned above.
Each
phase
censisted offour
subprograms.They
aredescribed
in
detail
in
Refs.3
and
9.
The
structure
wassubjected
to
an earthquakebefore
startingthe
first
vibrationtest(VTI).
'
Head,
Civil
Engrg.
Div,,
Building
Research
Institute,
Ministry
ofConstruction,
Dr.Eng[g.
#
Chief
Res.
Struct.
Eng[.,
Struct.
Dynamics
Diy.,
Building
Reseaich
Institute,
Ministry
ofConst[uctlon,
D[.
Engrg.
{Manuscript
receivedJuly
8,
19S6)
2.3
Procedure
of
Vibration
Tests
Viisration
tests
(VT)
were carried out2]・')・SL9)'i3)five
times,
labelled
VTI
through
VT5.
The
state ofthe
structure orthe
degree
of
damage
at
each
stage
of
the
vibrationtests
aredescribed
in
detail
in
Refs,
3,61
11
and12,
andbriefly
reviewed
as
follows
:
i
)Test
VTI
;
the
structure wasin
the
elastic range,iOTest
VT2
;
the
maximum angle ofrotation
of
the
structure
had
reachedll64
at
the
rooflevel
in
the
previous
test
SPD43L`)・"),
Figure
2
showF,the
sideview of
the
crackingpattern
in
B
Line,
iii
)Test
VT3
;
the
damaged
structurehad
been
repairedby
means ofthe
epoxy
injection
technique]2),
iv)Test
VT4;
various noristructuralelements
such as spandrelbeams
andpartition
walls
had
been
installed
in
the
repaired structure'2].The
reinforced concrete spandrelbeams
were setih
one ofthree
s'pans of
Li4es
A
andC,
that
is,
between
Lines
3
and
4,
frorri
the
2nd
fioor
to
the
7th
floor
level.
The
partition
wallswere arranged
on
the
3rd
and5th
floor,
The
types
ofthe
partition
walls were as'follows
;.(
1
)metal
stud andgypsum
board,
(
2
)wooden
stud,gypsum
lath
andplaster
finishing,
(
3
)metal
stud, metallath
and cement mprtarfinishing,
O
o
e
@.
Tablel
Ligt
ofMernber
Cross
Section
@i'==:r=+i==rT--ill--:,--'
-'
・
V1/
ld ±1 blLl
Lx
e
..S..-":
"..jil... e 11 IP /b 11 llp
I:
ll
ll
!!
!l
8
11 11 11 11 14 e 11 tl 11 11 /i ut H LI /1 11 at@
===IL==="
==Lta=ti===!'=== 1 db ll d8im
cu
6ooo sooo 6eoo 17ooO
-1 Cross ties ere DIO elOO ineoundery Colufim et 1.st a"d 2-nd stories.
Table
2
Test
Sequence
secutn
ev
Fig.1
Plan
andElevation
of.theTest
Building
'
eeemooeneaeoegnggeanoeeMoRee
COLUHH ENDCEHIER VALL
Longi'
tt
Beem :".ttS:DSOOI500bxO3oessoeThticknesszooU-uo
MainBarse-o!zTop1-Dlg!-DlgLenthsooo HeopD]oelooaottom2-D193-D19Reinf.vsH2-Dloe2oo CrossTiesDlopsee+1stirrupDIOelooDloe2ooCelumsooxsee E"OCENTER OVTSIDE[EHTERINStDE[Unit.nen, Trens,HedmuauoSubaeamuououo b:D300x450bxD 2SOx450 TopS-DISz-DISTep2-D19z-D193-D19 Bottom2-D193-D19Bottom2-D192-Dlg2'e19 StirrupDloelooOIOe2ooStirrup D]Oe!oo TESTMe. r.ONTENTS n-1FreeEfer[edvibratientests-r-tttt.-tt-m-tt!1020ko't.m
FtL]Eachfleorlevelloedringtest SL]Staticloadingtest underinvertedtriangular]eaddistribution SPD1Pse"do-dynemictest(Gmax±
±dnm, i'lodifiedHITAGIKENOKITOHOKUUNI.NSRmaxtlt70nO)Gmas=23,5eeT' SPD2Pseude-dymemictest[Emex= ±5S"En, MedfffiedMITAGIKEHOKTTOHeKUUNI.NSPanax=lf400)rgTax=105gn] SPD1Pseudo-dynamictest(Emex= ±ISIffun, riodifiedTAFTEW1052dnax=3ZOoral-knei!3t4eD) SPD4Pseudo-dynemictest{6max= ±290mm, TOxu,CHIOKIHACHINOHEE!"Giext350oel'Rmax=li7S} FLL2Eethflearlevelloadingtest VT2Free&forcedvibratientestswr!sle?o)tkg-m REpairs byepoxy injectienVT 1FLL
3Free
e forced vibretien tests wr
=
5, 20 kg-m Each floorlevel loedingtestArrangement ofnenstructurel elements
Elg.2
o
Crack
@
@'
o
FRAHE-B
ing
Pattgrn
in
Line
B
afterTest
SPD4
VT4Free&forcedvibretiontestswr=ZOkg-m FLL4Enchfleor]evelIDadfingtest SL?Staticleading underinvertedtesttriengularleaddistribution SPD5-]Pseudo-dynemibyuseofthe
(kffex=lt]oooctestssameinput
-3t400)matienfromSPD1teSPD4
'
SL3Staticloadi(knax=1/50)ngtestunderuniform・
'
loaddistributian. VT5Free&farcedvribretiontestswr±
5,10,?Otq・m'SmaxRmsx
HGma.
wr:
Target
maximumdispEacement
at the roofleve[
:
Taiget
maximum angle et rotatienema.fH
:Total
heihgt
ofthe
test
building
:Maxirnurn
acceleration of aninput
ground motion:Unbalanced
moment adoptedin
transtatienalnance tests
(4
)autoclaved
lightweight
concrete, and(5)concrete
block,
v)Test
VT5;at
the
final
stage ofthe
staticloading
test
SL3,
shearfailure
hpd
occurred
in
the
shear
wallat
the
first
story.
The
maximum rotation angleof
the
structure
had
gome
upto
1167
at
the
rooflevel.
In
the
VT
test,
four
types
ofclynamic
tests
were carried out;
a)Observation
of natural earthquake response(EQ),
b)
Observation
of microtremor excitecl vibration<VT-M-1-5),
c)
Free
vibrationtests
(VT-F-1-5),
d)
Forced
vibration
tests
(VT-G-1-5).
There
was repetitionof
sudden
releaseseven
times
with appliedtension
between
O,
5
'
and
3,5
tons
in
eachfree
vibrationtest.
The
forced
vibrationtests
were carried outby
employingtwo
rotating eccentric weightexciters
on
the
rooLAt
one
time,
the
structure was excitedtranslationally
in
the
NS
orEW
direction,
while atthe
othertime
the
torsional
vibration wasgenerated,
In
torsional
vibrationtests,
the
sweep'uptechnique
aroundthe
torsional
naturalfrequency
was adoptedbecause
of verylow
level
excitations.
3.
Measurements
and
Data
Reduction
3.1
Instrumentation
andMeasurements
The
free
vibrationtests
(VT-F)
were madeby
the
"pull-backand
quick
release" method.The
forced
vibrationtests
(VT-G)
wereperformed
by
two
exciters as shownin
Fig.
3,
whosecharacteristics
and
the
adopted
valuesof
unbalanced moment are
listed
in
Table
3.
The
instrumentation
system consisted of structural responsetransdttcers,
amplifiers associated with
integral
circuits, a magnetig-tape recorder and oscillographs.The
transducer
was a velocity and electromagneticpickup,
with a naturalfrequency
and criticaldamping
ratio of1
Hz
andO.67,
respectively.Figure
3
showsthe
typical
measurementlocations.
A
strong-motion accelerograph,SMAC-M
type,
was set up on
the
roofto
obtainthe
natural earthquake responses.3.2
Data
Reduction
In
VT-F
tests.
the
fundamental
naturalfrequency
andthe
damping
ratio were obtainedfrom
the
ayerage ofthe
stable and
first
five
waves ofthe
record.In
VT-G
tests
by
Exciter
1,
accurate values ofthe
translational
naturalfrequency
and
associated
damping
ratio couldbe
obtainedfrom
the
resonance curves.The
damping
ratio was obtainedby
use efthe
half-power
(bandwidth)
method.The
recordsof
torsional
vibrationsby
Exciter
2
wereTabie
3
Vibration
Exciter
Characteristics
SedhrWesternlbataki Ref,EartmpakeJamary 2B 19M di100
g
s
N
t
8 dlO1100
vo
i
e
e
SIO% s te ls 10 Tin,eCsecl moesuredReefAcce[eration
Fig.4
Accelerograms
onthe
Roof
Obtained
by
S,MAC-M
1.
Exciter2
Excherl
oe@@
a
,9
bl li O 11 LSL-7N
a
LaadingDirectien
O
@
a
@
-e.horizontalcemponent
eyertlcatEonyponent
O.
ao
2.o
4.o6.o
s.o
f(Ht
Fig.3
Location
ofPiekups
andVibration
Exciters
in
Longitu-
Frequeney
dinal
(NS)
Direction
Fig.5
Fourier
Spectrat
Ratio
ef anEarthquake
Record
-34-CharacteristicExciter1Exciter2(BRI-Btype){EX-4DCtype)
Dlrection TwohoritentnlOnehorilentale"evertical
Hiximumgenerated force,intonf lo O.1 Frequen[yrange,inHertlo.Z-IS 2-25 Unbelancedmement.inkiloeram-meters
'
75 o.e4 Adopteaunbalan[edmoment,s,10,20 o.e4 inkilepram-",eters o EW-Ccapctxtrt Mlai.s3.Sgal o% 5 10 IS 20T'inetseel 1t"edliLJLSouth-Weste;nlbaraki-Pref.Eerthquake
1981.1.2e
1111tltpl1lldi NSEW----Jdl4,pbl"i11JLPbr+-t.t
-SMAC-MI1"lllL/lLlii:d1,
N-S
:LJ-"-1ldtl"'iv-tXxNtS
-.t
Table4
Natural
Periods
andDamping
Ratios
Obtained
by
Vibration
Tests
vrl vlz VTI VT4 YT5 beforeP.D.TestafterP,D.TestdftetRepairefterN,E.afteFFeiluee Her.6-919SlJulys-lolgslAug.1-419SlSept.9-1219SlNev.S-719Sl PenodDamp.PeriodOnmp.PeriedOnmp.PerjedDftmp.PeriodDamp. Micro-trerrortl
NSlstO.42sec.O.TSsec.O.S5s!c.OA3see.O.SOSDC.(VT-M)2nde.11seE.O.15sec.O.13set.O.12sec.O.21Ee[.
ENlsto.zyse{.O.35sec.D,3Gsec,O.3Esec.o,qssec, 2nd O.11sec.D,11sec.O.11sec.O.14sec. FreeVibration'
NSlsto.4Ssec.O.021O.8Dsec.O.02nO.57seE.M.O19O.45sec.O.02So.s6seE.O,O19 11dl/ 1/ 1CVT-F)
O.81se[.O.031o,6esec,o.olsO,4Tsec.O,035ostsec,o,o3r+]
FercedVibratiDn+z NS}str O,83sec,O.O09o.sosec.o.mlx O.S6sec.O.O15 x O.S5sec.O.Ollx I O.91sec.O.O13{VT.G]
O.41seE.O.O19O.91sec.O.O19O.63sec.O.O13O.52sec.O.o?qO.96sec.O.Olg NSZndx O.11sec.O.O14O,i4sec.O,OIZr O,2fisec.O.DIO x O.]8se[.O.O12x x o.zlse[.O.O19 O.11se[.O.Ol?O.20sec.O.O19o.ISsecO.OISO.14sec.O.OISe.ztsec.o.e14 EvelstO.10sec.o."stc.o.oleO.44se[.o.024e.44sec.O.o20O.S]sec.O.e!3 2ndO,OE9sec.O,14sec,O,O13O.14sec.O,14sec,O.O13O,]]sec,O,O19 TorsfionO,23sec.O.00eO.30sec.-O.2gsec.O,2Ssec,O.31sec. FreeVibretionfP,D,Test}O.q3sec.{1.trtrm)O・74s{c.{o.im]1,scsec.(15im)I D.STIec,{1.0mo)x
Notel
h)
(-)
Data
were not obtained.'3)
Three
values ineach colurnn20
kg-m,
Table
'2)
(X)
Vibtation
testwasnot carrledout.correspond tounbalanced rnernent5, 10 and
5
Cemparison
amongNatu'ral
P
Raties
in
Longitudinal
(NS)eriods
and
Damping
Difection
ModeNumberE]rthq.RecordFreevib.TegtForcedVfib.Iest'StaticTettFrameAnalysis
NeturelPerfiod(sec,)lstZndO.410O.107O.43t4o.e3o.11o.a4sO.125rmoftS6s'nsos(O,4sa)tFO.133O,l2th DampingR-tiolst2ndO.02E-]D.021O.O19+iO.Ol?.ltt+!-7+-Yeung's modulus is210 tlorm'.
Tovng'srrodulus is!44tXan2.
Dampjng rntio isobtained by the hnlf-power method. Data -ere not obteined.
Nuh[eele.---,2<EeEdeUea・-o!gdi :vE=E:.(6aj
Fig.7
4 2oO.5
o・.--ocrE]=vetrcoso
60
40
2
RFIIFNS-Direction
Micre-tremor111,34Hz(O]5sec)
i
i
6.66HztO.ISsec)024GSf(Hi}
Frequency
Fig.6Fourier
Speetra
Test
VT-M-2
in
ReoftstTTinsiatLonalMode i NS7Directon11.1OHI[a.slsec] /enbalthcedrtnment2ekpmJ"-10kpm1ii72HoiH(SteaSfiS3ecse][)E.,tt.i Sbgrn:tlL:IL/-s/,/1Jny'e'tF.,..z==T=ttttttYl'・ly.L.ijh..'
Resonance
1.0 IS FreqveneyCuryes
in
NS
efMicrotremers
;
NS
Dfrection
lt(
] rar'cEL
't
E
u
FrequentyDirection
;
Test
VT-G-2
analyzed
by
means ofthe
fast
Fourier
transform
(FFT),
which was also appliedto
the
spectral analysis ofthe
records
of
an earthquake response and microtremor excited vibrations.
4,
Vibration
Test
Results
The
structure was subjectedto
an earthquake with amagnitude of5.
0
onJanuary
28
of1981.
Figure
4
showsthe
accelerograms whose
FQurier
spectra are shownin
Fig.
s.
The
predorninant
periods
of vibrations ofthe
structurein
the
NS
andEW
directions
wereO.4Z
sec. andO.29
sec.,
respectively.The
naturalperiods
anddamping
ratiosin
the
NS,
EW
andtersional
directions
procured
from
the
micr'otremo[ measurement(VT-M)
andthe
free
andforced
vibrationtests
(VT-F
and
VT-G)
are summarizedin
Table
4.
Typical
examples ofthe
results ofthe
spectraL analysis and resonance curves aredepicted
in
Figs,
6
and
7,
which correspondto
test
VT-M-2
andVT=G-2,
respectiveiy.5.
Discvssion
ofTest
Results
Vibration
test
resultsin
the
longitudinal
(NS)
direction,
in
whichthe
loading
ofpseudo-dynamic
seismic
tests
was carried out, areprincipally
discussed
.in
this
section.5.
1
Comparison
Among
Natural
Periods
in
Initial
Elastic
Range
The
trans.lational
naturalperiods
and
damping
ratiosin
the
initial
elastic range were obtai.nedfrom
four
dynamic
tests,
each
floor
levei
loadipg
test
(FLLI),
andthe
frame
analysis3Lii}.These
resultsin
the
NS
direction
aresummarized
in
Table
5.
The
correlation
between
the
dynamic
tests
(VT-M-1,
VT-F-1
andVT-G-1)
andthe
earthqua'ke record
(EQ)
was excellent with respectto
the
naturalperiods.
The
funclamental
naturalperiod
turned
outto
be
4
ancl17
percent
longer'in
the
FLLI
test
andthe
frame
analysis respectivelythan
in
the'VT-G-1
test.
If
the
-35-"6.'b'
:'i'woE;.shloilgg
Te6.eSD4010m1,eQe as 1ttcasinajij'ReefTrensLaliefialNS-1stModeUabtlthttdMomlntnbm :ittOM'h:fQgl:/l::!Lselt:r/(oss-tj /t:L・1,'1/:,tmvatsrilaptc,1ils!nd1
:'i'/i':':i'.,stI.Xtttttttttt'.tt:t.vt
1.o t5Fig.8(a)
"l"-g・
X.tec
1LvgB{i\: ILO!1010.0aoao40zoo.oResonance
Test
'A'uot!.E'95so4e102D1.ea 2D 2,5 3,OFREaUENCY
9urves
VT-G-1-5
Fig.8{b)
4,e so
ae
T.e so s,o[H:)
in
NS
Direction
,
FREQUENCY
tH,)Resonance
Curves
in
EW
Direction;
Test
VT-G-1-5
UtuutzHoo-rhi-J<crDP<z os:a9ewts?z1.1
1.0o.e
O.6
o.4
e.2
o.o before PnlcvT-eo
Fig.9
Change
Fig
10
FORCEDVIBRATrONa:DisplaeementAmp[ftude
attheRootCmm) o.ess on"'sasgett
EW-lstttt.ttttttttttttttttaao..J-ii' a=1.09L'.iiJl.X--
Torsion---N-2ndttttttttttttttt-..-
---J---E-W:in-d`t:tttttttt;1--ttt--.."--t4121.0asq6QLaz atter afterPDT.
FlepalrrvT-G-3}
rvFG-2)of
NaturalPeriods
atter atter N.E. Faiture(VT-G-4)
rvILG-5)
l
VT-G-1-s
hSDIre[tton'
!lOAeeeeforePsedobywTiEfesmo.-'sP
'i
-"-AtberOAomNletOAoOAtlert-r.tt1tttttt..ttt--O-tt''aAcaAstetAMimo-nemor(VT-M)
-oneevlbt=tionTestCvFn
RaT.(VT.1)(VT-1} RepabttT-3)NE.rvT-4)FaihiecvFs)PblesPD) -oReeMbeaimby OFbrcedMha1thTesttvT-G)Relationship
Amplitude
;
abl Qe5al DtSPLACEMENT ofTest
as l s lo so loo soo AMPuTvDE ATTHERcoF
6Cmm}
Natural
Period
VS.
Displacement
VT-1-5
rnodulus of elasticity
derived
from
the
concrete cylindertests
was usedin
the
analysis,however,
the
difference
was reducedto
9
percent.
5.2
Change
of
Natural
Periods
Throughout
Forced
Vibration
Tests
The
comparison
among
resonance
curves
in
the
NS
and
EW
direction$
procured
from
eachforced
vibrationtest
(VT-G-1-5)
are
shownin
Fig.8.
Figure
9
representsthe
change of naturaiperiods
throughout
altVT-G
tests.
In
the
NS
direction,
the
fundamental
naturalperiod
derived
from
the
test
VT-G-2
increased
by
2.
1
times
from
that
of
the
test
VT-G-1.
The
change ofthe
second naturalperiod
showed
asimilar
tendency.
The
ratio ofthe
fundamental
to
second
naturalperiod
wasO.256
in
test
VT-G-1
anddecreased
to
O,
220
in
test
VT-G-2.
5.3
Relationship
of
NaturaL
Period
VS,
Displacement
Amplitude
The
relationshipbetween
the
fundamental
naturalperiod
andthe
displacement
amplitude of vibration atthe
rooflevel
in
the
NS
direction
is
shown
in
Fig.10.
This
figure
includes
the
resultsof
the
free
vibrationby
the
pseudo-dynamic
tests
(SPD)
which are continuouslyperformed
just
after eachSPD
seismictest.
An
increase
in
the
fundamental
naturalperiod
was associatedgradually
withthe
increase
ofthe
responsedisplacement
except
for
the
first
vibrationtest
VTI.
In
the
test
VTI,
the
naturalperiod
was almost constant withinthe
rangeef
displacement
amp]itude of
1
millimeter:In
the
test
VT2,
the
fundamental
naturalperiods
derived
from
the
ffee
andforced
vibrationtests
(VT-F
andVT-G)
werelonger
by
7
to
16
percent
andby
11
to
21
percent
respectively,than
those
obtainedfrom
the
micretremor measurements(VT-M),
5.4
Change
of
Mode
Shapes
The
translational
mode shapesin
the
NS
andEW
directions
are summarizedin
Fig,
11.
In
the
first
mede ofthe
NS
direction,
the
ratiodf
the
displacement
amplitude atthe
2nd
th[ough
7th
flooi
level
to
that
at
the
rooflevel
increased
in
the
test
VT-G-2,
in
comparisonto
the
Tatioin
the
test
VT-G-1.
These
phenQmena
maybe
causedby
the
damage
of
the
structure
at
the
lower
stories.
In
the
EW
direction,
the
first
and second mode shapesdid
not change as much as-36-'
RF7F6F5F`31N5-lst
MOOE
Fig.11(a)
Change
ofDirection;
'RF765`3
2FEW-lst
MODE
Fig.11(b}
Change
efDirection;
uPs+ Do Betore.PDT,--
paFG-1) AtterRD,T.""'
Att"rRe℃
/P-2)1:
A"t',t.",',"ierl&1 3j rvFG-5] NS-2ndMODE
Translational
Mode
Shapes
Test
VT-G-lh5'
EW-2nd
MODE
Translational,
Mode
firest
VT-G-1-s
in
NS
Shapes
in
EW
O.049
Qe3kcre o.o2zttE( QOIa NSDtrectlon DDD'x oBeimeRD.T.rvT-F-1) eAtterRD.T,CVT-F2) aNterRepair(VT-F-3) oAfteroPfF:4) xAtterFailure oooXtsAea A(vv")
aosO.1DISPLACEMENT
Fig.13
Retationship
ofAmplitude;
Test
1
$
va
100l
;
2
sots
za
v
t
5
BetoreNtcr・ Atter Atter Afler PD.T, MT, Repair ME. FaiLure
rvT-el}rvT-G-VNFV3)Cvr-ouorTe5)
Fig,14
Equivalent
Stiffness
of aSDOF
o.s
1.e
Ee'lo.o
(mm)
AMPLITUDE
AT
THE
ROOF1
Darnping
Ratio
VS.
DisplacemFnt
VT-F-1-5
''''''''''
Systern
-eelertPD.T.
----A"-rRDJ.
L
:'
2::
reef'r
-・・-
MterFeilure(vT-G-1)rvT-evCVT-G-3)CVFG.4)(yT.G-5)tp
VERJICAL DISPLACEMENJ txlOmm)
di
6
de
VERTICALb[SPLACEMEHT(NIO'tpmmnJ w 123a VT-GTIo,roo12SO'-1,!co-asfio vT.G-2-eosoOSIO-aseo-aeLo VT-G-3-O,IW1.Sco-lkaoo,oce VT.G-L-aoeoafi4o-e,76o-aonD vT-G-S-2.4ooltSM-etoo-aloo A c LelL57telzsusua O,7TO.90O,S3a,10ZllFig.12Vertical
Mode
Shapes
ofthe
Resenance
;Test
VT-G-]-5Roof
at
Translational
7F6f5F.4F3F2FIF
ii\Ii4.:tv,
・m
L: :.,ti'g.
}
,
x]
O-eBetorePD.T.(VT-G-1) ---eAtterPbT.CVILG-2)
Ar'"AtterRepeirCVILG-])
-・OAfterN.E.
{VT-G-4)
.--xAfterFailureCVT-G-,
k
''\kx・
'ts
Fig.15
soo
iooe i5oo 2Pt92.)
EQUIVALENT
SroRY
STIFFNESS
Equivalent
Story
Stiffness
Obtained
from
VT-G
Test
those
in
the
NS
direction
did.
Figure
12
shows
the
comparisonamong
the
vertical modesh,apes
at
the
roof
level
resonating
at
the
fundamental
naturalfrequency
in'
the
NS
andEW
directions,
In
the
NS
direction,
the
verticalmotion
of
the
roof wassignificantly
dominated
by
the
rotational component ofdisplacements
associated withflexural
deformation
ofthe
shear wallthroughout
allforced
vibrationtests.
s.s
Relationship
ofDamping
Ratlo
VS.
Displacement
Amplitude
t
t
The
relationshipbetween
the
damping
ratio and maxirnumdisplacement
amplitude of vibration atthe
rooflevel
in
'
'the
NS
direction,
obtainedifrom
free
vibrationtests
VT-F-1
through
VT-F-5,
is
shownin
Fig.
13.
An
increase
in
the
damping
ratio was associateclgradually
withthe
increase
ofthe
displacement
amplitucle exceptfo[
the
first
test
VT-F-1.
This
increase
may result mainlyfrom
the
increase
of
hysteretic
dam'ping.
5.6
Equivalent
Stiffness
'
'
'
Any
structureof
arbitrary
form
is
ableto
be
treated
as asingle-degree-of-freedom
(SDOF)
system
if
it
is
assumed
that
its
disp!acements
are restrictedto
a single mode shape3]・6)・iO),The
equivalent stiffnessof
an equivalentSDOF
systemis,
therefore,
derived
from
the
fundamental
translational
naturalfrequency
andfirst
mode shapeS)・').The
-37-equivalent
stiffnessin
the
NS
direction,
derived
from
forced
vibrationtests
VT-G-1
through
VT-G-5,
is
shownin
Fig.
14.
The
change of equiyalent stiffness, as a matter of course, corresponds wellto
that
offundamental
naturalperiods.
The
equivalent story stiffnessin
NS
direetion5)
is
shownin
Fig,15.
This
stiffness wasderived
from
the
fundamental
naturalf[equency
andfirst
mode shape which were obtainedfrom
allVT-G
tests.
The
distribution
of
story stiffness along
the
height
ofthe
structure wasa
triangular
shapein
the
test
VT-G-1,
whilethat
ofthe
damaged
structure was changed
te
a nearly uniform shapein
the
test
VT-G-2.
6.
Inelastic
Dynamic
Response
Analysis
6.1
Analytical
Procedure
Inelastic
dynamic
response analyses wereperformed
with use of alumped
mass model consideringthe
dynamic
effects of strain rate and stress relaxationi6)during
the
phase
I
pseudo-dynamic
test
SPD32)・3]・6)・iS).
This
analytical methodis
described
in
detail
in
Ref.
17.
Now
it
willbe
convenientto
assumethat
the
loading
velocity remains constantduring
eachloading
step underpseudo-dynamic
testing
conditions.Evaluating
the
basic
equation ofthe
Maxweli
visco-elastic modelleads
to
the
following
equationfor
the
restoringfoTce
atthe
end ofthe
i-th
loading
step
:
Q,=e+'X`=ISA"dt
・Q,-,+
v}-,.n
(1-e"""li'!"d'
)・・-・-・--・・----・-・-・-・・-・--・"",,,""""----",-...,.(
O
where
Q,,
Q,-,:applied
loads
atthe
end ofthe
i-th
and(i-1)-th
ioading
step, respectively,in
ton
K,T,:tangept
stiffness atthe
end ofthe
(i-1)-th
loading
stepin
tonlcm
v:coefficient
of vi$cosityin
ton・seclcm
VIL,
:
loading
velocityduring
the
(i-1)-th
loading
stepin
cmlsecAt,:time
taken
for
the
i-
th
loading
stepin
secLetus
considerthat
the
displacement
is
kept
constant.The
loading
velocitybecomes
zero andthe
viscous coefficientn
canbe
obtaineddirectly
from
Eq.1
by
use ofthe
pseudo-dynamic
test
results:K,T,・At,
n==daQ,.,-zaQ,'''''''''''''''''''''''''"''''''''''''''H''H'''''''''''''''''''H''''''''''''''''''''H''''''''''H'''''''・・-・・(2)
In
the
dynamic
analysis andthe
pseudo-dynamic
test,
the
seven-storyRIC
test
structure was Teducedto
the
equivalent
luniped
SDOF
system.
The
restoringforce
characteristics
of
the
SDOF
system
wasassurned
to
be
the
modified
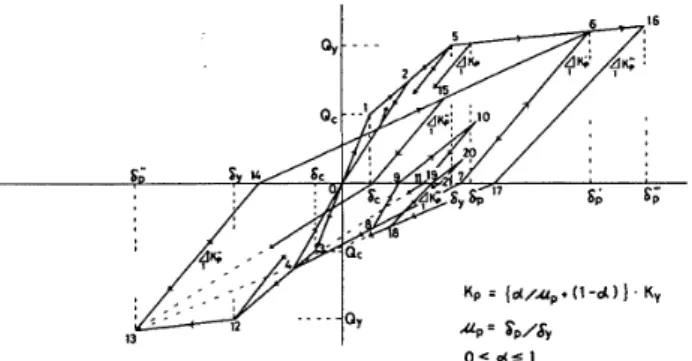
D-Tri-linear
model,The
hysteresis
rules are shownin
Fig,
16,
whereK,
and6b
arethe
unloadingstiffness
and
the
maximumdisplacement
in
the
hysteresis
loop,
respectiyely.This
modelfollows
the
rulethat
the
force-displacement
relation always unloaclsin
the
direction
ofthe
origin unlessthe
maximumdisplacement
exceedsthe
yield
point.
If
the
maximumdisplacement
is
in
excess ofthe
yield
point,
the
unloadi'ng stiffnessis
decreased
as1<..
The
stiffness and strength ofthe
system weredetermined
from
the
pseudo-dynamic
test
SPD3
results,The
characteristics ofthe
piece-wise
linear
primary
(backbone)
curve arelisted
in
Table
6.
The
input
excitation wasthe
modified
(filtered)
Taft
1952
EW
component record which was adoptedin
the
test
SPD3.
,The
first
10
seconds ofthis
record, with apeak
aeceleration of320
gal,
were used.For
the
computerprogram,
the
integration
methodbased
ona
constant
acceleration
withinthe
time
interval,
the
central
difference
method, was adopted.All
ofthe
analyses wereperformed
witha
e.Ol
seconcl
time
interval
assuming
that
tlje
criticaldamping
ratio was zero.Table
6
PrimaTy
CuTve
CharacteTistics
ofthe
Equivalent
SDOF
System
-Note
:
(
)
indicetes thecherecteristic ve]ues of theequivalent SDOF system.
Gts
qtttr,s,z-z-'l
e1zS'1I' s,tt attt/zslIle''
'1/':
/
ro''
//t'
5t
gst'':
:
/iSE'CSvos17S6sJ : /'''''
''
/pt...`'a[''
i'tttt'...:'t/ttttop
Kp:[otluptCl-a)}.KT 3 12 xt.=Sp-Sv e{aslFig.16
Hysteresis
Rules
ofModified
D-Trilinear
Model
-38--20Esd'te
-20
reST-3 2 tualsue2tfo""RFimptacrmertma:tianabb EythE ipEt: 2eto SDD4DO3oe2eD100Fig.17
4 6 e n fimeCset
)Displacement
andTime
Test
SPD3
-leo-2ao-300--oo-500
-30
-20
-]Oo
TotalHistorySheaf
VS.
Roof'
;
Pseudo-Dynamic
le o2Psp [cM?O6,2
Response
of,the
Test
Structure
Subjected
to
aFiltered
The
dynamic
response
analysis
wascarried
out
w'ithoutthe
effects
of strain rateand
18
showthe
results, sllch asthe
total
shearforce
vs. roofdisplacement
accompanied withth'e
time
history
ofdisplacement,
obtained
from
the
pseudo-dynamic
test
SPD3
The
clynamic
analysis wasdone
withthe
effects of strain rate and stresstelaxation.
obtained
from
the
resultsin
the
test
SPD3
with use6f
Eq.
ge;2g8EbllksiU
too so ooo
o
£ -ooExperlrr)enteL
Date
Notme1Distribetien 02468 VISCOUSCOEFF]CIENT
Cumulative
Frequency
Viscous
Coefficient
10 1214
xl1(t・sectcm)
Distribution
of a,
i::;
2 , s eVD
T[ME ISEC]Fig18
Total
Shear
VS..Reof
Displacement
andTime
History;
Analysis
ofTest
S?D3
withoutDynamic
Effects
Motion
and stress ielaxation.
Figures
17
roof
and
the
analysis, respectively,The
viscouscoefficient
o
wqs2.
The
data
werecoliected
from
two
successiveloading
'
tt
'
l
:[
g
ElEnr:b-10e m-10-10-/-l-]-I.s
Fig,19
:t:!#
:
sol:moi SeoM 300 100o-/DD
-200-aDo.4DD-seo
?o!ILDTL],
4'
L
!t-la-tea;pIG3OISPCCH/Fmb--pmwhVAMAeeof
Fig.20(b)
!E:i !EEtii-2010 D-IS-20-Total
Shear
VS.
Roof
History
;Analysis
witho=2000e
ton・seclcrn
[.oe400:oo200100-100-200-300T4ao-soo-30
10T]"E [SECI
Disp!acement
andDynamic
Effects
-20
-LO
OA
lo 20 la DISPfCHIsl・
Tirne
.,ll
.ol
Fig.20(a)Total
Shear
VS.
Reof
History
;Analysis
withn=10000
ton・seclcm
Tln[ tSE[/
Displacement
andTime
Dynamlc
Effects
Fig.20(c)'
2
'
Total.Sheai
VS.
Roof
History
;
Analysis
withv=40000
ton・seclcm
6V "a 10J[ME
JsEETDisplacement
andDynamic
EffectsTime
-39--
sea:
looC
?eo:
iSD-1[D
I;:
Il:
i:iol
3o-?a
-]oDla
2o so DISP[tli] iA
i
2 6 D-10
-20
1 1[HE ISE[]Fig,20<d)
Total
Shear
VS.
Roof
Displacement
andTime
History
;
Analysls
withDynamic
Effects
v==50000
toa ・ seclcrnsteps
wherethe
responsedisplacement
wasidentical.
initialelasticstiffness.
in
Fig.
19.
Therefore,
this
coefficienttook
the
assumed
in
the
analysis asfollows:in
the
pseudo-10
seconds
withthe
loading
velocityof
O.
2
cmlsec,
seconds at each
loading
step.This
assumption wasFigures
20
(a)-(e)
history
of
roofdisplacement.
The
additional
proportional
damping
andthe
viscous coe Wareshown
in
Figs.
21
(a)
and
(b).
6.3
Discussion
ofAnalytical
Results
A
surnmary ofthe
resultsis
shownbelow,
1)
The
analytical results are very muchin
2)
Figure
22
showsthe
reviscous coefficient
n.
These
results are expressedanalysis without
dynamic
effects{
o=::
oo).
while
the
maximumdisplacement
increased
withit.
result of Toughly estimating
the
frequency
-
sog
4o:
sofi
2ei
.10
tto
-20
-:o
-40
-so
-so
-2o
-lo
e lo 2o 3oOISP[[fi) i 20 y
za
leE
o 2 6 e lOI):+
TItiE ISEC]Fig.21(a)
Total
SheaT
VS
Reef
Displacement
andTime
History;
Analysis
withDynamic
Effects
andDamping
o=50eOO
ton
・
sec/cmh=::2%
-
40
l
io : ! ioe
o -e-2a
Fig.20(e)
seg・: -a;t ]aum 10 ]a-!o'-pe-le
-o.sO '/
e 10In
this
procedure,
The
obtained viscous coefficientsgenerally
variedfrom
20000
to
80000
ton
values Qf
10000,
dynamic
tests
the
actuators movedby
commanddisplacernents
and
successivelythey
helcl
the
displacemellts
asth
introduced
show
the
analytical
results
which
are
the
total
shear
force
vs.
analyses
fficient
o
of50000
here
the
damping
ratioof
2%
wasthe
valueobtained
from
the
forced
TIHE tSEM
Total
Sheai
VS.
Reof
Displacement
andTime
History
;
Analysis
withDynamic
Effects
e=60000
ton・seclcm
the
stiffness wasassumed
to
remainas
the
. seclcm as shown
20000,
40000,
50000
and60000
in
the
analysis,It
was
in
ey were
for
50
on
the
basis
ofpseudo-dynamic
test
conditions.
roof
displacement
and
the
time
were
performed
whichassumed
the
tangent
stiffness.
The
introduced
criticaldamping
ratio was2%
and
5%,
vibration
tests
(VT-G).
The
analytical resultsagreement with
the
experiment
as
shown
in
Figs.
17
and
18.
Iationship
ofthe
yield
strength
Q.
andlorthe
maximum roofdisplacement
ab
versusthe
in
values relativeto
the
standard which was obtainedfrom
the
The
yield
strengthdecreased
withthe
increase
ofthe
visceus coefficientThe
viscous coefficient was expectedto
be
about50000
as adistribution
as shownin
Fig.
19.
Therefore,
the
yield
strength andthe
-
soog
Aoo2'
3ooi
200 th 10D-IOO
-!oo
-300
-ioo
-soo
-:o
-20
-]O
O tO ?O !O DISP[CH]g.
2o±
10e o
-:0
-20
Fig.
21
(b)
2Total
Shear
VS.
History;
Analysis
Damping
o=50000
s e tg Tl"E [SEC]Roof
Displacement
andTime
with
Dynamic
Effects
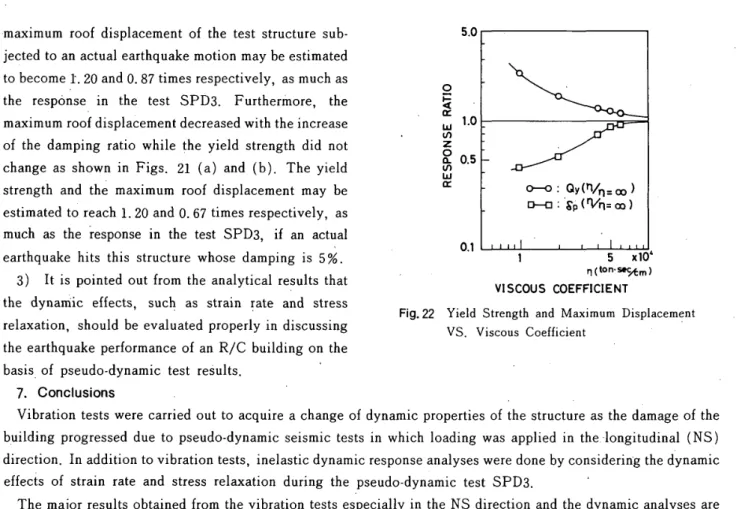
and-maximum
roofdisplacement
of
the
test
structuresub-jectecl
to
an actual eaithquake motion maybe
estimatedto
become
l.
20
andO.
87
times
respectively, as much asthe
resp6fisein
the
test
SPD3.
Furtherfriore,
the
maximum rooi
displacement
decreased
withthe
increase
of
the
damping
ratio whilethe
yield
strengthdid
not change as shownin
Figs.
21
(a)
and(b).
The
yield
strength andthe
maximum roofdispLacement
maybe
estimatedt6
reach1.2o
ando.
67
times
respectively, as much asthe
responsein
the
test
SPD3,
if
an actyalearthquake
hits
this
structuie whosedamping
is
5%.
3)
It
is
pointed
outfrom
the
analytical reFultsthat
the
dynaTTiic
effect$, such as stTain;ate
and stress relaxation, shouldbe
evaluatedproperly
in
discussing
the
earthquakeperformance
of anRIC
building
onthe
'
basis
ofpseudo-dynamic
test
reSults.7.
Conclusions
Vibration
tests
were carried outto
acquire a changebuilcling
progressed
due
to
pseudo-dynamic
seismicdirection
In
additionto
vibrationtests
t
)
effects of strain rate and stress relaxation
during
the
The
major results obtainedfrom
the
visummarized as
follows
:
1)
Before
the
phaseI
pseudo-dynamic
tests,
that
is
microtremor measurement,
the
free
andforced
vito
the
translational
naturalperiods
in
the
NS
2)
Ac
¢ordingto
the
free
and
forced
vibration
tests,
in
the
NS
direction
asthe
damage
ofthe
buildin
the
NS
direction,
the
fundamental
naturalperio
phase
I
tests,
the
naturalperiod
changedto
O,
80-O.
91
initial
elastic range,3)
.In
the
fundarpental
naturalperiod
in
the
NS
vibrational
displacement
exceptfor
the
initial
elasticperiods
were alrnost constant withinthe
range ofthe
4)that
at
the
roofincreased
atthe
iower
floors
asthe
5)
The
damping
ratioin
the
NS
direction
increased
initial
elastic range..,
6>
The
distribution
initial
elastic range, whilethat
ofthe
damaged
7)
It
was shownfrom
the
results ofthe
that
the
yield
strengthdecreased
withthe
increase
ofincreased
withit.
Consequently,
it
is
important
that
accuratelyin
discussing
earthquakeperformance,
of andesirable
to
continuefurther
study onthis
subject.'
Acknowledgements
'
The
authors wishto
expresstheir
gratitude
to
(Co-chairman
;
Profs.
H.
Umemura
and.J.Penzien),
Fig.
22
or<cruutzoiuthlor5.0
1.0
O.5
O.1
Yieldvs.
1
5
xlO` n{ton・sestm)VISCOUS
coEFFSCIENT
Strength
andMaximum
Displacemgnt
Viscous
Coefficient
'
of
dynamic
properties
ofthe
structure asthe
damage
ofthe
tests
in
whichloading
was appliedin
the
・longitudinal
(NS)
inelastic
dynamic
response analyses weredone
by
consideTingthe
dynamic
.pseudo-dynamic
test
SPD3.
'
bration
test$
especiallyin
the
NS
direction
andthe
dynamic
analyses are,
in
the
initial
elastic
range,the
corre.lation
among
the
bration
tests,
andthe
earthquake record was excellent with respect
direction.
'
the
fundamental
natural
period
of
the
structure variedgreatly
g
progressed,
whereasit
did
not very muchin
the
EW
direction.
In
ds
wasO.
43
sec.before
the
phase
I
pseudo-dynamic
tests.
After
the
sec.
which was anincrease
oili9-2.1
times
that
in
the
direction,
anincrease
occurredgradually
withthe
increase
ofrange.
In
the
inital
elastic range,the
fundamental
naturaldisplacement
amplitude o{I
ipillimeter atthe
Toofleve!.
In
the
translationql
mode shapes ofthe
NS
direction,
the
ratio ofthe
displacemgnt
amplitude at eachfloor
to
damage
of
the
structuredeveloped.
'
with
the
increase
of
responsedisplacement
exceptfor
the
of equivalent story stiffness along
the
height
ofthe
structure was atriangular
shapein
the
structure was changed
to
a nearly uniform shape.'
dynamic
response analyses with and without censideringdynamic
effectsthe
viscous coefficient whilethe
maximumdisplacement
the
dynamic
restoringforce
characteristics are evaluatedR/C
building
from
adynamic
response analysis.It
is
members of
the
Joint
Technical
Coordinating
Committee
who encouraged
the
authors and cordiallygave
advice, and-41-members