1. Introduction
The oceanic abyssal circulation is one of the most important parts of the global climate sys-tem, which transports cold deep water in a high-latitude region to low-high-latitude areas. During the course of this circulation, cold water gradually upwells and eventually returns to the
high-latitude region by the surface currents. There-fore, abyssal circulation bears the lower part of the meridional overturning or thermohaline cir-culation(TALLEYet al., 2011).
The first dynamic model of the global abyssal circulation was presented by STOMMEL(1958) and STOMMELand ARONS(1960a, b).Their basic concept of the global abyssal circulation(here-after, the SA-type circulation)is as follows: the volume of cold water sunken in the high-latitude regions(the northern North Atlantic and the Antarctic)is compensated by the upwelling over the world ocean. The vertical velocity(w, positive upward)accompanied by the upwelling induces positive(negative)relative vorticity through stretching of water column( w / z, where is the planetary vorticity)in the north-Société franco-japonaise dʼocéanographie, Tokyo
A note on the abyssal circulation in the Japan Sea:
suggestion from rotating-tank experiments
Tomoharu SENJYU1)and Jiro YOSHIDA2)
Abstract: In this study, we revisited the rotating-tank experiments reported by FALLER(1960)
and SENJYU(1988)and qualitatively discussed the abyssal circulation in the Japan Sea by
focus-ing on the geometric similarity of their partial barrier experiments. A point source of water near the apex of the pie-shaped rotating-tank formed the so called STOMMEL-ARONStype circulation
pattern. The circulation in the partial barrier experiments basically consisted of a cyclonic circu-lation and a western boundary current in the southern two basins separated by a partial barrier extending from the rim. Recent observations on direct current in the abyssal Japan Sea have re-vealed a cyclonic circulation and strong currents near the western boundary in the southern two basins: the Yamato and Tsushima Basins. These similarities suggest the STOMMEL-ARONS
type circulation in the abyssal Japan Sea, though the complex bottom topography and eddy ac-tivity are likely to modify the basic circulation pattern significantly.
Keywords : Rotating-tank experiment, deep circulation, deep western boundary current, direct current observation
1)Division of Earth Environment Dynamics, Re-search Institute for Applied Mechanics, Kyushu University
6Ȃ1 Kasuga-Koen, Kasuga City, Fukuoka 816Ȃ 8580, Japan
E-mail: [email protected]
2)Tokyo University of Marine Science and Technol-ogy
4Ȃ5Ȃ7 Konan, Minato, Tokyo 108Ȃ8477, Japan E-mail: [email protected]
1)Institute of Marine Science, Burapha University, Bangsaen, Chon Buri 20131, Thailand
2)Department of Aquatic Science, Faculty of Sci-ence, Burapha University, Bangsaen, Chon Buri 20131, Thailand
3)Atmosphere and Ocean Research Institute, The
University of Tokyo, 5Ȃ1Ȃ5, Kashiwanoha, Kashi-wa, Chiba 277Ȃ8564, Japan
*Corresponding author: Thidarat Noiraksar Tel: + 66(0)38 391671
Fax: + 66(0)38 391674
ern(southern)hemisphere. Since, in the steady state, the relative vorticity must be balanced by the advection of planetary vorticity( , where and denote meridional derivation of ( / ) and meridional geostrophic velocity positive northward, respectively)to conserve potential vorticity, poleward flow appears over the interi-or region of each oceanic basin. To satisfy the condition of continuity, a western boundary cur-rent(WBC)is introduced toward low latitude in each basin. The basic characteristics of the SA-type circulation in the oceans, such as the deep WBC, have been validated by many researchers by using chemical tracers and neutral drifters (e.g., BROECKER and PENG, 1982; SWALLOW and
WORTHINGTON, 1961).
The concept of the SA-type circulation was in-itiated from a rotating-tank experiment with a point source of water(STOMMELet al., 1958).Be-cause this experiment was very simple, addition-al experiments were performed to examine sev-eral conditions appearing in the real ocean, for example lateral boundary(FALLER, 1960; SENJYU 1988),bottom topography(WELANDER, 1969; KUO and VERONIS, 1971), and nonlinear effects (VERONIS and YANG, 1972).In this study, we re-visit the partial barrier experiments by FALLER (1960)and SENJYU(1988)and discuss the deep circulation in the Japan Sea by referring to the results of the rotating-tank experiments.
The Japan Sea has its own thermohaline circu-lation system with the formation of deep and bottom waters(hereafter, the Japan Sea Proper Water)which were surface water sunken in the northwestern part of the sea, south of Vladivos-tok(Fig. 1)(GAMOand HORIBE, 1983; SUDO, 1986; SENJYU and SUDO, 1993 & 1994; SENJYU et al., 2002). In addition, the Japan Sea has southern and northern surface circulations with a WBC (the East Korean Current in the south and the Liman Current in the north)bounded by a
arctic front, similar to the subtropical and sub-arctic gyres in the Pacific and Atlantic oceans. This indicates that the planetary -effect is sub-stantially important for basin-scale circulation in the sea. These conditions make us expect the SA-type circulation in the abyssal Japan Sea. Furthermore, the bottom topography of the Ja-pan Sea(Fig. 1)is similar to the geometry of the partial barrier experiment(Fig. 2); a northern basin N corresponds to the Japan Basin, and two southern basins SW and SE correspond to the Yamato and Tsushima Basins, respectively. These two basins are bounded by a shallow ridge extending from the Oki Islands to the Ya-mato Rise(the Oki Spur),as well as its closed configuration.
In the next section, we describe the principle and method involved in the rotating-tank ments referring to results of the test experi-ments of the SA-type circulation. Section 3 intro-duces some results of the partial barrier experi-ments by SENJYU(1988)weighted on the change of flow pattern when the length and angle of the partial barrier were varied. Section 4 provides a qualitative discussion about the Japan Sea deep circulation using the analogy of the partial barri-er expbarri-eriments. Finally, Section 5 presents con-cluding remarks.
2. Test experiments of the SA-type circulation Prior to the partial barrier experiments, SENJYU(1988)performed a series of test experi-ments of the STOMMEL et al.ʼ s(1958)SA-type circulation. In this section, the principle and method of the experiments are explained refer-ring to the results of the test experiment.
A pie-shaped tank(Fig. 2, but without the partial barrier)containing water was set on a turntable and was rotated anticlockwise with re-spect to the vertical axis at a constant angular velocity( ).Since the spin-up time scale ts=(h2
/ )1/2was estimated to be about 100 s using
the water depth h~O(10 cm), viscosity ~O (10−2cm2s−1),and ~O(1 rad s−1),each
ex-periment was started after an hour rotation (rigid-body rotation).
After achieving the rigid-body rotation state, a small volume of dyed water was constantly in-jected into the tank from a point source near the apex of the sector(SO),which corresponds to a
narrow source region of the deep water in the real ocean. For the dyeing of water, a small vol-ume of brilliant-blue was used. To minimize the density difference between waters in the tank and for the injection, the waters were put in the same environment at least 12Ȃh long before each
experiment. At last, the smallness of the density difference was confirmed by vertical rigidity of the injected water during the experiments, that is, whether the injected water forms a TAYLORʼs ink wall or not(e.g., Long, 1954).
The outlet of the dyed water was set at 1.0Ȃ1.5 cm below the water surface under the Ekman layer; the thickness of the Ekman layer is E=
( / 2 )1/2~O(10−1cm),if we adopt the above
values of and . In addition, the tank was cov-ered with a clear acrylic lid to escape air stress on the water surface. The flow pattern in the tank visualized by the dyed injected water was recorded by a camera installed on the turntable. The water level before the start of rotation
Fig. 1 Bottom topography of the Japan Sea. JB, YB, TB, YR, and OS denote the Japan Basin, Yamato Basin, Tsushima Basin, Yamato Rise, and Oki Spur, respectively.
was set at 8.3 cm. However, the free surface of water during the experiments is a paraboloidal shape, with a minimum at the apex and a maxi-mum at the rim, because of the balance of pres-sure gradient and centrifugal force. The planeta-ry -effect is approximately simulated by the radial variation of the water depth( ≈−2 (dh / dr) / h0, where r denotes the radial distance
from the rotating axis and h0is the water depth
at r = 0).Hence, the apex side(rim side)of the tank corresponds to the north(south)in the re-al ocean, and thus, we use the words “north”, “south”, “east”, “west”, and so on to show the di-rection.
Since there is no sink of water in the tank, the water surface slowly rises with time in the ex-periments, which simulates the upwelling in the interior region of the real ocean, although STOMMEL and ARONS(1960a, b)assumed the
steady state condition. This temporal change of the water level influences the planetary -effect via the relation ≈Ȃ2 (dh / dr)/ h0(t),now h0
is a function of time t. The injection rate of water was set at about 1.0 cm3s−1, and the duration of
an experiment was about 30 min. Therefore, the volume of injected water at the end of the ex-periment reached 1800 cm3. Since the area of the
tank is 1025.2 cm2, the difference of water level
before and after the experiment was about 1.8 cm. This corresponds 23% of the initial water depth at the rotating axis(h0(0)=7. 8 cm).
Therefore, we should keep on mind the fact that the -effect was reducing by about 20% during the experiment.
Figure 3 shows time sequence of a test experi-ment. A clockwise eddy near the point source grew gradually(Fig. 3a-b), then a narrow and fast flow along the western boundary(the WBC) appeared from the eddy(Fig. 3c-d). The dyed water flowed eastward along the southern boun-dary accompanying a wide but sluggish north-ward flow(the interior flow)after arriving at the rim(Fig. 3e-g), finally a westward intensi-fied cyclonic gyre(the SA-type circulation)was confirmed(Fig. 3h).
STOMMEL et al.(1958)set the ROSSBY number Ro= V /(2R )(V is the representative speed of
the WBC and R is the distance from the rotating axis to the rim of the tank, 45 cm)to be O(10−3),
the same order of magnitude as that for the Gulf Stream system. However, SENJYU (1988)adjust-ed Ro~O(10−2)due to the limit of the
experi-mental equipment. The speed of the WBC tend-ed to increase with increasing angular velocity ( )and increasing injection rate(SO).
There-fore, SENJYU(1988)carefully checked the speed of the WBC in the test experiments and deter-mined the ranges of and SOfor the partial
bar-rier experiments in the next section.
Fig. 2 Dimension of the experiment tank. N, SW, and SE indicate three basins separated by a par-tial barrier of length b and angle from the west-ern boundary. SOis a point source of water. The tank is rotating anticlockwise at an angular veloc-ity with respect to the vertical axis.
3. Partial barrier experiments
For the partial barrier experiments, a meri-dional(radial)barrier extending from the rim(a
flat acrylic board of 4 mm thickness)was at-tached in the tank in order to divide the sector into three basins: N, SW, and SE(Fig. 2).The
Fig. 3 Results of a test experiment for the SA-type circulation(SO= 1.5 cm3 s−1, = 0.79 rad s−1).The photos show the distribution of dyed water at (a)44 s(0.73 min),(b)259 s(4.32 min),(c)514 s(8.67 min),(d)729 s (12.15 min),(e)944 s(15.73 min),(f)1159 s(19.32 min),(g)1414 s(23.57
experimental parameters were length of the bar-rier(b)(we use a non-dimensional length scale B which is the barrier length normalized by the radial extent of the tank, 36 cm)and angle of the barrier from the western boundary( ),as well as injection rate of water at the point source(SO)
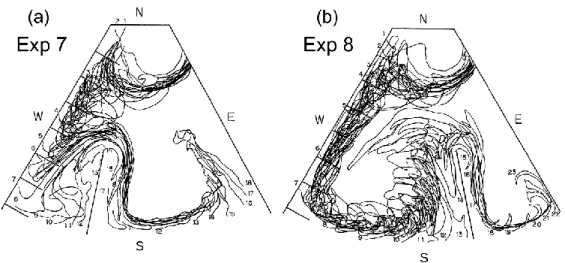
and angular velocity( )(Table 1). Basically, the changes of injection rate(Exps 1Ȃ4)and an-gular velocity(Exps 3 and 9Ȃ10)did not change the pattern of circulation. On the contrary, signif-icant changes in flow pattern were observed de-pending on the length(Exps 3, 5Ȃ6)and the an-gle of the meridional barrier(Exps 3, and 7Ȃ8). Therefore, we show the results of Exps 3 and 5Ȃ8 below because our interest is how the SA-type circulation pattern in the previous section was modified by the partial barrier.
Firstly, the results of Exp 3(the reference ex-periment)are shown in Fig. 4 using streak lines of the dyed injected water. In the first stage, the injected water formed a clockwise eddy of 12Ȃ15 cm diameter near the point source(1Ȃ3 min af-ter the injection).Then, a narrow and fast flow along the western boundary appeared(4Ȃ5 min). We call this flow the WBC-N as this is the WBC in the N-basin. The WBC-N flowed into the SW-basin along the western boundary as the WBC-SW(6Ȃ7 min).The dyed water flowed eastward along the southern boundary accompanying
northward flow component after arriving at the rim(8Ȃ16 min). The northward interior flow was wider but much slower than the WBC-SW. At this time, a westward intensified cyclonic gyre was confirmed in the SW-basin. Part of the northward flow turned to the east at the tip of the meridional barrier, then flowed into the SE-basin forming a WBC(the WBC-SE)(17Ȃ20 min). The water arrived at the rim in the SE-basin flowed along the southern boundary accompany-ing weak northward component, showaccompany-ing a cy-clonic gyre similar to that in the SW-basin(21Ȃ27 min).
A clear cyclonic gyre was formed in both the SW and SE-basins even when the length of the barrier was changed(Figs. 4 and 5).However, in the case of Exp 5, the WBC-SE was signifi-cantly broad and the westward intensification in the SE-basin did not fully develop(Fig. 5a), though a similar westward intensified gyre was formed in the SW and SE-basins in Exps 3 and 6 (Figs. 4 and 5b). This suggests that the short barrier in Exp 5 did not work as a barrier. The circulation pattern possibly approaches the SA-type circulation in Fig. 3 with decreasing the length of the barrier. Contrary, water of the WBC-SE was directly supplied from the clock-wise eddy at the point source in Exp 6(Fig. 5b) as the tip of the barrier is near the source region.
Table 1. Parameters for the partial barrier experiments
SO(cm3s−1) b(cm) B(= b/36 cm) (°) (rad s−1) Exp 1 0.2 15 0.42 30 0.79 Exp 2 0.5 15 0.42 30 0.79 Exp 3 1.0 15 0.42 30 0.79 Exp 4 1.5 15 0.42 30 0.79 Exp 5 1.0 10 0.28 30 0.79 Exp 6 1.0 20 0.56 30 0.79 Exp 7 1.0 15 0.42 20 0.79 Exp 8 1.0 15 0.42 40 0.79 Exp 9 1.0 15 0.42 30 0.70 Exp 10 1.0 15 0.42 30 0.90
In Exps 3 and 8, clear cyclonic gyre was formed in both the SW and SE-basins(Figs. 4 and 6b). In contrast, the gyre in the SW-basin was obscure in Exp 7, though a cyclonic gyre was found in the SE-basin(Fig. 6a).A reason for the obscure gyre in the SW-basin is that a zonal
flow toward the SE-basin was separated from the WBC-N at 4Ȃ5 min and fed the WBC-SE to-gether with the northward flow in the SW-basin. The volume of southward-flowing WBC equals the sum of the zonally-integrated north-ward interior flow and the volume of upwelling over the basin. Therefore, the volume of WBC-SE is larger than that of WBC-SW in Exp 7. In order to feed the larger volume of WBC-SE, the zonal flow was separated from the WBC-N. How-ever, crossing of the zonal flow with the north-ward internal flows in the SW-basin disturbed the streak of dyed water, which resulted in the obscure gyre pattern in the basin.
4. Discussions
As pointed out earlier, the geometry of the partial barrier experiment is similar to the top-ography of the Japan Sea(Figs. 1 and 2).The N, SW, and SE-basins correspond to the Japan, Tsushima, and Yamato Basins, respectively. The meridional barrier coincides with the Yamato Rise and Oki Spur. In addition, the formation re-gion of the Japan Sea Proper Water located on the northwestern Japan Basin(SENJYUand SUDO, 1993 & 1994; SENJYUet al., 2002)agrees with the
Fig. 4 Flow pattern of Exp 3(the reference ex-periment)visualized by the dyed water. The contours indicate streak of the injected dyed wa-ter every 1 min. Numerals show the elapsed time from the start of the experiment(min).The rul-er on the westrul-ern boundary is graduated at 5 cm.
point source of the N-basin in the experiments. Therefore, if the bottom topography of the Japan Sea were flat, with the simple topography of the Yamato Rise and Oki Spur, similar circulation pattern to the experiments is expected in the abyssal Japan Sea.
Figure 7 shows the mean flow vectors in the abyssal Japan Sea(> 1000 m)from direct cur-rent observations; this is the updated version of Fig. 3b in SENJYUet al.(2005b)adding our new data as well as these of FUKUSHIMA and KOJIMA (2011)and TEAGUE et al.(2005).By comparing with the flow pattern of the partial barrier ex-periments(Figs. 4Ȃ6), we found several com-mon features.
The first is the cyclonic circulation in the southern basins(the Tsushima and Yamato Ba-sins). The cyclonic circulation has been inter-preted as a flow trapped on the slope of the ba-sinʼ s periphery, seeing shallow region on its right-hand side(CHOI and YOON, 2010). In fact, the observed flows tend to follow the contours of ambient potential vorticity(f / H, where H is bottom depth), which indicates that the topo-graphic -effect is more important than the plan-etary -effect.
The second common feature that is interesting is the strong currents along the western boun-dary in the southern basins. We can find strong flows faster than 3 cm s−1along the
southeast-ern flank of the Yamato Rise in the Yamato Ba-sin and the western periphery of the Tsushima Basin east of the Korean Peninsula. These strong flows are likely to be the WBC in each basin, a characteristic feature of the SA-type circulation.
The third common feature is that the water in the SE-basin is older than that in the SW-basin (FALLER, 1960).It has been considered that the Japan Sea Proper Water in the Yamato Basin is the oldest water in the Japan Sea, because it has the lowest concentration of dissolved oxygen in the sea(SUDO, 1986; GAMOet al.; 1986, SENJYUand SUDO, 1993 & 1994; SENJYUet al., 2005a).Howev-er, the reason is probably different from the ex-periments. In the experiments, the WBC-SE was fed by the northward flow in the SW-basin, ex-cept in case of Exp 6(Fig. 5b).While in the Ya-mato Basin, the deep and bottom waters are sup-plied directly from the Japan Basin, similar to Exp 6. It is meaningful that if we normalize the shallow ridge from the Yamato Rise to Oki Spur (about 560 km)by the latitudinal extent of the
Japan Sea (roughly 1000 km), the non-dimensional length(B)is 0.56 as in Exp 6. Nev-ertheless, because of the narrow channel be-tween the Japan and Yamato Basins, the water exchange between the basins is limited(SENJYU et al., 2013, SENJYUet al., 2017),and the water in the Yamato Basin is a modified water that has lower dissolved oxygen concentration due to the closed circulation in the basin(SENJYU et al., 2005a, b).
However, there are many different points be-tween the experiments and observations. For ex-ample, remarkable northward flows in the east-ern Japan Basin cannot be explained by the
SA-type circulation. The basic SA-SA-type circulation is likely to be strongly modified not only by the complex bottom topography, but also by eddy activity(CHOIand YOON, 2010; YOSHIKAWA, 2012). 5 Concluding remarks
We have made a qualitative discussion throughout, focusing on the geometric similarity between the partial barrier experiments and the Japan Sea. There are several common features between the experiments and the observed deep flow field in the sea. The cyclonic circulation and strong currents near the western boundary in the Yamato and Tsushima Basins suggest the
Fig. 7 Distribution of the mean flow vectors in the abyssal Japan Sea(1000 m-bottom)from direct current observations. A vector length of 2.0 cm s−1 is shown in the upper-left corner.
SA-type circulation. However, the complex bot-tom topography and eddy activity are likely to modify the basic SA-type circulation pattern.
The key strategy to confirm the SA-type cir-culation in the Japan Sea is to perform observa-tions of the deep WBC in the Japan Basin. How-ever, it flows in the North Korean territory which is an inaccessible area due to political problems at present. Data analysis of neutral drifters, such as ARGO floats, may be an effec-tive way. In addition, chemical tracer observa-tions are useful in capturing the deep flow pat-tern. Hydrographic observations in a wide area including Russian and Korean territories are de-sired.
Nowadays, studying geophysical fluid dynam-ics with the help of rotating-tank experiments is somewhat out-of-date. However, in general, labo-ratory experiments have an advantage of pro-viding an intuitive understanding of phenomena. Therefore, we believe that laboratory experi-ments including rotating-tank experiexperi-ments are still valuable not only in the field of education but also in heuristic research, even though nu-merical model experiments have highly pro-gressed.
Acknowledgments
This work is a contribution to the JYʼs retire-ment ceremony. TS wishes to thank Emeritus Professors Hideo Sudo and Masaji Matsuyama in Tokyo University of Fisheries(present Tokyo University of Marine Science and Technology) for useful discussion and encouragement in TSʼs master course student days. Part of this study was supported by the Environment Research and Technology Development Fund of Ministry of the Environment, Japan(2Ȃ1604)and JSPS KAKENHI Grant Number 18H03741.
References
BROECKER, W. S. and T.-H. PENG(1982):Tracers in the
Sea. A publication of the Lamont-Doherty Geo-logical Observatory, Colombia University, New York, 690 pp.
CHOI, Y. G. and J.-H. YOON(2010):Structure and
sea-sonal variability of the deep mean circulation of the East Sea(Sea of Japan). J. Oceanogr., 66, 349Ȃ361. doi:10.1007/s10872Ȃ010Ȃ0031Ȃy. FALLER, A. J.(1960):Further examples of stationary
planetary flow patterns in bounded basins. Tel-lus, 12:2, 159Ȃ171.
FUKUSHIMA, S. and T. KOJIMA(2011):Characteristics
of deep current observed near the bottom in the Sea of Japan. Report of Hydrographic and Oce-anographic Researches, Hydrographic and oce-anographic department, Japan Coast Guard, 47, 32Ȃ43.
GAMO, T. and Y. HORIBE(1983):Abyssal circulation in
the Japan Sea. J. Oceanogr. Soc. Japan, 39, 220Ȃ 230.
GAMO, T., Y. NOZAKI, H. SAKAI, T. NAKAI and H.
TSUBOTA(1986):Spatial and temporal variations
of water characteristics in the Japan Sea bottom water. J. Mar, Res., 44, 781Ȃ793.
KUO, H. -H. and G. VERONIS(1971): The source-sink
flow in a rotating system and its oceanic analo-gy. J. Fluid Mech., 45(3),441Ȃ464.
LONG, R. R.(1954):Note on TAYLORʼs “ink walls” in a
rotating fluid. J. Meteor., 11, 247Ȃ249.
SENJYU, T.(1988): Study on abyssal circulation by
rotating-tank experiments. Masterʼ s thesis, To-kyo University of Fisheries, 71 pp.(unpublished manuscript)
SENJYU, T. and H. SUDO(1993):Water characteristics
and circulation of the upper portion of the Japan Sea Proper Water. J. Mar. Sys., 4, 349Ȃ362. SENJYU, T. and H. SUDO(1994):The upper portion of
the Japan Sea Proper Water; its source and cir-culation as deduced from isopycnal analysis. J. Oceanogr., 50, 663Ȃ690.
SENJYU, T., T. ARAMAKI, S. OTOSAKA, O. TOGAWA M.
DANCHENKOV, E. KARASEVand Y. VOLKOV(2002):
Renewal of the bottom water after the winter 2000Ȃ2001 may spin-up the thermohaline
circula-tion in the Japan Sea. Geophys. Res. Lett., 29(7), doi: 10.1029/2001GL014093.
SENJYU, T., Y. ISODA, T. ARAMAKI, S. OTOSAKA, S. FUJIO,
D. YANAGIMOTO, T. SUZUKI, K. KUMA and K. MORI
(2005a): Benthic front and the Yamato Basin Bottom Water in the Japan Sea. J. Oceanogr., 61, 1047Ȃ1058, doi:10.1007/s10872Ȃ006Ȃ0021Ȃ2. SENJYU, T., H. R. SHIN, J.-H. YOON, Z. NAGANO, H. S. AN,
S. K. BYUNand C. K. LEE(2005b):Deep flow field
in the Japan/East Sea as deduced from direct current measurements. Deep-Sea Res. II, 52, 1726Ȃ1741. doi:10.1016/j.dsr2.2003.10.013. SENJYU, T., T. ARAMAKI, S. S. TANAKA, J. ZHANG, Y.
ISODA, Y. KUMAMOTO, S. HIBINO and T. NAKANO
(2013):Abyssal water mass exchange between the Japan and Yamato Basins in the Japan Sea. J. Geophys. Res. Ocean, 118, 4878Ȃ4888, doi: 10. 1002/jgrc.20373.
SENJYU, T. and T. ARAMAKI(2017):Volume transport
from the Japan Basin to the Yamato Basin in the abyssal Japan Sea inferred from direct current observations. J. Oceanogr., 73, 235Ȃ247, doi: 10. 1007/s10872Ȃ016Ȃ0399Ȃ4.
STOMMEL, H.(1958): The abyssal circulation.
Deep-Sea Res., 5, 80Ȃ82.
STOMMEL, H., A. B. ARONS and A. J. FALLER(1958):
Some examples of stationary planetary flow pat-terns in bounded basins. Tellus, 10:2, 179Ȃ187. STOMMEL, H. and A. B. ARONS(1960a):On the abyssal
circulation of the world ocean- I. Stationary plan-etary flow patterns on a sphere. Dee-Sea Res., 6, 140Ȃ154.
STOMMEL, H. and A. B. ARONS(1960b):On the abyssal
circulation of the world ocean- II. An idealized model of the circulation pattern and amplitude in oceanic basins. Deep-Sea Res., 6, 217Ȃ233. SUDO, H.(1986):A note on the Japan Sea Proper
Wa-ter. Prog. Oceanogr., 17, 313Ȃ336.
SWALLOW, J. C. and L. V. WORTHINGTON(1961):An
ob-servation of a deep countercurrent in the west-ern North Atlantic. Deep-Sea Res., 8(1),1Ȃ21. TALLEY, L. D., G. L. PICKARD, W. J. EMERY and J. H.
SWIFT(2011): Descriptive Physical
Oceanogra-phy. An Introduction. Sixth Edition, Elsevier, MA, USA, ISBN: 978Ȃ0Ȃ7506Ȃ4552Ȃ2.
TEAGUE, W. J., K. L. TRACEY, D. R. WATTS, J. W. BOOK,
K. -I. CHANG, P. J. HOGAN, D. A. MITCHELL, M. -S.
SUK, M. WIMBUSH, J. -H. YOON(2005): Observed
deep circulation in the Ulleung Basin. Deep-Sea Res. II, 52, 1802Ȃ1826.
VERONIS, G. and C. C. YANG(1972):Nonlinear
source-sink flow in a rotating pie-shaped basin. J. Fluid Mech., 51(3),513Ȃ527.
WELANDER, P.(1969): Effects of planetary
topogra-phy on the deep-sea circulation. Deep-Sea Res., supp. 16, 369Ȃ391.
YOSHIKAWA, Y.(2012):An eddy-driven abyssal
circu-lation in a bowl-shaped basin due to deep water formation. J. Oceanogr., 68, 971Ȃ983, doi:10.1007/ s10872Ȃ012Ȃ0148Ȃ2.
Received: August 1, 2018 Acccepted: December 21, 2018