* 嶋村鉄也,Graduate School of Asian and African Area Studies, Kyoto University ** 百瀬邦泰,Faculty of Agriculture, Ehime University
Accepted November 7, 2006
Reciprocal Interactions between Carbon Storage Function and Plant Species
Diversity in a Tropical Peat Swamp Forest
Shimamura Tetsuya* and Momose Kuniyasu**
Abstract
Although carbon storage in ecosystems and biological diversity have been central issues of environmental and ecological sciences for a decade, a reciprocal relationship between diversity and productivity of ecosystems is still unknown. To reveal such the reciprocal relationship, we measured the microtopography around some tree groups, estimated fl ows and stocks of organic matters in soils in the form of litters and roots under three kinds of microtopographic conditions, measured decomposition rates, and detected the shift of distribution patterns of dominant species among growing stages in relation to locations of tree groups creating specifi c microtopographic conditions in a tropical peat swamp forest. The results suggest that heterogeneity of peat accumulation rate results in undulating peat surface. Such undulating peat surface contributes to habitat differen-tiation of tree species, because subtle difference in peat surface elevation determines the degree of fl ooding, which affects survival rates of plants differently according to species. Such the distribution of plant species formed through the above process determines local regime of organic matter dynamics that determines peat surface conditions of near futures. Thus, in tropical peat swamp forests diversity and productivity were closely interdependent to each other, although the diversity has attracted less attention than carbon storage function.
1. Introduction
Biological diversity and the ecosystem function of carbon storage have attracted considerable inter-est in relation to global environmental issues. Higher species and/or functional diversity of plants results in higher productivity [Hector et al. 1999; Tilman et al. 2001; Reich et al. 2004]. Recently, some studies have pointed out that other factors, such as the history of the community assemblage [Fukami and Morin 2003] and facilitative interactions among plant species [Mulder et al. 2001], affect diversity-productivity relationships. Facilitative interactions often include the carbon
assimi-lation process. Through the carbon assimiassimi-lation process, some infl uential plant species develop land cover. As a result, many species of smaller plants are protected from direct sunlight, winds, moving sands, waves, or predation [Pugnaire et al. 1996; Bruno and Kennedy 2000; Forseth et al. 2001; Quested et al. 2003; Tirado and Pugnaire 2003]. Growth of other plant species is also enhanced through the turnover of nutrient-rich leaves [Quested et al. 2003]. However, diversity-productiv-ity relationships have been treated as one-sided interactions, with diversdiversity-productiv-ity as the causative factor and productivity as the result. Here, we introduce reciprocal relations between biodiversity and productivity as determining carbon storage abilities.
Tropical peat swamp forests contain important biodiversity [Dennis and Aldhous 2004] and play a signifi cant role in carbon storage [Brady 1997; Page et al. 1999, 2002]. In tropical peat swamp forests, the peat surface is characterized by considerable topographic heterogeneity at vari-ous scales, ranging from tens of centimeters to several meters [Brady 1997; Page et al. 1999]. The large buttressed trees have large amounts of roots supporting the aboveground organs. The root architecture raises the peat surface around the buttresses and forms mounds. Some species have numerous pneumatphores that enable root respiration during fl ooding. Such species are found in non-mounded areas, whereas juveniles of other species are found on mounds.
Tropical peat swamp forests are appropriate ecosystems for studying the relationships between diversity and carbon storage for three reasons. First, plant activities regulate the conditions of the peat surface (mounded or non-mounded) at small scales. Peat that supports the terrestrial ecosys-tem originates from plant materials. The surface peat materials were deposited during the modern age (post 1950 AD) [Maloney and McCormac 1995; Brady 1997], and peat surface properties are vulnerable to organic matter input and decomposition. Organic matter dynamics at small scales (2-20 m) determine the conditions of peat surfaces, i.e., mounds and non-mounds. Where production exceeds decomposition, peat surfaces rise and mounds are created. Where the rate of decomposi-tion exceeds producdecomposi-tion, peat surfaces sink. Producdecomposi-tion at small scales is greatly affected by large individuals of some tree species. Thus, large-tree distribution determines the conditions of the peat surfaces (mound or non-mound) at small scales. Here, one can assume a spatial association between specifi c microtopography and large individuals of specifi c trees. For example, huge-buttressed trees have mounded sites around them, whereas individuals without buttresses do not. Such differences in microtopography are caused by differences in production and decomposition regimes.
Second, the relative positions of the soil surface and the water table strongly regulate plant distribution [Keddy 1983; Huenneke and Sharitz 1986; Pollock et al. 1998; Denneler et al. 1999; Castelli et al. 2000], seedling survival [Budelsky and Galatowitsch 2000], and seedling
germina-tion [Seabloom et al. 1998; Smith et al. 1995], in wetlands. A similar phenomenon of the effect of humus depth on the spatial distribution of plant species at small scales is observed in tropical heath (kerangas) forests [Miyamoto et al. 2003]. Therefore, established individuals associated with specifi c microtopographies in tropical peat swamp forests affect the survival of younger individuals by modifying the conditions of the peat surface.
Third, effects of facilitative interactions through environmental modifi cation are often docu-mented in extreme habitats [Callaway 1994; Forseth et al. 2001; Quested et al. 2003] and lead to increased productivity [Mulder et al. 2001] because such effects are more important for plants as environmental stresses increase [Pugnaire and Luque 2001]. Tropical peat is characterized by low nutrient content and high acidity and the peat surface is inundated seasonally. Thus, locally mounded sites where the frequency of fl ooding is low can be regarded as examples of modifi ed habitats in which facilitative interactions are observed.
Here, we hypothesized an important diversity-productivity relationship. The heterogeneity of peat surfaces enhance the co-existence of diverse plant species in wetlands, and also, plant species diversity increases heterogeneity in production, which leads to heterogeneity in the conditions of the peat surface. In this study, we present a reciprocal relationship between plant species diver-sity and carbon storage processes in a tropical peat swamp forest. To this end, we show how the activities of different plant functional groups regulate peat surface conditions, how the resulting peat surface conditions affect the regeneration of plants, and further, how such feedback between plant and soil contributes to species coexistence in a tropical peat swamp forest. We conducted studies on plant distribution patterns in relation to microtopographic heterogeneity and on organic matter dynamics, i.e., litter fall, root input, and decomposition processes, among different types of microtopography.
2. Study Site and Methods
2.1 Study Sites and PlotsThe study was conducted in a tropical peat swamp forest in the Kerumutan Wildlife Sanctuary, Riau Province, Eastern Sumatra, Indonesia (0°7’ N, 102°28’ E). The Kerumutan River, a branch of the Kampar River, forms the northern boundary of the Kerumutan Wildlife Sanctuary. Accord-ing to the local people and to our observations around the research site, illegal commercial loggAccord-ing by local people began in 1991, but the logging has not yet invaded the area of protected forest. A small amount of timber was logged for self-consumption before 1991, but the effects of this on the study site are very limited.
We laid out 1-ha (100-m square) study plots 800 m inland from the Kerumutan River. The plot was divided into 400 contiguous 5 × 5-m quadrats. Within each quadrat, the x and y coordi-nates, species, and diameter at breast height (dbh) of all living trees with dbh ≥ 1 cm were recorded. The dataset was obtained between August 2002 and March 2003. Details of the study plots are described by Momose and Shimamura [2002], Shimamura and Momose [2005] and Shimamura et al. [2006].
2.2 Methods
2.2.1 Microtopography around Established Trees
Elevation was defi ned as the distance between the ground surface and the water table on 14 Febru-ary 2001, when the water table was high. We dug small holes to measure the elevation at a given point on the forest fl oor.
To study the relationships between microtopographic heterogeneity and organic matter dynam-ics, we defi ned some groups of established trees. We selected seven living and dead established, but-tressed trees with dbh ≥ 40 cm and seven established individuals of Madhuca motleyana Macbride and Stemonurus secundifl orus Blume with dbh ≥ 15 cm. Established, buttressed trees reach the emergent stratum of the forest, which is over 40 cm in dbh, and are Aglaia argentea Blume, Pala-quium burckii H. J. Lam, Shorea teysmanniana Dyer ex Brandis, Shorea uliginosa Foxworthy, and Swintonia glauca Engl. Established M. motleyana and S. secundifl orus trees reach the forest canopy, which is approximately 25 m in height, and have pneumatophores, but are not buttressed. Study trees were selected randomly from the tagged trees in the 1-ha plot, but dead buttressed trees were found in the plot and within 100 m of the boundary of the plot. To compare the microtopography around buttresses between dead and living individuals, we did not distinguish the species of living buttressed trees because it was diffi cult to identify the species by their rotten trunks and barks.
For each individual, we laid out four 6-m transect lines running toward each point of the com-pass from the center of the trunk. We measured the elevation at 12 points placed every 50 cm along the transects. At the same time, we took hemispherical photographs at 150 points (fi ve individuals × two 5-m transects × fi ve points (1-m intervals) × three tree groups) using a fi sh-eye camera (Cool Pix 900 with Fish-eye converter FC-E8, Nikon) at a height of 1.0 m above the ground, and we calculated the indirect site factor (ISF) using Hemiview software (Delta-T Device).
2.2.2 Litter Fall, Root Production, Bulk Density, and Decomposition
Gaps were defi ned as canopy openings exceeding 50 m2 in this study. Mounds were defi ned as
continuous areas exceeding 2 m in diameter where the elevation was higher than 15 cm, but such elevated sites in gaps were excluded. We use the term non-mounds to describe habitats that were
neither mounds nor gaps.
Litter fall, litter deposition, root production, bulk density of peat, and rates of leaf litter de-composition were measured on gaps, mounds, and non-mounds. Litter fall was collected monthly from the beginning of September 2001 to August 2002 using 10 litter traps for each type of habitat. Each litter trap was a basket 1 m in diameter made from 2-mm nylon mesh and suspended from a wire hoop. In December 2003 and March, June, and August 2004, litter deposits above the peat surface were collected. All recognizable aboveground litter was harvested from 30 quadrats of 50 × 50 cm located around the 30 litter traps.
Ingrowth cores (20 cm in length, 7 cm in diameter) made of 2-mm nylon mesh were fi lled with root-free peat soils and installed in the ground at a depth of 0-20 cm. In each type of habitat where litter traps were placed, four locations were randomly selected and a pair of ingrowth cores was inserted. In total, 24 ingrowth cores were buried in August 2001 and harvested 1 year later. However some cores were broken. The sample numbers became eight, six, and six for mounds, non-mounds, and gaps, respectively.
Volumetric samples of intact peat were extracted from the surface peat layer using open-ended coring tubes of pipe (1,061 cm3, diameter 11.8 cm) in August 2003. In each type of habitat where
litter traps were placed, fi ve locations were randomly selected and a pair of volumetric samples was collected from nearby locations.
Leaf litter decomposition processes were studied using a litter-bag method. Leaf litter of Swintonia glauca measuring 10 g in dry weight was enclosed in a litter bag made of polypropylene cloth with a mesh size of 2 mm. Litterbags were deployed in August 2001. In each type of habitat where litter traps were placed, fi ve locations were randomly selected and seven litterbags were placed at each selected point. Samples were collected seven times during 1 year: monthly for the fi rst 2 months, then bimonthly until August 2002. Details of the above measurements are presented in Shimamura and Momose [2005].
2.3 Analyses
2.3.1 Shift in Plant Distribution
To investigate the relation between microtopographic types and plant species distribution, we conducted spatial point pattern analyses. For these analyses, we defi ned established, buttressed trees with dbh ≥ 40 cm as mound-forming trees and established trees of Madhuca motleyana and Stemonurus secundifl orus with dbh ≥ 15 cm as non-mound-forming trees. Living established, but-tressed trees were always surrounded by mounds, whereas elevations around established trees of Madhuca motleyana and Stemonurus secundifl orus were mostly constant according to the distance
from the trunk.
We tested the spatial association of abundant species, i.e., the top 10 species in numbers of individuals, and Shorea teysmanniana as an important tree species that dominates at the emergent stratum (see Electronic Appendix part B in Shimamura and Momose [2005] for abundance) against mound-forming and non-mound-forming trees as indices of microtopography. For this purpose, distribution data obtained in the 1-ha plot were analyzed using the L1,2(t) function [Besag 1977; Ripley 1977; Lotwick and Silverman 1982]. Statistical signifi cance of the function was calculated using 10,000 simulations of random toroidal shifts (mean ± 1.96 s.d.) for 95% confi dence intervals. If the sample statistic remained within the bounds of the confi dence intervals at any given t, the null hypothesis of spatial independence was not rejected; when it exceeded the upper (lower) boundaries, the sampled points were regarded as an attractive (repulsive) pattern [Diggle 1983].
We divided each tree species into two groups: large and small trees. Large trees were the top 30% of individuals in dbh within each species; small trees were the bottom 40%. Large trees of Madhuca motleyana and Stemonurus secundifl orus are non-mound-forming trees and Swintonia glauca and Shorea teysmanniana are mound-forming trees. Tests on the spatial associations of large Madhuca motleyana and Stemonurus secundifl orus trees with established non-mound-forming trees were conducted by omitting trees with dbh > 15 cm from the category of large trees. Also, spatial associations of large Swintonia glauca and Shorea teysmanniana trees with mound-forming trees were tested by omitting individuals with dbh > 40 cm from large trees.
2.3.2 Modeling the Peat Accumulation Process
We used models to evaluate carbon accumulation processes at small scales. Details of the models are described in Shimamura and Momose [2005]. In the model, tropical peat soils consist of three layers. The litter layer is made of undecomposed leaves and small woody debris above the peat layer. Similar to boreal and temperate peat, tropical peat is characterized by two horizons: the surface aerobic acrotelm and the deeper anaerobic catotelm. Differences in acrotelm thickness strongly contribute to differences in elevation. Because the depth of the catotelm layer is defi ned by the height of the water table and the bottom of the peat, there is no heterogeneity in the depth of catotelm within a relatively short distance. Thus, the net accumulation of peat is refl ected by the mass of the acrotelm layer. In the model, the mass of the acrotelm (mA) is expressed as follows:
mA=Aexp(pA /b-kA)t+skL(pL/kL-mL0)exp(-kLt)/(kL+(pA/b-kA))-(spL-mCkC)/(pA/b-kA),
where A is an integral constant, t is time, pA is root production per unit depth, b is the bulk density of the acrotelm, s is the portion of fragmented litter not lost from soils by respiration or leaching, kL and kA are Olson’s decomposition constants [Olson 1963] for the litter and acrotelm layers,
respectively, mL0 is the initial mass of the acrotelm, pL is the mass of litter fall, mC is the mass of catotelm, and kC is Olson’s decomposition constant for catotelm.
Using the model, we also examined the effects of shifting habitat on the peat surface. We simulated shifts in habitat by exchanging variables. For example, to determine the effect of distur-bance on mounds, we changed fi ve variables, pL, kL, pA, kA, and s, for those of gaps. In this way, we simulated four types of shifting habitat: non-mound to mound, gap to non-mound, non-mound to gap, and mound to gap.
3. Results
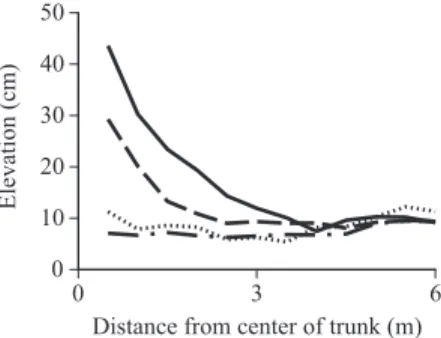
3.1 Microhabitat around Established TreesAccording to the measurements of elevation at transect lines around seven trees, mounds occurred around the living or dead established, buttressed trees. The mean elevation was 43.6 cm at points 0.5 m from the center of trunks of large living buttressed trees, and decreased gradually as the dis-tance from tree trunks increased (Fig. 1). Flatter sites were found around the established Madhuca motleyana and Stemonurus secundifl orus trees than around living or dead established, buttressed trees.
There were signifi cant differences (p < 0.001) in elevations within 3.5 m among the four types of established trees between all pairs of species, except Madhuca motleyana and Stemonurus secundifl orus trees (p = 0.791, ANOVA and Tamhane’s T2). Thus, the microtopography around established tree groups can be categorized into three groups: highly mounded sites around living buttressed trees, moderately mounded sites around dead buttressed trees, and non-mounded sites
Fig. 1. Changes in Ground Surface Elevation with Distance from Living Established Buttressed Trees (dbh ≥ 40 cm; solid line), Dead Established Buttressed Trees (broken line), Established Madhuca motleyana Trees
(dbh ≥ 15 cm; dotted line) and Established Stemonurus secundifl orus Trees (dbh ≥ 15 cm; broken-dotted
line)
around Madhuca motleyana and Stemonurus secundifl orus trees (Fig. 1).
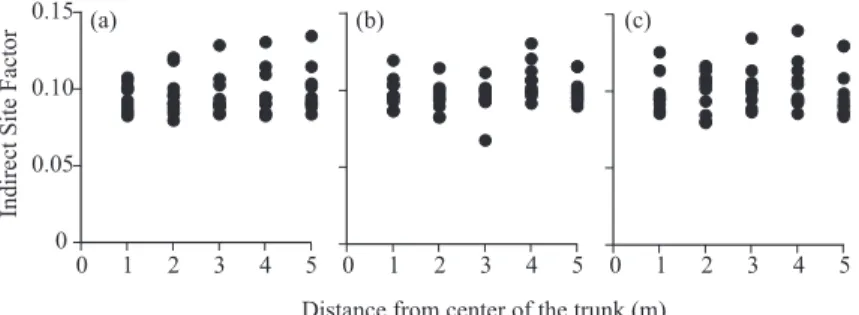
Mean values (s.d.) of indirect site factor (ISF), an indicator of light conditions, around estab-lished buttressed, Maduca motoleyana, and Stemonurus secundifl orus trees were 0.0963 (0.0131), 0.0987 (0.0107), and 0.100 (0.0143), respectively. There was no signifi cant differences in light conditions between the three groups (χ2 = 4.55; p = 0.103, KruskalWallis test). ISF was not signifi
-cantly regressed to distance from the center of the trunk of established buttressed trees (F1,48 = 0.526, p=0.472), established Maduca motleyana trees (F1,48=1.72, p=0.196), or established Stemonurus secundifl orus trees (F1,48=0.301, p=0.586; Fig. 2).
3.2 Litter Fall, Root Production, Bulk Density, and Decomposition
There were consistent seasonal patterns of litter fall among mounds, non-mounds, and gaps. There was an increase in litter fall during November and December 2001, when precipitation
Fig. 2. Changes in the Indirect Site Factor with Distance from (a) Established Buttressed Trees (dbh ≥ 40 cm), (b) Established Madhuca motleyana Trees (dbh ≥ 15 cm), and (c) Established Stemonurus secundifl orus
Trees (dbh ≥ 15 cm)
Fig. 3. Monthly Litter Fall for Mounds (shaded circles), Non-mounds (open circles), and Gaps (shaded triangles)
was relatively high. Litter production between January and June 2002 was constant in all three types of sites (Fig. 3). Mean (s.d.) litter fall was highest on mounds and lowest in gaps, at 9.43 (1.94), 6.96 (0.770), and 4.20 (1.64) ton ha-1 year-1, respectively. The rank of fi ne root production
among the three types of habitat was mounds>non-mounds>gaps. Mean (s.d.) estimated fi ne root production was 1.99 (1.55), 1.14 (1.15), and 0.307 (0.222) ton ha-1 year-1, respectively (Fig. 4).
The rank in mass of litter deposits on the peat surface among the three habitats was mounds>non-mounds>gaps, at means (s.d.) of 9.62 (4.35), 7.41 (4.05), and 4.98 (4.32) ton ha-1, respectively.
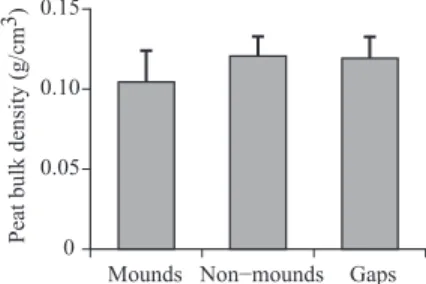
There were signifi cant effects of habitat (F2,108 = 13.1, p < 0.001, ANOVA) and season (F3,108 = 5.86, p < 0.001, ANOVA) on the mass of litter deposition, but no signifi cant interaction of habitat and season was found (Fig. 5). The mean peat bulk density of non-mounds and gaps was similar; that of peat on mounds was lower (Fig. 6). The mean values (s.d.) peat bulk density of non-mounds,
Fig. 4. Mean (s.d.) Estimated Annual Fine Root Production for Mounds, Non-mounds, and Gaps
This fi gure was reproduced using data from Shimamura and Momose [2005].
Fig. 6. Mean (s.d.) Bulk Density for Mounds, Non-mounds, and Gaps
This fi gure was reproduced using data from Shimamura and Momose [2005].
Fig. 7. Changes in the Dry Weight of Swintonia glauca Leaf Litter during Decomposition Solid, dotted, and broken lines indicate the dry weight for mounds, non-mounds, and gaps, respectively.
Fig. 5. Seasonal Changes in the Mass of Litter Deposition on the Forest Floor for Mounds, Non-mounds, and Gaps
gaps, and mounds was 0.121 (0.0121), 0.119 (0.0136), and 0.104 (0.0196) g cm-3, respectively.
The initial decomposition patterns among the three habitats were similar until the eighth month. After the eighth month, the decomposition process slowed in gaps (Fig. 7). The rank in leaf litter decomposition constants (Olson’s k) among the three habitats was non-mounds>mounds>gaps at means (s.e.b) of 0.916 (0.0603, d.f. = 30), 0.891 (0.0410, d.f. = 29), and 0.760 (0.0394, d.f. = 30) year-1, respectively.
3.3 Spatial Associations among Tree Groups
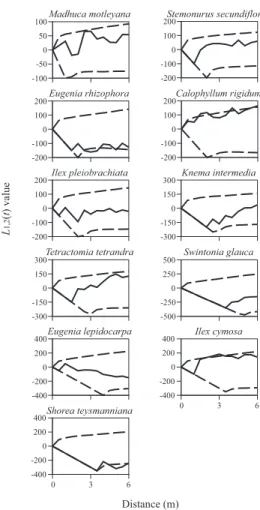
According to spatial point pattern analyses, small trees of Knema intermedia Warb were signifi cantly attracted to mound-forming trees at 2-2.5 and 5-5.5 m, whereas small trees of other species showed no signifi cant spatial associations with mound-forming trees (Fig. 8). In contrast to small trees, the large trees of fi ve study species showed signifi cant spatial associations with mound-forming trees. Large trees of Eugenia rhizophora Boerlage et Koorders showed signifi cant repulsion from mound-forming trees at 2.5-3.5 and 5 m. Large trees of E. lepidocarpa were signifi cantly repulsed at 6 m. Large Shorea teysmanniana trees showed signifi cant repulsive distribution at 4.5-6 m (Fig. 9).
Small trees of three species showed signifi cant spatial associations with non-mound-forming trees. Small Madhuca motleyana trees showed signifi cant attraction at 3, 4-5, and 6 m to non-mound-forming trees, and small Calophyllum rigidum Miq. trees were signifi cantly attracted to non-mound-forming trees at 0.5 m. Small Swintonia glauca trees showed signifi cant repulsive dis-tribution to non-mound-forming trees at 3.5 and 5.5 m (Fig. 10). Large trees of six species showed signifi cant spatial associations with non-mound forming trees.
Large Stemonurus secundifl orus trees showed attractive distribution to non-mound-forming trees at 2-2.5 and 4 m. Large Eugenia rhizophora trees were signifi cantly repulsed at 6 m. Large trees of Knema intermedia showed signifi cant attraction to non-mound-forming trees at 0.5-3 m. Large Tetractomia tetrandra Craib. and Eugenia lepidocarpa trees were signifi cantly attracted at 6 and 2 m, respectively. Large trees of Shorea teysmanniana showed signifi cant repulsive distribution to non-mound forming trees at 3-3.5 and 4.5-6 m (Fig. 11).
3.4 Modeling Peat Surface Accumulation
To simulate peat surface dynamics, we used variables obtained from our measurements. Variables that we did not measure here, such as kC, were obtained from Brady [1997]. At the study site, the mean water table was -30.3 cm and the mean height of mounds was 34.1 cm [Shimamura et al. 2006]. We used 0.30 m as the initial thickness of the acrotelm layer for non-mounds and gaps, and 0.60 m as the initial thickness for mounds. According to the model, the thickness of the ac-rotelm layer will rise at mounds, non-mounds, and gaps. The rank in degree of surface rising was
mounds>non-mounds>gaps, and peat accumulation after 5 years was 56.8, 28.5, and 3.57 ton ha-1,
respectively (Fig. 12). These values are equivalent to 5.46-, 2.35-, and 0.300-cm increases in the peat surface, respectively [Shimamura and Momose 2005]. The results of the simulation indicate that the establishment of non-mound-forming trees in gaps results in an increase of 22.6 ton ha-1
in ∆mA after 5 years. Similarly, establishment of mound-forming trees on non-mounds causes an increase of 15.2 ton ha-1 in ∆m
A. In contrast, the death of mound- and non-mound-forming trees
Fig. 8. L1,2(t) Values of the Bivariate Distribution of
Mound-forming Trees vs. Small Trees of Each Tree Species
The solid line shows actual L1,2(t) values for extant plants, broken line shows 95% confi dence limits for the pattern expected from an independent distribution of plant locations.
Fig. 9. L1,2(t) Values of the Bivariate Distribution of
Mound-forming Trees vs. Large Trees of Each Tree Species
The solid line shows actual L1,2(t) values for extant plants, broken line shows 95% confi dence limits for the pattern expected from an independent distribution of plant locations.
Fig. 10. L1,2(t) Values of the Bivariate Distribution
of Non-mound-forming Trees vs. Small Trees of Each Tree Species
The solid line shows actual L1,2(t) values for extant plants, broken line shows 95% confi dence limits for the pattern expected from an independent distribution of plant locations.
Fig. 11. L1,2(t) Values of the Bivariate Distribution
of Non-mound-forming Trees vs. Large Trees of Each Tree Species
The solid line shows actual L1,2(t) values for extant plants, broken line shows 95% confi dence limits for the pattern expected from an independent distribution of plant locations.
causes decreases of 54.7 and 22.7 ton ha-1 in ∆m
A, respectively (Fig. 12).
4. Discussion
4.1 Shifts in Plant Distribution and Flooding ToleranceMicrotopography contributes to plant species distributions in wetlands [Huenneke and Sharitz 1986]. The distribution of plant species is arranged along the elevation according to fl ood tolerance
[Robertson et al. 1978; Jeglum and He 1995] because elevation refl ects the frequency of inundation. The light environment also affects plant species distributions. Because there were no differences in the light environment between the two categories of established trees [Shimamura and Momose 2005], the differences in distributions of tree species in relation to mound-forming trees and non-mound-forming trees were mainly attributed to the effects of microtopography.
Stress-tolerant and stress-intolerant species are arranged along the gradient of inundation frequency. Stress-tolerant species often require stressful habitats where competitive species are excluded. In contrast, stress-intolerant species require a comparatively less stressful habitat. The mounds that occurred around the mound-forming trees represented less stressful habitats without frequent inundation, whereas stressful habitats occurred around the non-mound-forming trees. Thus, the tree species attracted to the mound-forming trees or repulsed from the non-mound-form-ing trees are fl ood-intolerant species, and those attracted to non-mound-formnon-mound-form-ing trees or repulsed from mound-forming trees are fl ood-tolerant species.
It has often been documented that plant distributions, especially for juveniles and seedlings, are strongly affected by the means of dispersal [Hubbell 1979; Briggs and Gibson 1992]. Short dis-persal distances [Prentice and Werger 1985; Sterner et al. 1986; Hatton 1989] explain the clumped distribution of small trees. The distribution of parent plants also affects the spatial heterogeneity of small plants [Nanami et al. 1999]. It is diffi cult to distinguish whether the observed pattern of distribution of small trees was caused by the dispersal or habitat preferences of each species. However, a comparison of the patterns of distribution between small and large conspecifi c trees offsets the effect of methods of seed dispersal. The difference in distributions refl ects post-dispersal events. Thus, such a comparison is very informative in an analysis of habitat preferences. We here
Fig. 12. Changes in Peat Deposition in the Acrotelm within 5 Years as Simulated by the Model
The solid, broken, and dotted lines in (a) indicate mounds, non-mounds, and gaps, respectively. In (b), shifts in habitat from non-mound to mound, gap to non-mound, non-mound to gap, and mound to gap are indicated by the solid, broken, dotted, and dotted-broken lines, respectively.
focused on shifts in distribution between small and large trees to explain the habitat preferences of tree species. Because the mean size of mounds around mound-forming trees was 3.5 m in radius, we paid particular attention to signifi cant spatial associations within 3.5 m.
The distribution patterns of Calophyllum rigidum and Ilex cymosa Blume trees shifted from random to closer to mound-forming trees with increasing size class. This indicates that they are fl ood-intolerant species. Similarly the shifts in distribution patterns of Eugenia rhizophora trees indicate that this species is fl ood-tolerant (Figs. 8, 9). The spatial associations of tree species to non-mound-forming trees indicate that Stemonurus secundifl orus, Knema intermedia, and Eugenia lepidocarpa trees are fl ood-tolerant (Figs. 10, 11).
4.2 Proposed Four-phase Dynamics of Tropical Peat Swamp Forest
Our results suggest that the microtopographic heterogeneity of the peat surface provides an axis of habitat partitioning for plant species, and that rising and sinking of the peat surface (elevation dynamics) occurs in the peat swamp forest. The establishment and death of huge buttressed trees causes the rise and sink of the peat surface, respectively, and results in an undulating peat surface. Mounds formed around huge buttressed trees are suitable habitats for regeneration of fl ood-intoler-ant species. After established buttressed trees die, mounds become lower and fi nally disappear (Fig. 12). As a result, habitats suitable for fl ood-tolerant species appear. Thus, plant species coexistence in the forest can be explained by the mosaic-like dynamics of mounds and non-mounds, although we do not know whether this forest is in kinetic equilibrium over a long time scale. Even if this forest is not in kinetic equilibrium, succession of the forest will gradually occur through fl uctuations of the following mosaic-like dynamics.
We propose a dynamic model that allows us to explain the coexistence of tree species in tropi-cal peat swamp forests (Fig. 13). The model is based on the following assumptions: (i) mounds are created around buttressed trees as they grow; (ii) after large buttressed trees die, the surrounding mounds sink; (iii) there are fl ood-tolerant and -intolerant tree species; and (iv) there are shade-toler-ant and -intolershade-toler-ant tree species.
Peat swamp forests are composed of areas categorized as one of four phases based on the con-ditions of canopy coverage and microtopography; mounds under canopy: MU-phase; non-mounds under canopy: NU-phase; mounds in gaps: MG-phase; and non-mounds in gaps: NG-phase. Of the four phases MU-phase can be divided into two phase: mounds under canopy with an established mound-forming tree: MUa-phase; and mounds under canopy without any established mound-form-ing trees: MUb-phase.
Canopy gaps in tropical moist forests return to the pre-gap phase within 5 years in tropical moist forests [Fraver et al. 1998; Van der Meer 1997]. This time scale is less than that required for the establishment of large buttressed trees that form mounds. Thus, whether regenerating tree species are mound-forming or non-mound-forming, the NG-phase is replaced by the phase. In the NU-phase, individuals of fl ood-tolerant and shade-intolerant species dominate. If a disturbance occurs, the NU-phase is replaced by the NG-phase. Shorea teysmanniana is one of the mound-forming tree species that can inhabit non-mounds. Once a large individual of a mound-forming tree species such as S. teysmanniana is established, this phase is replaced by the MUa-phase. In the MUa-phase, individuals of fl ood-intolerant and shade-tolerant species successfully regenerate. If a disturbance occurs in the MUa-phase, this phase is replaced by the MG-phase. As already mentioned above, canopy gaps in tropical forests return to pre-gap phase within 5 years [Fraver et al. 1998; Van der Meer 1997], and more than 5 years are needed for mounds to return non-mounded sites [Shimamura and Momose 2005]. Thus, canopy closure occurs faster than disappearance of the mound, and the MG-phase is replaced by the MUb-phase. Similar to the MUa-phase, individuals of fl ood-intolerant and shade-tolerant species successfully regenerate in the MUb-phase. In the MUb-phase, wheather mound- or non-mound-forming trees successfully regenerate, disappearance of the mound occurs faster than establishment of large trees, and the MUb-phase is replaced by NU-phase, because it takes longer term to establish a large tree than the disappearance of mounds.
The above model contains important suggestions. In tropical peat swamp forests, the carbon
Fig. 13. Diagram of the Proposed Four-phase Dynamics Used to Explain Plant Species Coexistence in Tropical Peat Swamp Forests
storage function of tropical peat swamp forests is maintained by diverse plant species. The dis-tribution of diverse plant species contributes to heterogeneity in carbon storage and results in an undulating peat surface. The undulating peat surface provides habitat for diverse plant species. Thus, the relation between diversity-maintaining mechanisms and carbon-storing functions of tropical peat swamp forests is reciprocal. The reciprocal relationship increases the importance of the diverse plant community in tropical peat swamp forests because they maintain carbon storage function, although the diversity in tropical peat swamp forests has been given less attention [Dennis and Aldhous 2004] than the carbon storage function.
Acknowledgements
We thank Supiandi Sabiham, Hisao Furukawa, staff members of the Conservation Section of the Forest De-partment of Riau Province, and staff members of Herbarium Bogoriense for assistance. We also thank Shigeo Kobayashi and Mamoru Kanzaki for helpful comments on earlier drafts of the manuscript. This work was partly funded by the Japan Society for the Promotion of Science (JSPS), by the Twenty-First Century Centers of Excellence (COE) program entitled “Aiming for COE Integrated Area Studies” and by the Japan Ministry of Environment program Global Environmental Research Fund.
References
Besag, J. 1977. Contribution to the Discussion on Dr. Ripley’s Paper, Journal of the Royal Statistical Society
Series B 39: 193-195.
Brady, M. A. 1997. Organic Matter Dynamics of Coastal Peat Deposits in Sumatra, Indonesia. Ph. D. Thesis, University of British Columbia.
Briggs, J. M. and D. J. Gibson. 1992. Effect of Fire on Tree Spatial Patterns in a Tallgrass Prairie Landscape,
Bulletin of theTorray Botanical Club 119: 300-307.
Bruno, J. F. and C. W. Kennedy. 2000. Patch-size Dependent Habitat Modifi cation and Facilitation on New England Cobble Beaches by Spartina alterniffl ora, Oecologia 122: 98-108.
Budelsky, R. A. and S. M. Galatowitsch. 2000. Effects of Water Regime and Competition on the Establishment of a Native Sedge in Restored Wetlands, Journal of Applied Ecology 37: 971-985.
Callaway, R. M. 1994. Facilitative and Interfering Effects of Arthrocnemum-subterminale on Winter Annuals,
Ecology 75: 681-686.
Castelli, R. M., J. C. Chambers and R. J. Tausch. 2000. Soil-plant Relations along a Soil-water Gradient in Great Basin Riparian Meadows, Wetlands 20: 251-266.
Denneler, B., Y. Bergeron and Y. Begin. 1999. An Attempt to Explain the Distribution of the Tree Species Com-posing the Riparian Forests of Lake Duparquet, Southern Boreal Region of Quebec, Canada, Canadian
Journal of Botany 77: 1744-1755.
Dennis, C. and P. Aldhous. 2004. A Tragedy with Many Players, Nature 430: 396-398. Diggle, P. J. 1983. Statistical Analysis of Spatial Point Patterns. London: Academic Press.
Forseth, I. N., D. A. Wait and B. B. Casper. 2001. Shading by Shrubs in a Desert System Reduces the Physiological and Demographic Performance of an Associated Herbaceous Perennial, Journal of Ecology 77: 870-886.
Fraver, S., V. L. Brokaw and A. P. Smith. 1998. Delimiting the Gap Phase in the Growth Cycle of a Panamanian Forest, Journal of Tropical Ecology 14: 673-681.
Fukami, T. and P. J. Morin. 2003. Productivity-biodiversity Relationships Depend on the History of Community Assembly, Nature 424: 243-426.
Hatton, T. J. 1989. Spatial Analysis of a Subalpine Heath Woodland, Australian Journal of Ecology 14: 65-75.
Hector, A., B. Schmid, C. Beirkuhnlein (and other 30 authors). 1999. Plant Diversity and Productivity Experi-ments in European Grasslands, Science 286: 1123-1127.
Hubbell, S. P. 1979. Tree Dispersion, Abundance, and Diversity in a Tropical Dry Forest, Science 203: 1299-1309.
Huenneke, L. F. and R. R. Sharitz. 1986. Microsite Abundance and Distribution of Woody Seedlings in a South Carolina Cypress-tupelo Swamp, American Midland Naturalist 115: 328-335.
Jeglum, J. K. and F. He. 1995. Pattern and Vegetation-environment Relationships in a Boreal Forest Wetland in Northeastern Ontario, Canadian Journal of Botany 73: 629-637.
Keddy, P. A. 1983. Shoreline Vegetation in Axe Lake, Ontario: Effects of Exposure on Zonation Patterns,
Ecology 64: 331-334.
Lotwick, H. W. and B. W. Silverman. 1982. Methods for Analyzing Spatial Processes of Several Types of Points,
Journal of the Royal Statistical Society Series B 44: 406-413.
Maloney, B. K. and F. G. McCormac. 1995. A 30,000-year Pollen and Radiocarbon Record from Highland Sumatra as Evidence for Climatic Change, Radiocarbon 37: 181-190.
Miyamoto, K., E. Suzuki, T. Kohyama, T. Seino, E. Mirmanto and H. Simbolon. 2003. Habitat Differentiation among Tree Species with Small-scale Variation of Humus Depth and Topography in a Tropical Heath Forest of Central Kalimantan, Indonesia, Journal of Tropical Ecology 19: 43-54.
Momose, K. and T. Shimamura. 2002. Environment and People of Sumatran Peat Swamp Forest I: Distribution and Typology of Vegetation, South East Asia Study 40: 72-84.
Mulder, C. P. H., D. D. Uliassi and D. F. Doak. 2001. Physical Stress and Diversity-Productivity Relationships: The Role of Positive Interactions, Proceedings of National Academy of Science, USA 98: 6704-6708. Nanami, S., H. Kawaguchi and T. Yamakura. 1999. Dioecy-induced Spatial Patterns of Two Codominant Tree
Species, Podocarpus nagi and Neolitsea aciculata, Journal of Ecology 87: 678-687.
Olson, J. S. 1963. Energy Storage and the Balance of Producers and Decomposers in Ecological Systems,
Ecol-ogy 44: 322-331.
Page, S. E., J. O. Rieley, O. W. Shotyk and D. Weiss. 1999. Interdependence of Peat and Vegetation in a Tropical Peat Swamp Forest, Philosophical Transactions of the Royal Society, London, Series B: Biological Science 354: 1885-1897.
Page, S. E., F. Siegert, J. O. Rieley, H. D. V. Boehm, A. Jaya and S. Limin. 2002. The Amount of Carbon Released from Peat and Forest Fires in Indonesia During 1997, Nature 420: 61-65.
Pollock, M. M., R. J. Naiman and T. A. Hanley. 1998. Plant Species Richness in Riparian Wetlands: A Test of Biodiversity Theory, Ecology 79: 94-105.
Prentice, I. C. and M. J. A. Werger. 1985. Clump Spacing in a Desert Dwarf Shrub Community, Vegetatio 63: 133-139.
Pugnaire, F. I., P. Haase and J. Puigdefabregas. 1996. Facilitation between Higher Plant Species in a Semiarid Environment, Ecology 77: 1420-1426.
Oikos 93: 42-49.
Quested, H. M., M. C. Press, T. V. Callaghan and J. H. C. Cornelissen. 2003. Litter of the Hemiparasite
Bart-sia alpine Enhances Plant Growth: Evidence for a Functional Role in Nutrient Cycling, Oecologia 135:
606-614.
Reich, P. B., D. Tilman, S. Naeem, D. S. Ellsworth, J. Knops, J. Craine, D. Wedin and J. Trost. 2004. Species and Functional Group Diversity Independently Infl uence Biomass Accumulation and Its Response to CO2 and N, Proceedings of National Academy of Science, USA 101: 10101-10106.
Ripley, B. D. 1977. Modelling Spatial Patterns, Journal of the Royal Statistical Society Series B 39: 172-192. Robertson, P. A., G. T. Weaver and J. A. Cavanaugh. 1978. Vegetation and Tree Species Patterns near the
Northern Terminus of the Southern Floodplain Forest, Ecological Monographs 48: 249-267.
Seabloom, W. W., A. G. van der Valk and K. A. Moloney. 1998. The Role of Water Depth and Soil Temperature in Determining Initial Composition of Prairie Wetland Coenoclines, Plant Ecology 138: 203-216. Shimamura, T. and K. Momose. 2005. Organic Matter Dynamics Control Plant Species Coexistence in a
Tropi-cal Peat Swamp Forest, Proceedings of the Royal Society B 272: 1503-1510.
Shimamura, T., K. Momose and S. Kobayashi. 2006. A Comparison of Sites Suitable for the Seeding Estab-lishment of Two Co-occurring Species, Swintonia glauca and Stemonurus scorpioides, in a Tropical Peat Swamp Forest, Ecological Research 21: 759-767.
Smith, M., T. Brandt and J. Stone. 1995. Effect of Soil Texture and Microtopography on Germination and Seedling Growth in Boltonia decurrens (Asteraceae), a Threatened Floodplain Species, Wetlands 15: 392-396.
Sterner, R. W., C. A. Ribic and G. E. Schatz. 1986. Testing for Life Historical Changes in Spatial Patterns of Four Tropical Tree Species, Journal of Ecology 74: 621-633.
Tilman, D., P. B. Reich, J. Knops, D. Wedin, T. Mielke and C. Lehman. 2001. Diversity and Productivity in a Long-term Grassland Experiment, Science 294: 843-845.
Tirado, R. and F. I. Pugnaire. 2003. Shrub Spatial Aggregation and Consequences for Reproductive Success,
Oecologia 136: 296-301.
Van der Meer, P. J. 1997. Vegetation Development in Canopy Gaps in a Tropical Rain Forest in French Guiana,