Finding Unique PCR Products on Distributed Databases
11
0
0
全文
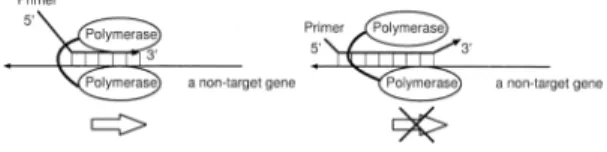
(2) Vol. 44. No. SIG 6(ACS 1). Finding Unique PCR Products on Distributed Databases. on target genome. However, since confirmation processes are independent of each other according to each length, it can be done in parallel. In this paper, we modified our proposed method of finding unique PCR products to work on distributed database in parallel. We describe its implementation on the European Data Grid and show the result of computing experiments on S. cerevisiae. Moreover, we show the sequences found by our method, which can not be uniquely observed by any probe sequence but by a pair of PCR primers. 2. Target Specific Primer in PCR In this section, we discuss the condition of the target specific primer. At first, the specificity of a sequence itself as a primer is discussed. Next, the specificity of a sequence as a pair of primers is shown. 2.1 Specificity of a Sequence as a Primer Itself In this part, firstly, the condition of proper primer sequences is shown. Secondly, the condition of unique sequences is described. Finally, the condition of the target specific primer is summarized. A primer must strictly hybridize with the target gene and avoid hybridizing with non-target genes. The reaction of hybridization in the 3’end region influences most on the total PCR or RT3) . On the other hand, the start of elongation reaction in PCR is relatively insensitive to the hybridization reaction in the 5’-end region. Figure 1 illustrates how the elongation reaction proceeds. On the left, when the partial sequence in the 3’-end region of the primer hybridizes with a non-target gene, the elongation reaction begins without the hybridization reaction in the 5’-end region. On the contrary, as shown on the right, if the sequence does not hybridize in the 3’-end region, it is difficult for the polymerase to start the elongation reaction. When a mismatch against non-targets occurs on the sequence near the 3’-end of the primer,. Fig. 1. Illustration on the way of commencement in elongation reaction. On the left, a mismatch occurs in the 5’-end region of the sequence. On the right, a mismatch occurs in the 3’-end region of the sequence.. 35. the elongation reaction hardly begins. Only if the sequence of the 3’-end region of the primer is enough unique, the correct elongation reaction can proceed efficiently. The efficiency of hybridization is mainly influenced by the consecutive region of sequence without mismatch1) . Therefore, the most important factor to drive elongation reaction accurately and efficiently is the uniqueness of the sequence in the 3’-end region. Hence, we must select the sequence that has a unique and short sequence in the 3’-end region as an optimal primer. We have proposed how to calculate the minimum length of a unique consecutive sequence (USL) in our previous work4) . USL means the minimum length of a unique sequence. If the length of a partial sequence of a gene is beyond the value of its USL, the sequence becomes unique on the whole target genome. By means of this method, some short sequences that exist only once on the entire target genome can be found. In other words, the uniqueness of the sequences on the target genome is guaranteed by this method, unlike the frequency of occurrence method5) . If the sequence existing more than twice on the entire target genome is used as a primer, the specific band is never produced. The sequence of the target specific primer should not exist more than twice on the target genomic sequence. If a sequence frequently occurring on the target genome is used as a primer, a lot of unexpected products are amplified. Namely, the important signal could be subdued by much noise. Thus, as for the target specific primer, we claim the following characteristics: ( 1 ) The 3’-end sequence of the primer must exist only once on the whole genome, namely it must be unique. ( 2 ) The unique sequence must be as short as possible. 2.2 Specificity of a Sequence as a Pair of Primers In this part, at first, we discuss the condition of PCR products. Next, the condition of the sequences amplifying a unique product in PCR is described. Finally, the condition is summarized. In PCR, in order to amplify the partial sequence that we desire, we can use two oligo sequences as a pair of primers. The partial sequence sandwiched between one primer and the other is amplified. Figures 2 and 3 illustrate how PCR works..
(3) 36. Fig. 2. IPSJ Transactions on Advanced Computing Systems. Illustration on how PCR works. Both primers hybridize with a non-target gene.. May 2003. words, we can distinguish the specific product from among the others by looking at their length by means of electrophoresis. Inversely speaking, it is necessary to circumvent the possibility of wrong PCR products whose length is the same as that of the target. Therefore, we must take into consideration the uniqueness of product length. In short, the following is required. ( 1 ) The edge sequences of a product must be unique. ( 2 ) The uniqueness of product length must be taken into account. ( 3 ) These unique sequences must be as short as possible. 3. Algorithm. Fig. 3. Illustration on how PCR works. One of the primers hybridizes with a non-target gene.. In Fig. 2, the consecutive sequence in the 3’end region of a forward primer is matching the partial sequence of a non-target. That of the reverse primer is also matching the partial sequence of the non-target. On this condition, both primers possibly hybridize with the nontarget gene and the elongation reaction probably begins on both sequences. After n cycles of PCR, the quantity of its wrong product grows by the factor of 2n . To the contrary, as shown in Fig. 3, when either forward primer or reverse one is specific, it is difficult for the polymerase to accomplish the reaction. When the sequence of one primer is not matching the partial sequence of the nontarget, even if the other primer is matching the non-target, the quantity of its wrong product is proportional to at most 2n after n-cycle PCR. Thus, in PCR, only when the mis-hybridization reaction on both primers takes place, the wrong product is amplified. Namely, we can say that the reaction induced by 2 sequences contributes to the total reaction in PCR. In other words, the elongation reaction in PCR is influenced by the specificity of 2 sequences. Hence, we must select the sequence that has a unique and short sequence on either edge as an optimal sequence. Besides that, the amplified product can be distinguished in length. Even if several regions of target or non-target genes are amplified at a time, it is still possible to discern their existence by observing their product length. In other. The goal is to find a unique product as short as possible, which exists only once on the target genes. The algorithm processed on each CE is shown as follows. It is computationally demanding to naively compare all partial sequences of the target genes with one another. Hence, we take the following strategy to find such sequences rapidly. At first, the number of the combinations of sequences to be compared with each other is reduced by hashing all the genomic information. Next, an algorithm like radix sort processes the comparison among sequences on each computing element. Finally, all the results are gathered and candidate sequences are selected. Our method is composed of 3 steps, described as follows: (1) make a Look Up Table (LUT) from the whole genomic information; (2) calculate Unique Sequence Length (USL) by using the algorithm like radix sort; (3) select the candidate sequences for a primer. 3.1 Construction of LUT for Pair of Primers Here, we explain how a LUT for a primer-pair is made by using the whole genomic information of the target organism. Once the LUT for target sequences are made, all the sequences having the same hash-key are rapidly found. As described above, the hybridization of the consecutive sequence in the 3’-end region of a primer is most important in the total PCR. Moreover, the uniqueness of the product length must be ensured. Therefore, as shown in Fig. 4, we make a hash-key sequence by concatenating one edge sequence with another one on a PCR product when making LUT. Namely, we use the se-.
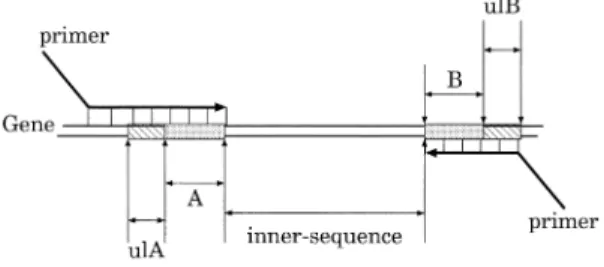
(4) Vol. 44. No. SIG 6(ACS 1). Finding Unique PCR Products on Distributed Databases. quence A + B as a hash-key. Now, we call the sequence intercalated between A and B “innersequence”. As shown in this figure, the 3’-end sequence of the forward primer is sequence A and that of the reverse primer is sequence B. On one hand, we can select a large value as the length of inner-sequence in order to amplify a sequence for cloning and sequencing. On the other hand, we can select a small value in order to amplify a sequence for gene expression pattern observation in PCR. Besides that, when the size of inner-sequence is assigned to 0, we can evaluate the specificity of the probes for Ligase Chain Reaction (LCR). The LUT is made as follows. Suppose that there is an organism that has l genes. The gene of the target organism is described as gi , i = 1, . . . l. The length of each gene is given as |gi | = mi and the nucleotide of position j from the 5’end of gene i is specified as gi (j), gi (j) ∈ { a,t,g,c }. Now, the LUT for all the positions of all the genes, j = 1, . . . , mi , i = 1, . . . , l, is made. Each subsequence gi (j) . . . gi (j + h − 1)gi (j + h + s) . . . gi (j + 2h + s − 1) of position j from the 5’-end of gene i is used as the hash-. Fig. 4. This illustration shows how to assign a hashkey sequence on target gene sequences. The sequence composed of both edge sequences of all partial sequences on the targets are allotted to a hash-key sequence. Namely, the concatenated sequence A + B is used as the hash-key sequence. These hash-key sequences are used as the 3’-end sequence of each primer. The matching length from the hash-key sequence in each direction is given as the unique length of A (ulA) or the unique length of B (ulB), respectively. The size of ulA + ulB is used as the criterion.. 37. key sequence for LU T (i, j). The length of the hash-key sequence is assigned to 2h, that is, the length of A + B is 2h. The length of the innersequence is s. The LUT includes a pointer to the next position at which the same hash-key sequence appears. All the positions that have the same hash-key sequence are quickly found only by searching the LUT. The size of the LUT is proportional to that of the target. An example of the algorithm in detail is shown as follows. Let us assume that there is an organism that has a very short genome “5’-tgaatgcgaaccccaacgcgaataccaacgctaatat-3’ ”. Here, the size of hash-key is appointed 4, h = 2. Namely, the size of the 3’-end sequence of the primers each is 2. The size of inner-sequence is 4, namely, s = 4. The LUT is composed as shown in Fig. 5. ‘1’ means terminal signal in LUT. If this signal occurs in LUT, after that, no sequence including the same hash-key sequence exists. Now, let us find the hash-key sequence, ‘aaaa’, namely sequence ‘aa----aa’. Here, ‘----’ means an arbitrary sequence whose length is 4. At first, this sequence appears at position 3. Next, we can find it at position 9 on the genomic sequence only by looking at the LUT. The pointer to the next position is given at position 3 of the LUT. Similarly, all the positions, 15, 21 and 27, where ‘aa----aa’ appears, are found by using the LUT. 3.2 Calculation of Unique Sequence Length (USL) for Pair of Primers Here, the problem is how to calculate the value of USL. The method that naively compares all the sequences with each other spends a great deal of computation time. Thus, we describe an effective method to calculate the value of USL by using an algorithm based on radix sort. Now, as shown in Fig. 4, let us consider subsequence gik (j) . . . gik (j + h − 1)gik (j + h + s) . . . gik (j + 2h + s − 1) of gene gik as a hashkey sequence. The hash-key sequence is assigned to the sequence of the 3’-end region of. Fig. 5 An example of the LUT for a pair of primers..
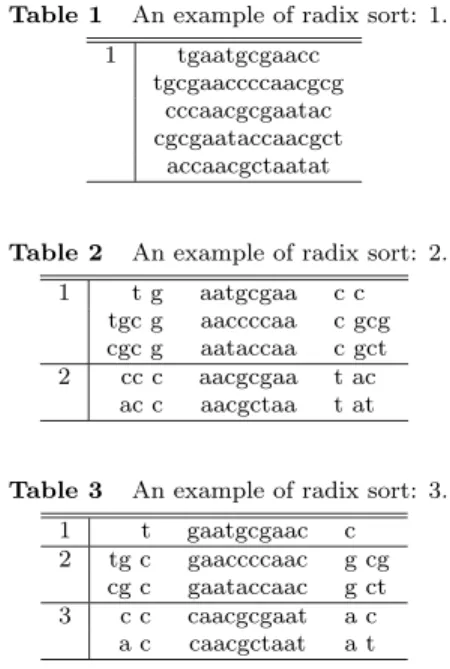
(5) 38. IPSJ Transactions on Advanced Computing Systems. primer. Suppose that a hash-key sequence, H, appears n times on the genome as subsequence gik (j) . . . gik (j + h − 1)gik (j + h + s) . . . gik (j + 2h + s − 1) of gene gik , k = {1, . . . , n}. Here, the following is done for every hash-key. In the following, ‘:=’ represents substitution. sk (2x − 1) := gik (jk − x) sk (2x) := gik (jk + 2h + s − 1 + x) k = {1, . . . n} x = {1, . . . T h} T h means the threshold where the comparison stops. Initially, ul := 0. Here, unique length (ul) stands for the total matching length, ulA + ulB, as shown in Fig. 4. In other words, ulA represents the matching length from the 5’-end of the hash-key and ulB represents the matching length from the 3’-end of the hash-key. N = {1, . . . , n} is the set of all the positions where the same hash-key occurs. Rr is a subset of set N , and r = {a, c, g, t}. r signifies the name of sorting buckets. Now, the sorting function SORT(N, ul) is called. In regard with the sorting method to design a pair of primers, we have already discussed it in our recent work6) . SORT(N , ul) ( 1 ) ul := ul + 1. ( 2 ) If the size of N is 1, then subsequence sk (ul) . . . sk (1)H, k ∈ N is a unique sequence, whose length is ul + h. ( 3 ) Initially, Rr := φ for all the elements of r = {a, c, g, t}, and the following is done for all the elements of N , k ∈ N, r = {a, c, g, t}. ( a ) If sk (ul) is nucleotide ‘a’, then Ra := Ra ⊕ k. ( b ) If sk (ul) is nucleotide ‘c’, then Rc := Rc ⊕ k. ( c ) If sk (ul) is nucleotide ‘g’, then Rg := Rg ⊕ k. ( d ) If sk (ul) is nucleotide ‘t’, then Rt := Rt ⊕ k. ( 4 ) If the size of Ra is more than 1, then call the function, SORT(Ra , ul) . ( 5 ) If the size of Rc is more than 1, then call the function, SORT(Rc , ul) . ( 6 ) If the size of Rg is more than 1, then call the function, SORT(Rg , ul) . ( 7 ) If the size of Rt is more than 1, then call the function, SORT(Rt , ul) . The minimum length of a unique sequence is calculated by the above method.. Table 1. An example of radix sort: 1. 1. Table 2 1. 2. 3. tgaatgcgaacc tgcgaaccccaacgcg cccaacgcgaatac cgcgaataccaacgct accaacgctaatat. An example of radix sort: 2. tg tgc g cgc g cc c ac c. Table 3 1 2. May 2003. aatgcgaa aaccccaa aataccaa aacgcgaa aacgctaa. cc c gcg c gct t ac t at. An example of radix sort: 3. tg cg c a. t c c c c. gaatgcgaac gaaccccaac gaataccaac caacgcgaat caacgctaat. c g g a a. cg ct c t. For instance, we consider the organism that has the very short genome “5’-tgaatgcgaaccccaacgcgaataccaacgctaatat-3’ ”. The size of hashkey is 4 and that of inner-sequence is 4. Here, let us make a comparison among partial sequences including ‘aa----aa’. 5 partial sequences including ‘aa----aa’ are found on this genome by using LUT. Hence, if executed naively, the comparison of 10 combinations should be processed. Now, the comparison is executed using the proposed algorithm like radix sort as follows. 5 partial sequences including ‘aa----aa’ are shown in Table 1. At first, these sequences are sorted on the basis of their character next to both edges of the hash-key sequence, ‘aaaa’, as shown in Table 2. The sequences that have character ‘g’ left to ‘aa----aa’ and ‘c’ right to it are sorted in row 1. The sequences that have ‘c’ and ‘t’ on each edge are sorted in row 2. Next, after ul := ul + 1, these sequences are sorted in the same manner in each row. The result is shown in Table 3. In row 1 of Table 3, only one sequence exists. Then, this sequence is unique and its USL is 4, namely, on this condition in product length, if the matching length of the 3’-end region of either forward primer or reverse primer is beyond 3, this product becomes unique on the whole genome. The final result is shown in Table 4. 3.3 Sequence Selection for Primer Finally, we select the sequences that have the.
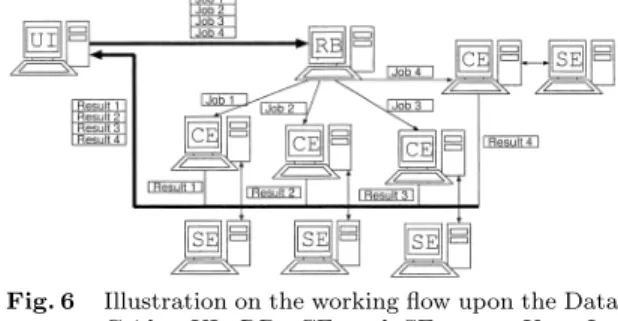
(6) Vol. 44. No. SIG 6(ACS 1). Table 4. 1 2 3 4 5. USL 4 6 6 5 5. Finding Unique PCR Products on Distributed Databases. 39. The result of the example of radix sort. USL means Unique Sequence Length. t t c c a. gaa gcgaa gcgaa ccaa ccaa. Sequence tgcg cccc tacc cgcg cgct. aac aacgc aacgc aata aata. c g t c t. small value of USL. The partial sequence whose value of USL is small befits a primer candidate. This operation is executed on the entire target genome. 4. Deployment on the European Data Grid The goal of the European Data Grid Project12) is the development of a novel environment to support globally distributed scientific exploration involving multi-PetaByte datasets. The project is designing and developing middle-ware solutions and testbeds capable of scaling to handle PetaBytes of distributed data, tens of thousands of resources (processors, disks, etc.), and thousands of simultaneous users. DataGrid biomedical work package gathers biologists, computer scientists, physicians and physicists around the common goal of deploying a biomedical grid9) . We describe the structure of the European Data Grid (EDG) in Fig. 6. The EDG is mainly composed of 4 computing elements: User Interface (UI), Resource Broker (RB), Computer Element (CE) and Storage Element (SE). At first, a user belonging to the EDG can contact with all the machine through a UI machine in place. On the UI machine, all the necessary commands to issue jobs upon the EDG are furnished. In other words, all the users hoping to process their jobs on the EDG have to use a UI machine as an entrance for this environment. Next, all the jobs issued with the UI are sent to a RB machine. The RB machine having received the commands from the UI seeks for available computer resources, that is, CEs, and schedules all the jobs. When the RB machine finds an available CE, it sends one of the jobs to this CE. The CE machine processes the received jobs using its Working Node (WN) machines. If the CE machine is ordered to use some databases, it seeks for the SE having the requested data and orders them. Finally, the termination of the calculation is reported to the UI through the RB and the user can gather all the results on the UI machine.. Fig. 6. Illustration on the working flow upon the Data Grid. UI, RB, CE and SE mean User Interface, Resource Broker, Computing Element and Storage Element, respectively.. Every machine on the EDG must have their own server certificate. All the users hoping to issue commands on the EDG have to obtain their own user certificate. Moreover, every user must also obtain their own account on a UI machine. After obtaining the certificate and connecting a UI machine, one can be authorized by grid-proxy-init command. Once one has been authorized, all the resources on the EDG come to be available. 5. Implementation In this section, we describe the program executing the proposed method and its implementation on the EDG. At first, we describe an implementation of our proposed algorithm on the EDG. Next, the computing environment and the working flow of the program are shown. 5.1 Implementation of Our Proposed Algorithm The goal is to find a unique product from among databases distributed on networks. It is computationally intractable to gather all the genomic sequences upon one computer and naively compare all partial sequences with one another. Hence, we take the following strategy to find such sequences rapidly. At first, all of the target genomic sequences are hashed and decomposed into some smaller parts on each database. Next, the partial sequences that have the same hash-key sequence are gathered from among all the target databases and linked on a computer. An algorithm of radix sort makes a comparison among sequences on the computer. Our program is composed of 2 steps, described as follows: (1) All of the target genomic sequences are hashed and divided into smaller files; (2) The partial sequences that have the same hash-key are linked and Unique Sequence Length (USL) is calculated by using the radix sort algorithm..
(7) 40. Fig. 7. IPSJ Transactions on Advanced Computing Systems. The illustration on hashing and dividing function. One of the target genomes is located on one of the SEs. Each target genome stored on the SE is sent onto a CE. The sequences of the target genome are hashed and divided into smaller files based on hash-key on the CE. All the hashed and divided sequences are put back onto their SE. The function is processed for every target genome individually.. 5.1.1 Hash and Divide Firstly, every target genomic sequence is hashed and divided. Figure 7 illustrates the flow of processing target genome. The following function is individually processed for all the target genomes stored in a distributed environment. In a first step, the target genome is stored on a Storage Element (SE). The target genome is divided into some files. In this paper, each SE is regarded as one of the distributed databases and deals with one file of the divided target genome. Next, the target genome is brought onto a Computing Element (CE) from the SE. The sequence is hashed and decomposed into some smaller files based on hash-key sequence on the CE. Each file has its own hash-key sequences and has the same number of hash-key as each other. At last, all the hashed files are stored back onto the SE. 5.1.2 Link and sort Secondly, the partial sequences having the same hash-key are gathered and linked on a CE. Figure 8 shows the way of linking the partial sequences having the same hash-key. At first, the partial sequences having the same hashkey as each other are gathered onto a CE from among the hashed and divided sequences on all the target databases. These partial sequences are linked with each other on the basis of their hash-key and sorted on the CE. For instance, as shown in Fig. 8, CE 1 gathers all the partial sequences having the hashkey 1 from among all the SEs. Next, the CE links these partial sequences and sorts them. Since the target genomic sequences are made smaller files by hashing and dividing function,. Fig. 8. May 2003. The illustration on linking and sorting function. Each CE gathers all the partial sequences having the same hash-key from among the target distributed databases. Then, the sequences are linked and sorted on each CE. Each linking and sorting function is processed in parallel.. it is sufficient to process only the partial sequences having the same hash-key at once instead of the whole genomic sequences. Therefore, it is possible to handle them without consuming a large amount of memory space. While CE 1 is processing all the partial sequences having the hash-key 1, CE 2 is also able to process all the partial sequences having the hash-key 2 individually. According to hash-key, every sequence can be processed in parallel. 5.2 Calculation Environment The environment of the European Data Grid was installed and configured with LCFG server box13) . LCFG is one of the standard installation systems of the Data Grid environment. Once the LCFG server is installed, it automatically provides all the client machines with all the provisions to bootstrap. Moreover, all the client machines are automatically maintained and configured by the LCFG server. In this research, the Data Grid environment based on Globus 2 beta was installed through the LCFG server. All the main elements, such as User Interface (UI), Computing Element (CE), Storage Element (SE) and Working Node (WN) are installed and configured with this system. For the moment, Redhat Linux 6.2 is supposed to be installed into all the machines used on the Data Grid environment. All the calculation was processed in the environment of Fig. 9. First of all, we issued all the commands from a UI machine located in the European Organization for Nuclear Research (CERN) in Switzerland. Every job was sent to the RB machine located in CERN. This machine scheduled and dispersed all the jobs to available CEs.
(8) Vol. 44. Fig. 9. No. SIG 6(ACS 1). Finding Unique PCR Products on Distributed Databases. Illustration on the Data Grid environment used in this experiment. First of all, all the tasks are sent to the RB from the UI. Next, the RB allocates them to available CEs at that time. The CEs can use SEs in order to read and write target genomic data and temporary files. Each SE is regarded as a distributed database and has one of the hashed data files. At last, the termination of all the calculation is reported to the UI and all the results are gathered. The CE machines located in the other EDG sites can also be used.. on the Data Grid. The CE machine contacts SE machines when reading and writing files. Each CE processed the job received from the RB and returned the result to the UI. In this experiment, the SE machines, which are located in CERN, in the Instituto Nazionale di Fisica Nucleare (INFN) in Italy and in the National Institute for Nuclear Physics and High Energy Physics (NIKHEF) in Netherlands were used. The speed of local file transfer in CERN, INFN and NIKHEF was about 60 Mbps. The speed of file transfer between the machines of INFN and the machines of CERN was about 12 Mbps. The speed between NIKHEF and CERN was about 7 Mbps. The speed between NIKHEF and INFN was about 11 Mbps. The best effective bandwidth is measured by means of globus-url-copy command using a file of about 47 MB. Each job is allotted to one of the available CPUs by the RB. The specification of the machines is described at the European Data Grid web site15) . 5.3 Working Flow The working flow of the program is shown in Fig. 10. First of all, the target genomic sequence is fetched from a public database and it is divided and stored on a SE. In this experiments, S.. Fig. 10. 41. The illustration on the data flow of our program. At first, all the sequences of the target genome are fetched from a genome database and they are divided and stored on SE machines. Each divided genomic file is hashed and classified into some smaller files on the basis of their hash-key upon each SE. Next, each file is sent to an available CE and sorted. At last, all the results are reported. In this experiment, S. cerevisiae genome is analyzed. This genome is divided into 3 files and stored on the SEs.. cerevisiae genome was fetched, divided into 3 files, which having 2240, 2240, 2239 ORFs, respectively. These files were stored on the SE of CERN, RAL and NIKHEF, respectively. Each genomic sequence file is hashed and divided on the basis of hash-key on a CE. All the processed data are brought back to each SE. Next, a CE looks for all the partial sequences that have the same hash-key from among all the hashed databases. As shown in Fig. 10, CEs processed every hash-key sequence in parallel from among 3 SE databases. All the files that include the partial sequences having the same hash-key are linked and sorted on the CE. Finally, the results, the values of USL, are sent back to the UI machine. 6. Result In this section, the calculation result is given. We tried to discover unique product sequences on the whole genome of S. cerevisiae (9.5 MB) by using the proposed method. The length of the hash-key sequence, h, was assigned to 3. The limit of the maximum length of unique sequence length was assigned to 50-mer. The length of inner-sequence, s, was 2000. The sequences whose length was beyond this threshold.
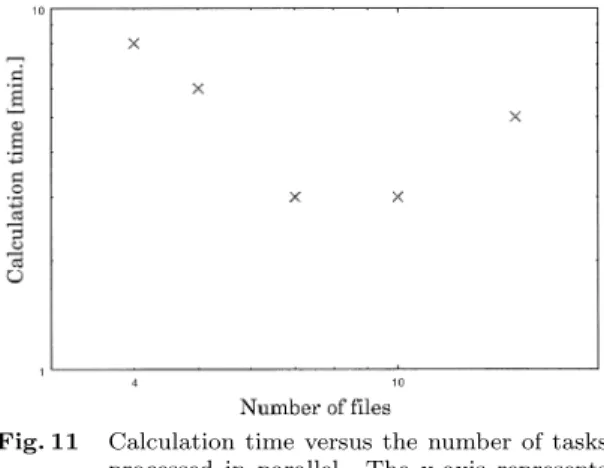
(9) 42. IPSJ Transactions on Advanced Computing Systems. May 2003. inner-sequence length is 0. This result means any unique sequence for probe can not be designed for these genes. These genes can not be specifically detected by hybridization reaction. However, it is possible to specifically distinguish their correct products from wrong products by PCR. That is to say, we can make no target specific probe but a target specific primer-pair for these genes. 7. Discussion Fig. 11. Calculation time versus the number of tasks processed in parallel. The x-axis represents the number of files split by the hashing and dividing function. Each file has the same number of hash-key as each other. The yaxis represents the calculation time in parallel, namely, it is the time to link and sort the target gene sequence.. Table 5. ORFs that do not have any unique sequences as probes but have a unique sequence-pair on condition that the value of inner-sequence be 2000.. TyB Gag-Pol protein similar to subtelomeric encoded proteins. were removed. To begin with, the whole genomic file was divided into 3 smaller files and stored on the SE each. Each file was hashed on the basis of hashkey sequence. It took about 7 minutes to do this calculation. The total size of the hashed file of S. cerevisiae genome became about 60 MB. About 20 MB each were store back to its SE. In this experiment, each file was divided into smaller files on the basis of hash-key sequence. The number of hash-key that each file has was the same as each other. Figure 11 shows the total calculation time to complete the linking and sorting function. The x-axis represents the number of files divided by the hashing and dividing function. That is to say, the tasks can be processed in parallel by this number. The y-axis represents the total calculation time in parallel, namely the time to link and sort. The smaller each file was divided, the less time was consumed until the number of the divided files becomes 10. Table 5 shows the ORFs that do not have any unique sequences as probes but have a unique sequence-pair on condition that the value of inner-sequence be 2000. No unique sequence was found for these genes when the. In our proposed method, the uniqueness of sequences was guaranteed on the whole target. This method deduced the minimum length of every unique sequence on the target and we used the length of the unique sequences as criteria of the specificity of them. We made much of the 3’-end region of the sequence for primer and described how to realize it. It is important to find unique sequences on genome in order to design primers and probes. Suppose that there are some sequences, which are not unique on their target genome, but seems to be suitable for primers and probes according to GC contents and secondary structure. If such sequences are used as primers, wrong products are made. On the other hand, once a unique sequence pair has been found in advance, it is possible to verify its biological characteristics, such as hybridization energy, melting temperature (Tm), secondary structure and so forth, without any risk of wrong products. Hereafter, we will make this method take into consideration single gap and single mismatch in the 5’-end region. Furthermore, this method can be applied to probe design by considering the hybridization reaction of the whole sequence, not only in 3’-end region. As for the method to find the unique sequence, suffix tree (or suffix array) is useful and popular one. In fact, there are some methods to design optimal DNA oligo primers by using suffix array2) . However, a large amount of DNA sequences are to be unveiled more and more. The more the quantity of genomic information increases, the more the computer power is required. Hence, it will be inevitable not only to invent a rapid algorithm to analyze the information but also to develop methods to implement and process it in a distributed computing environment, such as the Data Grid. We described that our primer-pair design method was easily processed in parallel for each inner-sequence value and implemented on the.
(10) Vol. 44. No. SIG 6(ACS 1). Finding Unique PCR Products on Distributed Databases. EDG. As a target genome, we used S. cerevisiae genome. In order to process larger genomic information, such as human genome, a larger amount of memory resource is required. However, according to each inner-sequence length, each calculation can be processed in parallel. Moreover, in regard with target genome size, the problem can be divided into smaller tasks on the basis of hash-key. Once the target genome has been hashed, each problem can be sorted individually. The number of tasks processed in parallel is limited by the length of hash-key. When the length is assigned to n, the hashed target genome is divided into at most 4n files. The size of each file can be 4n times less than that of the hashed target genome. These files can be processed in parallel. Therefore, even if the target genome becomes much larger, it is feasible to process them in parallel by making the hash-key size larger. For instance, in this paper, the hash-key length was assigned to 7. The total file size of the hashed target genome became about 60 MB. Therefore, it is possible to divide the genomic files into at most 47 = 16, 384 pieces of 4 KB each. In a nutshell, (l + 1) × 4n commands can be issued at once if there exist enough CEs. If the uniqueness of products was investigated between 0 to 2000mers. Therefore, 2001 × 47 = 32, 784, 384 commands for sorting can be issued at once. In regard with the parallelism, as seen from Fig. 11, until the number of the divided files becomes 10, the total calculation time decreases on EDG. Because the amount of the task that each computer processes decreases when the size of each file gets small. After that, as the number of the divided files augments, the total calculation time increases. When many tasks are simultaneously issued, they can be assigned to available CEs located in the sites far from target genomic databases, such as CCIN2P3 and INFN15) . In addition, in general, the smaller the file size is, the lower the effective bandwidth of network becomes. That is the reason why the calculation time increases when the whole process is divided into much smaller pieces. Acknowledgments We are grateful to the members of the European Data Grid project, especially, the fellows of the biomedical work package group for their valuable advice. References 1) Allawi, H.T. and SantaLucia, J.J.: Thermody-. 43. namics and NMR of Internal G.T Mismatches in DNA, Biochemistry, Vol.36, pp.10581–10594 (1997). 2) Fugen, L. and Stormo, G.D.: Selection of optimal DNA oligos for gene expression arrays, Bioinformatics, Vol.17, pp.1067–1076 (2001). 3) Griffais, R., Andre, P.M. and Thibon, M.: Ktuple frequency in the human genome and polymerase chain reaction, Nucleic Acids Research, Vol.19, pp.3887–3889 (1991). 4) Hosaka, N., Kurata, K. and Nakamura, H.: Comparison of Methods for Probe Design, Genome Informatics, Vol.12, pp.449–450 (2001). 5) Kurata, K. and Nakamura, H.: Novel Method for Primer/Probe Design, Genome Informatics, Vol.11, pp.331–332 (2000). 6) Kurata, K., Dine, G., Saguez, C. and Nakamura, H.: Rapid Analysis of Specificity of PCR Product on the Whole Genome, Proc. PDPTA, CSREA Press, Las Vegas, pp.246–252 (2002). 7) Mitsuhashi, M., Cooper, A., Ogura, M., Shinagawa, T., Yano, K. and Hosokawa, T.: Oligonucleotide probe design—a new approach, Nature, Vol.367, pp.759–761 (1994). 8) SantaLucia, J.J.: A unified view of polymer, dumbbell, and oligonucleotide DNA nearestneighbor thermodynamics, Proc.Natl.Acad.Sci. USA, Vol.17, pp.1460–1465 (1998). 9) Breton, V., Montagnat, J. and Medina, R.: DataGrid, prototype of a biomedical Grid, Proc. Synergy between bioinformatics, medical informatics and neuroinformatics, Brussels, December 2001, submitted to Methods of information in medicine (2001). 10) Foster, I., Kesselman, C. and Tuecke, S.: The Anatomy of the Grid, International Journal of High Performance Computing Applications, Vol.15, No.3, pp.200–222 (2001). 11) Foster, I.: The Grid: A New Infrastructure for 21st Century Science, Physics Today, pp.42–47, Vol.54, No.2 (2002). 12) Segal, B.: Grid computing: the European data project, IEEE Nuclear Science Symposium and Medical Imaging Conference, Lyon, France, pp.15–20 (2000). 13) Iven, J.: WP4 Interim Installation Solution. http://datagrid.in2p3.fr/distribution/datagrid/ wp4/installation/doc/ 14) The DataGrid Project. http://eu-datagrid.web.cern.ch/eu-datagrid/ 15) Testbed status. http://marianne.in2p3.fr/ datagrid/giis/giis.html. (Received September 23, 2002) (Accepted February 18, 2003).
(11) 44. IPSJ Transactions on Advanced Computing Systems. Ken-ichi Kurata received the BE degree in Applied Mathematics in 1998 and the MS degree in Physics in 2000 from the University of Tokyo. He belongs to Laboratoire M.A.S, Ecole Centrale de Paris since 2001. He is a member of the biomedical group of the European Data Grid project. His research interests include bioinformatics and high-performance computing. He is a member of the IPSJ. Hiroshi Nakamura received the BE, ME, and Ph.D. degree in Electrical Engineering from the University of Tokyo in 1985, 1987, and 1990 respectively. From 1990 to 1996, he was a faculty of Institute of Information Sciences and Engineering at University of Tsukuba, where he was a member of CP-PACS project. He is currently an Associate Professor of Research Center for Advanced Science and Technology at the University of Tokyo. His research interests include computer architecture, high-performance computing, and bioinfomatics. He received the best paper award from IPSJ in 1994 and Sakai Special Researcher Award from IPSJ in 2002. He is a member of the IEEE, the ACM, the IEICE, and the IPSJ.. May 2003. Vincent Breton received his Engineer degree from Ecole Centrale de Paris in 1985 and his Ph.D. in Nuclear Physics from the University of Paris XI-Orsay in 1990. From 1990, he has been a research associate at the French National Center for Scientific Research (CNRS). After participating for 10 years to high energy and nuclear physics experiments at University of Stanford, Thomas Jefferson Laboratory (USA) and CERN (Switzerland), his focus shifted towards the application of grid technology to biomedical sciences. Leader of the biomedical work package of the European DataGrid project, he has chaired the first European conference on grids for health..
(12)
図

+5


関連したドキュメント
Here we purpose, firstly, to establish analogous results for collocation with respect to Chebyshev nodes of first kind (and to compare them with the results of [7]) and, secondly,
The reason all coherent 2-groups with the same underlying weak 2-group are isomorphic is that we have defined a homomorphism of coherent 2-groups to be a weak monoidal functor,
In this paper, we generalize the concept of Ducci sequences to sequences of d-dimensional arrays, extend some of the basic results on Ducci sequences to this case, and point out
In fact, we have shown that, for the more natural and general condition of initial-data, any 2 × 2 totally degenerated system of conservation laws, which the characteristics speeds
We study the classical invariant theory of the B´ ezoutiant R(A, B) of a pair of binary forms A, B.. We also describe a ‘generic reduc- tion formula’ which recovers B from R(A, B)
In Section 3, we employ the method of upper and lower solutions and obtain the uniqueness of solutions of a two-point Dirichlet fractional boundary value problem for a
For X-valued vector functions the Dinculeanu integral with respect to a σ-additive scalar measure on P (see Note 1) is the same as the Bochner integral and hence the Dinculeanu
Henson, “Global dynamics of some periodically forced, monotone difference equations,” Journal of Di ff erence Equations and Applications, vol. Henson, “A periodically
