Particulate Organic Carbon and Chlorophyll
from Lat. 28° to 2°N in the Western Pacific
Ocean in 1991
著者
ICHIKAWA Toshihiro, KAMIYA Kyoko
journal or
publication title
南太平洋海域調査研究報告=Occasional papers
volume
23
page range
73-78
URL
http://hdl.handle.net/10232/16787
"Man and the Environment in Papua New Guinea"
PARTICULATE ORGANIC CARBON AND CHLOROPHYLL FROM LAT. 28° TO 2°N IN THE WESTERN PACIFIC OCEAN IN 1991
Toshihiro ICHIKAWA and Kyoko KAMIYA
Introduction
A number of oceanographic surveys were made in the tropical and subtropical western Pacific Ocean by various agencies and universities of Japan. Most of the observations were
physical or chemical, and biological data in this area still seems to be limited. NAKAJIMA
(1973) collected the data on suspended matter and chlorophyll in the wide area of the western
North Pacific Ocean. ICHIKAWA and SUZUKI (1991) reported the distributions of particulate organic carbon (POC) and chlorophyll from 24°N to the equator in the western Pacific Ocean during a cruise for the project "Man and the environment in Papua New Guinea". The data
on POC and chlorophyll reported here was obtained from almost the same area as in the
previous year's survey. The observed area included the Kuroshio Counter Current, the North Equatorial Current, the Equatorial Counter Current, and the South Equatorial Current. We
described characteristic distributions of POC, chlorophyll (phytoplankton standing crop), and nutrients in the water column down to a 500 m depth observed in eleven sampling
stations.
Materials and Methods
The study is based on data obtained from November to December in 1991 during a
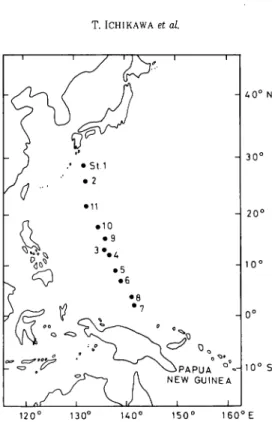
research cruise to Papua New Guinea on board the Keiten Maru of Kagoshima University. The sea water samples were collected at eleven oceanographic stations with a series of Niskin water samplers, 10 liters in capacity (Fig. 1). The eleven different sampling depths were
taken from water columns down to a 500m depth in each of the stations. The water samples
were drained into 10 liter polyethylene bottles, and every four liters of sea water was filtered
immediately through a Whatman GF/C glass fiber filter on board for POC and chlorophyll
analyses. The filter was stored in a deep freezer and the analyses were done at the shore laboratory. The POC concentrations were determined by wet oxidation with dichromate and concentrated sulfuric acid, and the chlorophyll was measured by a spectrophotometric method. The filtrate was kept frozen in a clean polyethylene bottle and the sea water samples were brought back to the shore laboratory for nutrient determination. All the analyses followed the procedure indicated by PARSONS et al. (1984). The water sampling was carried out with the cooperation of the scientists, students, and crew of the ship.
Results
Current structure
The current structure in the open ocean is generally examined by the slopes of isobaric surfaces calculated by temperature and salinity. Although the geostrophic computation was not reported in the present observation, major current zones can be roughly estimated by the
T. ICHIKAWA et al. PAPUA « NEW GUINEA l_ 4 0° N 30° 20° 10° 10° S 120° 130° H0° 150° 160°E
Fig. 1. Locations of sampling statios occupied during the cruise of the R. V. Keiten Maru Nov. 1-Dec. 6, 1991.
distributions of temperature and salinity observed by YUWAKI et al. (1990), and HiGASHi et
al. (1991). The present section may be divided into four major current zones : (1) the South
Equatorial Current, from the southern end of the section (2°N) to 4°N, (2) the Equatorial
Counter Current, between 4°N and 8°N, (3) the North Equatorial Current, between 8°N and 25°N, (4) the Kuroshio Counter Current, from 25°N to the northern end of the section (28°
N). We utilized this estimation in the following discussion. For details of the distributions
of temperature and salinity, refer to the original reports cited above.
Chlorophyll a (Fig. 2)
The chlorophyll concentration in the surface 50m layer was usually low, less than 0.05
f*g/\ through the section, except for the area near the equator. The concentration in the
surface layer was the lowest in the North Equatorial Current. The remarkable chlorophyll maximum was found through the entire section in the depth range of 50-150 m. The concentration of the chlorophyll maximum layer was in the range of 0.1-0.4/^g/1. High
values of chlorophyll contents exceeding 0.3 j^g/l were found at this depth centering 75 m from the southern end of the section to 4°N, in the South Equatorial Current. The chlorophyll maximum values decreased towards north and no concentrations greater than
0.2/^g/l were found from 11°N to 27°N. Below the chlorophyll maximum layer, the concentrations decreased rapidly with depth and chlorophyll contents were less than 0.01 fj-g/1 at the 300 m depth through the section, except near the equator. The chlorophyll distribution in the present study was quite similar to the previous year's observation in almost the same area (ICHIKAWA and SUZUKI, 1991) as the present section.
30°N
Fig. 2 Distribution of chlorophyll a throughout entire section.
300
-400
500 • PO^g-atP/l)
Fig. 3 Distribution of phosphate throughout entire section.
30°N 25° 20° 15° 10c
St.1
76
T. ICHIKAWA et al.
Nutrients (Figs. 3 and 4)
The distribution of phosphate in the surface layer (0-100 m) was low and relatively uniform except in the South Equatorial Current (Fig. 3). The concentration in the Equato rial Counter Current had the lowest value, less than 0.1 ju g-atP/1. The phosphate
concentration in the surface layer in the North Equatorial Current and the Kuroshio Counter Current was quite uniform (0.1-0.2 /-/g-atP/1). On the contrary, in the stations near the equator, the surface concentration showed high values of 0.2-0.7/^g-atP/1.
The phosphate below the 100 m mark increased rapidly with depth and the highest value
was obtained at 500m in the South Equatorial Current. Because the rate of increase was
greater in southern half of the section, the phosphate concentration below the 100 m depth
showed a remarkable regional variation.
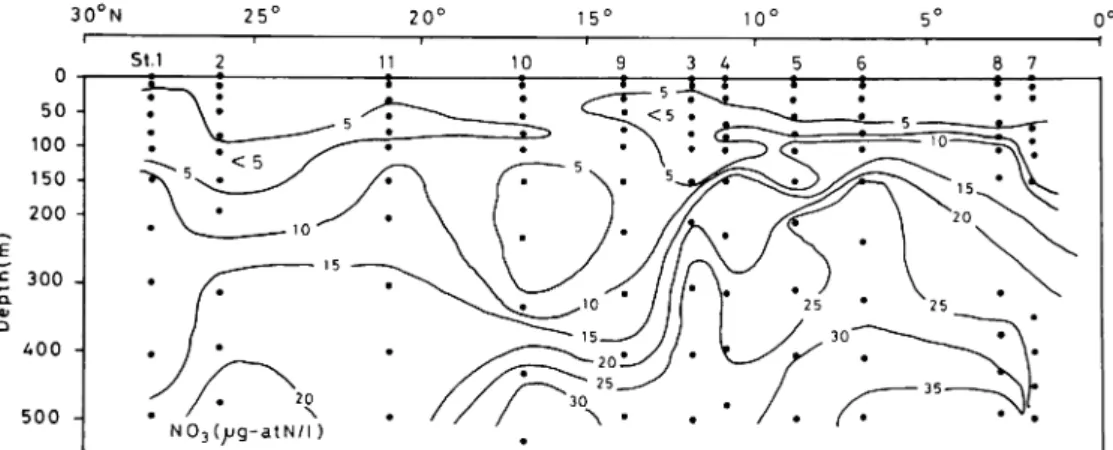
The distribution pattern of nitrate basically resembled the phosphate distribution, but differed in detail in the shallow areas (Fig. 4). The characteristic feature in nitrate distri
bution in the surface layer was the occurrence of a nitrate minimum layer in the 50-100 m
depth range throughout the entire section, this minimum layer coincided in location with the
chlorophyll maximum layer (Fig. 2), and the nitrate concentration in the minimum layer
ranged from almost zero to 5 /^g-atN/1. In the surface mixed layer above the 50m depth, the
nitrate concentration was relatively high, 0.6-10 /^g-atN/1. Particularly in the South Equa torial Current and the Equatorial Counter Current, the surface concentrations showed high
values, greater than 9/^g-atN/l.
Below the nitrate minimum layer, the concentration increased rapidly with depth and the highest value of 40^g-atN/l was found at 500m in the South Equatorial Current. The rate of increase was also grater in the southern half of the section similar to the phosphate
distribution. Compared to the northern part, the concentration value in the southern section
was two times greater.
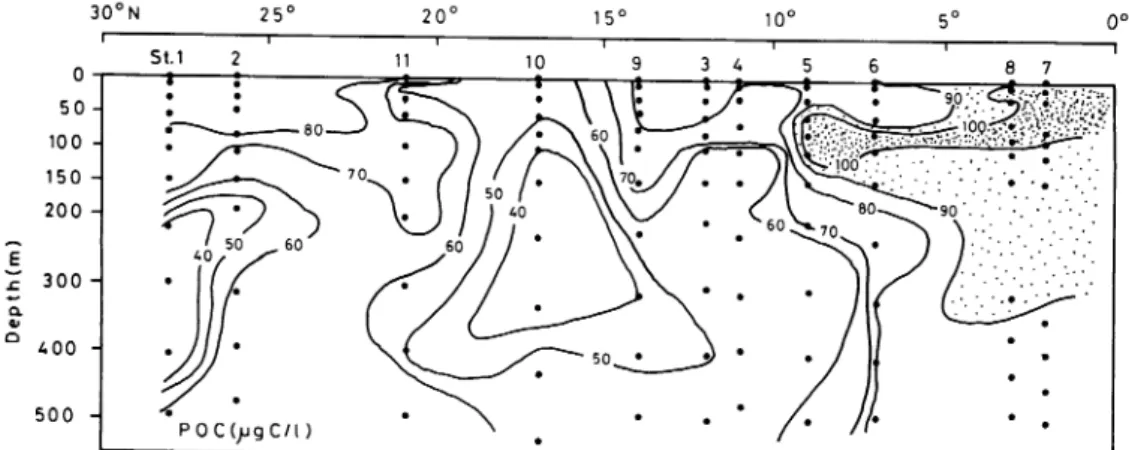
Particulate organic carbon (Fig. 5)
POC concentrations ranged from 18-142/^gC/1. One of the characteristics was that a
distinct regional variation in carbon concentration was found in the section. The carbon
content in the southern part of the section was significantly higher than that of the northern
section. High values of POC exceeding 90/^gC/1 were found only in the southern section
300
400
-500
-POC(>jgC/l)
between 2°N and 9°N. By contrast, low carbon concentration below 50/^gC/l was only
observed in the northern half of the section. A characteristic subsurface carbon maximum
exceeding 100/^gC/l extended to 9°N, and this POC maximum layer coincided with the chlorophyll maximum layer observed simultaneously (Fig. 2). In the case of the northern
half of the section, carbon distribution was not reflected by the chlorophyll maximum layer.
A POC minimum below 40/^gC/l appeared in the 100 to 400 m depth layer in the North
Equatorial Current and the Kuroshio Counter Current. Discussion
The general patterns of POC and chlorophyll distribution in the present results were
comparable to those of the observation by ICHIKAWA and SUZUKI (1991). Very recently, the
Fisheries Agency studied the primary productions and chlorophyll distributions on both sides
of the equator in the western Pacific Ocean (MATUMURA et al., 1992). In spite of the dif ferent analytical methodology, our results of chlorophyll distribution showed a good coin cidence with the data of the Fisheries Agency.
Although the origin of POC in open waterr is mostly phytoplankton in the euphotic layer, many investigators reported that the subsurface chlorophyll maximum layer did not necessarily coincided with the POC maximum layer (NAKAJIMA, 1973 ; ICHIKAWA and
NiSHIZAWA, 1975). However, it is evident that the total amount of POC in the water column
was strongly influenced by the surface productivity (ICHIKAWA, 1989). The carbon distri bution in the present study followed the same tendency described above. The POC maximum layer coincided with chlorophyll maximum layer in the southern half of the section, but in the northern half of the section, this coincidence was not observed. This means the pattern of vertical profile of POC may be affected by both biological and physical factors.
Both of the phosphate and nitrate distributions were rather similar in their vertical variations below the 100m depth. While the phosphate in the shallow layer was very low in the entire section, the nitrate in the surface layer showed unexpectedly high values above
5/^g-atN/l, and the nitrate depleted water was found between 50 and 100m (nitrate min
imum layer). The most rapid increase of nutrients concentration was associated with the depth of thermocline in the tropical area. A well known divergence in the equatorial region transports nutrient rich water to the euphotic zone. It is clearly recognized that the influence
of vertical circulation on surface nutrient contents was reflected by POC and chlorophyll
distribution.
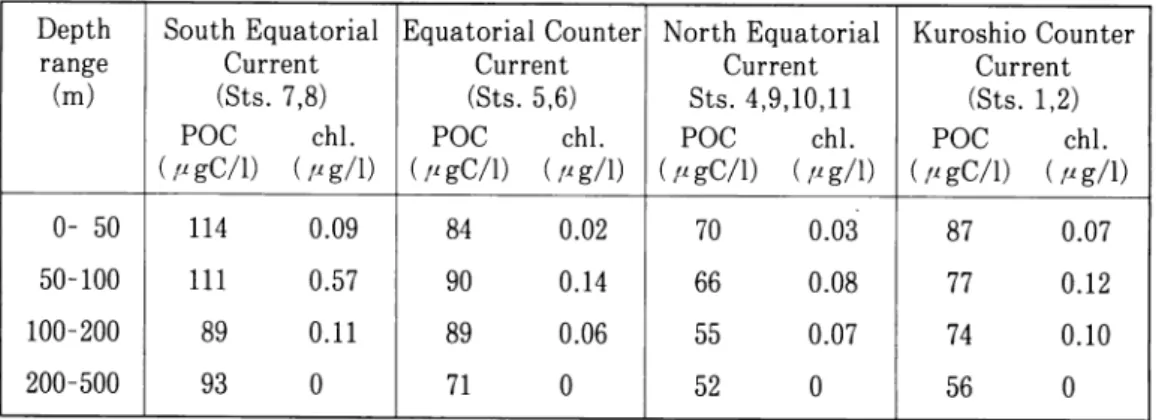
Table 1 shows the areal mean concentrations of POC and chlorophyll in a series of depth
ranges, 0-50m, 50-100m, 100-200m, 200-500m. The calculated mean concentration of chlo rophyll in the water column down to the 200m depth ranged from 0.06 to 0.22 /^g/1. The highest standing stock of chlorophyll appeared in the South Equatorial Current, and the lowest in the North Equatorial Current. The areal mean concentration of POC also showed the highest value in the South Equatorial Current (96 n gC/1) and the lowest value in the North Equatorial Current (56 /*gC/l). This seems to indicate that the total amount of POC in a water column is greatly influenced by the primary productivity in the euphotic layer.
NAKAJIMA (1973) described the concentrations of POC and phytoplankton pigments in the 142°E line in relation to the current structure of the western Pacific Ocean. Our results of the pattern of vertical profiles of POC and chlorophyll were similar to the observation by Nakajima, however, the areal average concentrations of POC and chlorophyll in the present
78
T. ICHIKAWA et al.
Table 1. Areal mean concentrations of POC and chlorophyll in a series of depth ranges,
i.e., 0-50m, 50-100m, 100-200m, and 200-500m. Depth range (m) South Equatorial Current (Sts. 7,8) Equatorial Counter Current (Sts. 5,6) North Equatorial Current Sts. 4,9,10,11 Kuroshio Counter Current (Sts. 1,2) POC chl. (MgC/l) (/ig/1) POC chl. (/igC/1) (/ig/1) POC chl. (/^gC/1) (//g/1) POC (/'gC/D chl. (/-g/D 0- 50 114 0.09 84 0.02 70 0.03 87 0.07 50-100 111 0.57 90 0.14 % 0.08 77 0.12 100-200 89 0.11 89 0.06 55 0.07 74 0.10 200-500 93 0 71 0 52 0 56 0
cruise showed rather high concentrations, 50% in POC and 20% in chlorophyll. If this is valid, we have to assume some process of increase of primary production in the duration of 23 years. More work is needed to evaluate the actual change in the open ocean environment in the western tropical and subtropical Pacific Ocean.
References
HiGASHi, M., Nism, T., MASUMITSU, S. & HlDAKA, M. 1991. Kagoshima Univ. Res. Center
S. Pac, Occasional Papers, 21 : 63-66.
ICHIKAWA, T. 1989. Particulate organic matter in sea water, p. 137-151. In NiSHIZAWA, S.
(ed.), Biological oceanography (in Japanese), Koseisha-Koseikaku, Tokyo.
& NiSHIZAWA, S. 1975. Mar. Biol. 29 : 129-138.
& SUZUKI, H. 1991. Kagoshima Univ. Res. Center S. Pac, Occasional Papers, 21 : 57-62.
Matumura, S., Shiomoto, A., Shimoda, T. & Yonezawa, T. 1992. Abst. Annu. Meet. Oceanogr. Soc Japan, Tokyo.
NAKAJIMA, K. 1973. Mem. Fac. Fish., Hokkaido Univ. 20:1-106.
Parsons, T. R., Maita, Y. & Lalli, C. M. 1984. A manual of chemical and biological
methods for seawater analysis. 173pp. Pergamon Press, New York.
YUWAKI, Y., HiGASHi, S., MASUMITSU, S. & NlSHl, T. 1990. Kagoshima Univ. Res. Center