Observations in Atmospheric Surface Boundary
Layer at Hentona Site during AMTEX
著者
TAKAHASHI Tadao
journal or
publication title
鹿児島大学水産学部紀要=Memoirs of Faculty of
Fisheries Kagoshima University
volume
27
number
1
page range
225-229
別言語のタイトル
国際気団変質実験(AMTEX)中の辺土名観測点におけ
る表面境界層の観測
URL
http://hdl.handle.net/10232/13127
Vol. 27, No. 1, pp. 225—229 (1978)
Observations in Atmospheric Surface Boundary
Layer at Hentona Site during AMTEX*1
Tadao Takahashi*2Abstract
Surface boundary layer measurements at Hentona Site was carried out by Kago shima University Group during AMTEX. Observations in detail are described and a preliminary discussion is presented. Relevant mean values of vertical fluxes of mo mentum, sensible and latent heat correspond quite well to synoptic weather situa tion.
1. Introduction
It is a well-known fact that the large amounts of heat and moisture are sup plied from the sea surface to the air over the ocean when a cold dry air flows to the ocean from the continent in winter. In order to study the air mass trans formation in the area around the Southwest Islands of Japan, the plan of AMTEX is proposed by Japanese National Committee for GARP (1971). It is desirable to solve the following four problems: i) mechanism of transfer of the various physical quantities in the surface boundary layer, ii) dynamical and thermal structure of the planetary boundary layer, iii) generation of cumulus clouds and mechanism of transfer of the various physical quantities by cumulus convection, iv) relation between the energy supply from the ocean and generation and de velopment of the meso-scale and medium-scale disturbances.
Thus, AMTEX, planned as an experiment within the GARP subprogramme on air-surface interaction, was carried out in 1974 and 1975 with collaboration of many universities and research institutes in Japan and also with positive parti cipation of several other nations. Among many kinds of observations at di fferent sites, the surface boundary layer measurements at Hentona Site was carried out by Kagoshima University Group, acompanied by a staff of CSIRO,
Australia.
2. Observations in detail
One of scientific requirments for this experiment is to determine accurately the vertical fluxes of momentum, heat, and water vapour in the surface
boun-1:1 This paper is a part of an article presented to IAGA/IAMAP Joint Assembly, held in Sea ttle, U.S.A., in 1977.
226 Mem. Fac. Fish., Kagoshima Univ. Vol. 27, No. 1 (1978)
dary layer over the sea. Therefore, observation sites should be selected ade quately so as to be able to keep the instruments in good exposure to air flow over the sea surface without any obstacle. For this purpose is selected Hen tona Site, where a sufficiently long fetch for air flow of the winter monsoon can be expected. An observation tower is constructed specially for this purpose on the sea floor where the depth to the bottom is ca 5 m and is situated 250 m apart from a low water shoreline. The surroundings of the site and the struc ture of the tower are described in detail by Takahashi et al. (1976).
Primary items are mean profile and instantaneous fluctuating quantities and an additional item is amount of sea-salt particles in the air.
Wind speed is measured by cup anemometers mounted at four heights (1, 2, 4, 6 m in 1974 and 1, 2, 4, 8 m in 1975) above the sea surface to obtain wind profile. Temperature and vapour pressure are measured by sets of dry and wet bulb of thermister thermometer with radiation shields at three heights (1, 2, 6 m in 1974 and 1, 2, 8 m in 1975) to obtain profiles of temperature and vapour pressure. Instantaneous fluctuating quantities are measured by a supersonic anemometer-thermometer and a copper-constantan thermocouple psychrometer mounted at 5 m height above the sea surface. Instruments of CSIRO are moun ted at 3 m. However, it should be mentioned that the observation level varies all the time according to the tide, since all the instruments are mounted to the tower fixed to the sea floor. Observation signals are transmitted by cable on the sea floor to several recorders setted in a observation hut constructed be hind the windbreak on the long beach. Sea-salt particles in the air flowing from mid ocean are measured almost always at just waterfront on the beach.
Observations are carried out during a period from 14 th of February to 28 th of February in 1974 and from 14 th of February to 1 st of March in 1975.
Analog signals from the supersonic anemometer-thermometer and the ther mocouple psychrometer are converted into digital data at every one-third second
by DATAC-2000S and vertical fluxes of momentum, sensible heat, and latent
heat are calculated by eddy correlation method from these data by FACOM 230-45 S. Latent heat flux is calculated by the simple method proposed by Hanafusa
(1970). Spectra and cospectra are calculated also by FACOM 230-45 S.
Obtained data are reported in AMTEX74 DATA REPORT Vol. 4 and AMTEX' 75 DATA REPORT Vol. 4, published by Management Committee for AMTEX. These DATA REPORTS contain wind direction, one hour mean values of wind speed, temperature, vapour pressure, sea water temperature, and the vertical distance between a height of the instruments at the lowest level and the sea level changing with tide. Furthermore, these contain numerical values of ver tical flux of momentum, sensible heat, and latent heat, obtained by eddy corre
lation method.
Participants in 1974 are G. Kawamura, K. Yoshida, H. Kambara, T. Tsuruno,
Kawamura, H. Kikukawa, T. Tsuruno, K. Moori, M. Hayashi, K. Shirota, and
the author.
3. Preliminary discussion
General outline of the results obtained is described here briefly. Lots of dis
cussions and conclusions derived from relevant analyses will be presented by
individual participants.
For the present purpose, profiles at onshore wind are analysed, taking -z/L
into account, where L is stability length and z positive upwards. Numerical
value of \-z/L\ is almost always less than 0.5 due to small z, though the water temperature is very much higher than that of air usually. Accordingly, profiles
may be expressed by log-plus-linear formula.
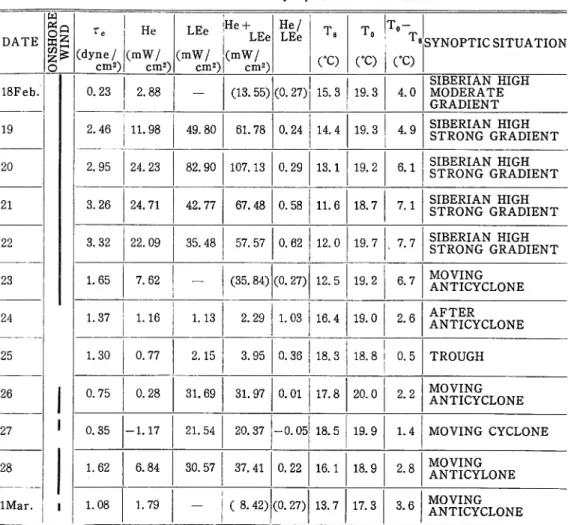
Table 1. Daily mean value of vertical eddy flux obtained by eddy
correlation method and synoptic weather situation
DATE o (dyne/ cm2) He (mW/ cm2) LEe (mW/ cm2) He + LEe (mW/ cm2) He/ LEe T. CO To (°C) T0-T8 CO SYNOPTIC SITUATION 18Feb. 0.23 2.88 — (13. 55) (0. 27) 15.3 19.3 4.0 SIBERIAN HIGH MODERATE GRADIENT 19 2.46 11.98 49.80 61.78 0.24 14.4 19.3 4.9 SIBERIAN HIGH STRONG GRADIENT 20 2.95 24.23 82.90 107.13 0.29 13.1 19.2 6.1 SIBERIAN HIGH STRONG GRADIENT 21 3.26 24.71 42.77 67.48 0.58 11.6 18.7 7.1 SIBERIAN HIGH STRONG GRADIENT 22 3.32 22.09 35.48 57.57 0.62 12.0 19.7 . 7.7 SIBERIAN HIGH STRONG GRADIENT 23 1.65 7.62 — (35.84) (0. 27) 12.5 19.2 6.7 MOVING ANTICYCLONE 24 1.37 1.16 1.13 2.29 1.03 16.4 19.0 2.6 AFTER ANTICYCLONE 25
1
1 1.30 0.77 2.15 3.95 0.36 18.3 18.8 0.5 TROUGH 26 0.75 0.28 31.69 31.97 0.01 17.8 20.0 2.2 MOVING ANTICYCLONE 27 0.35 -1.17 21.54 20.37 -0.05 18.5 19.9 1.4 MOVING CYCLONE 28 1.62 6.84 30.57 37.41 0.22 16.1 18.9 2.8 MOVING ANTICYLONE IMar. 1 1.08 1.79 - 1(8.42)(0. 27) 13.7 17.3 3.6 MOVING ANTICYCLONE228 Mem. Fac. Fish., Kagoshima Univ. Vol. 27, No. 1 (1978)
Numerical values of vertical flux obtained by profile method of log-plus-linear formula coinside passably with those obtained by eddy correlation method on the average, though there are lots of scatter in individual values. Drag coeffic ient CDf determined by CD = U%/U2, is rather variable with a mean value of 1.47XlO"3, where U* is friction velocity obtained by eddy correlation method and U is mean wind speed at a height of 10 m derived from wind profile. Spe ctra and cospectra of fluctuating quantities seem to have no conclusive differ ence depending on -z/L> since the range of stability is rather small in this case. This results look similar to those presented by Pond et al. (1971).
Individual value of vertical flux obtained by eddy correlation method from successive observations varies widely and not gradually but rather abruptly ac cording to the time. Single value of the flux obtained from single observation may be not representative of the meteorological situation during a certain time interval including the observation time. However, it seems to be apparent that the fluxes are very large during a certain period and are very small during an other period. Daily mean values of momentum flux, ze, sensible heat flux, He,
and latent heat flux, LEe, obtained by eddy correlation method during a period from 18 th of February to 1st of March in 1975 are given in Table 1. These values may be a representative of the energy exchange between the sea and air during a stated day respectively, corresponding quite well to the synoptic weather situation, for example, cold outbreak from the large scale continental anticyclone, medium scale moving atmospheric pressure system, and so on.
Mean value of Bowen ratio, HJLEei is 0.27, which is computed from daily mean values of sensible and latent heat fluxes excepting those of two days of 24 th and 25 th, because the total heat fluxes are quite small on these days. Total heat fluxes in bracket are estimated by mean Bowen ratio of 0. 27 from sensible heat for the same day respectively. Heat fluxes are quite large during a period of four days from 19 th to 22 nd.
4. Remarks
A number of different results have been presented in literature by many re
searchers, concerning to the comparison between numerical values of vertical
fluxes of momentum, sensible and latent heat obtained by different methods in the atmospheric surface boundary layer over the sea. Some of them show quite good agreement between the results derived from different methods, while others show considerable inconsistency. Thus, the question which is the best or better do not settle yet so far. This problem may be due to not only some difficulties and uncertainties in observation and analysis, but also a certain cha racteristics inherent in eddy flux itself. However, relevant mean value may be a good representative for corresponding synoptic weather situation.
participation, to the staff of the Management Committee for AMTEX, steered by Chairman Prof. G. Yamamoto, organizing the experimental network of AMTEX. Thanks are also due to staffs of the Okinawa Meteorological Obser vatory, of the Kunigami Village Office, and of the Okinawa Prefectural Fisheries High School, especially Messes M. Kinjoo, E. Nishimura, and K. Iwaki for find ing the good site of Hentona, transportation of instruments, and arrangement in the field. Thanks are extended to Prof. H. Mitsuyasu for allowance of the use of the DATAC-2000 S at Kyushu University.
References
Hanafusa, T. (1970) : A simple method for the measurement of water vapour flux, /. Met. Sco. J., 48, 259-261.
Japanese National Committee for GARP, (1971) : AMTEX Report, 1, 17-26.
Pond, S., G. T. Phelps, J. E. Paquin, G. McBean, and R. W. Stewart (1971): Measurements of turbulent fluxes of momentum, moisture and sensible heat over the ocean, /. Atmos. Sci., 28, 901-917.
Takahashi, T., M. Tabata, H. Kanbara (1976): An observation tower for atmospheric