Volcano in NE China From Joint Inversion of
Ambient Noise and Receiver Functions
著者
Hongxiang Zhu, You Tian, Dapeng Zhao, Honghao
Li, Cai Liu
journal or
publication title
Journal of geophysical research: Solid Earth
volume
124
page range
4984-5002
year
2019-05-28
URL
http://hdl.handle.net/10097/00127020
Noise and Receiver Functions
Hongxiang Zhu1, You Tian1 , Dapeng Zhao2 , Honghao Li1, and Cai Liu1
1College of Geoexploration Science and Technology, Jilin University, Changchun, China,2Department of Geophysics,
Graduate School of Science, Tohoku University, Sendai, Japan
Abstract
We study the detailed 3‐D crustal and upper mantle structure beneath the active Changbai intraplate volcano in Northeast China by conducting a trans‐dimensional Bayesian inversion ofteleseismic receiver functions and Rayleigh‐wave group velocity dispersions from ambient noise. More than 12,000 teleseismic receiver functions recorded at 78 seismic stations and 1,573 group velocity dispersions are used in this study. Receiver‐function H‐κ stacking measurements reveal a thick crust (~40 km) with a high Vp/Vs ratio (~1.8) beneath the Changbai volcano. Our joint inversion results show a heterogeneous crustal structure in the study region. A low‐velocity body at depths of 8–15 km is revealed directly beneath the Changbai volcano, which has a lateral extent of ~100 km in the north–south direction and may reflect a large magma chamber in the midcrust. Our results also reveal a 5–10 km depressed Moho and a low‐velocity anomaly in the uppermost mantle beneath the Changbai volcano. These features may indicate an upwelling channel of the asthenospheric material with a high mafic composition, and the mafic intrusion attaches to the bottom of the crust and thus deepens the Moho beneath the volcano. Our results support the notion that the Changbai volcanism is caused by hot and wet mantle upwelling associated with subduction‐ driven cornerflow in the big mantle wedge above the stagnant Pacific slab in the mantle transition zone.
1. Introduction
Several active Cenozoic volcanoes exist in NE China (Figure 1). The Changbai volcano is located at the bor-der between China and North Korea, which is the largest intraplate volcano in NE Asia (Liu, 1999; Liu, 2000). The Longgang and Jingpohu volcanoes are located to the west and northeast of the Changbai volcano, respectively. The Songliao Basin exists in the northwestern part of the study region (Figure 1a). The Changbai volcano has erupted many times in the history; its violent Millennium eruption occurred around the mid‐10th century, and its last small‐scale eruption took place inAD1903 (Simkin & Siebert, 1994; Xu et al., 2012). During 2002–2005, strong magmatic disturbances were observed at the Changbai volcano, which are deemed to be a signal that the volcano has entered a new potential eruption period (Sun et al., 2017; Xu et al., 2012). To understand the origin of the intraplate volcanism and predict its potential eruption, many researchers have investigated the Changbai volcano using various geochemical and geo-physical methods (e.g., Ai et al., 2003; Basu et al., 1991; Fan et al., 1999; Kim et al., 2017; Li & Yuan, 2003; Tang, 1998; Tang et al., 2001; Tian et al., 2016; Zhao et al., 2004, 2007; Zhao & Tian, 2013). However, the processes of its magmatic evolution, storage, and potential dangers are still not very clear. It is crucial to obtain a new and high‐resolution three‐dimensional (3‐D) structural model beneath the Changbai volcano and its adjacent areas.
Previous studies have shown that the Changbai volcanism has a close association with the subducting Pacific slab (e.g., Lei & Zhao, 2005; Tang et al., 2014; Tian et al., 2016; Zhao et al., 2004, 2007; Zhao & Tian, 2013). The Pacific plate started its subduction at the Japan trench and arrived at the mantle transition zone (MTZ) beneath the Changbai volcano in the Jurassic (Bird, 2003; Li & Li, 2007; Maruyama et al., 1997). Both global and regional body‐wave tomographies have revealed the high‐velocity (high‐V) Pacific slab in the MTZ beneath the Changbai volcano, whereas a low‐velocity (low‐V) anomaly exists in the upper mantle above the 410‐km discontinuity (e.g., Chen et al., 2017; Fukao et al., 1992; Huang & Zhao, 2006; Liu et al., 2017; Ma et al., 2018; Tang et al., 2014; Wei et al., 2015; Zhao, 2004; Zhao & Tian, 2013). A big mantle wedge (BMW) model has been proposed to explain the origin of the Changbai intraplate volcanism, suggesting that a BMW has formed in the upper mantle and the upper MTZ above the stagnant Pacific slab, and the
©2019. The Authors.
This is an open access article under the terms of the Creative Commons Attribution‐NonCommercial‐NoDerivs License, which permits use and distri-bution in any medium, provided the original work is properly cited, the use is non‐commercial and no modifica-tions or adaptamodifica-tions are made. Key Points:
• Detailed 3‐D structure of the Changbai volcano is studied using receiver functions and ambient noise
• A 5‐ to 10‐km depressed Moho and a low‐velocity anomaly in the uppermost mantle exist under the Changbai volcano
• Our results shed new light on the magmatic system of the Changbai volcano Supporting Information: • Supporting Information S1 • Data Set S1 • Data Set S2 • Data Set S3 • Data Set S4 • Data Set S5 Correspondence to: Y. Tian, [email protected] Citation:
Zhu, H., Tian, Y., Zhao, D., Li, H., & Liu, C. (2019). Seismic structure of the Changbai intraplate volcano in NE China from joint inversion of ambient noise and receiver functions. Journal of Geophysical Research: Solid Earth, 124, 4984–5002. https://doi.org/10.1029/ 2018JB016600
Received 29 AUG 2018 Accepted 14 APR 2019
Accepted article online 22 APR 2019 Published online 28 MAY 2019
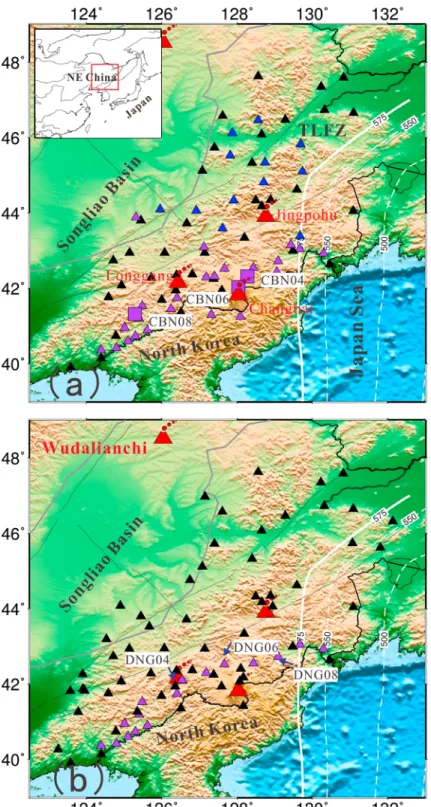
Figure 1. (a) Map showing the surface topography and major tectonic features of the study area, as well as seismic stations used in this study (small triangles). The red box in the inset map shows the location of the present study area. The big red triangles denote four intraplate volcanoes in NE China. The white solid line and dashed lines show depth contours (500–575 km) of the upper boundary of the subducting Pacific slab (Zhao & Tian, 2013). The gray line denotes the boundary of the Songliao Basin and TLFZ (Tan‐Lu Fault Zone). The colored small triangles denote seismic stations that are used in the analysis of receiver‐function stacking. The purple triangles denote 27 portable seismic stations deployed by Jilin University; the black triangles denote permanent seismic stations operated by the China Earthquake
Administration; and the blue triangles denote portable seismic stations of the NECESSArray. The three purple squares denote seismic stations CBN04, CBN06, and CBN08 that are mentioned in the text. (b) The same as (a) but showing the 74 stations which are used in the ambient‐noise analysis (see the text for details).
Changbai volcanism is caused by hot and wet upwellingflow in the BMW driven by the deep slab subduction and slab dehydration (Lei & Zhao, 2005; Zhao et al., 2004, 2007, 2009). In contrast, some researchers sug-gested that the magma under Changbai originates from the uppermost lower mantle (Liu et al., 2015; Tang et al., 2014). Although the two hypotheses have different views on the origin of magmatism, they have a common aspect that the Changbai volcano was caused by the deep subduction of the Pacific plate. Recently, M. Zhang et al. (2018) made a detailed and comprehensive review about this important issue, and they support the BMW model.
Studying seismic velocity structure of the crust and uppermost mantle, as well as the geometry of the Moho discontinuity beneath a volcano, is very important for understanding processes of magmatic intrusion, sto-rage, and eruption. Since 1990s, the crustal and uppermost mantle structure under Changbai has been inves-tigated using various geophysical approaches (e.g., Choi et al., 2013; Duan et al., 2005; Hetland et al., 2004; Kim et al., 2017; Ri et al., 2016; Song et al., 2007; Tang, 1998; Tang et al., 2001; Wang & Chen, 2017; Zhang et al., 2002). Magnetotelluric soundings detected a high‐conductivity layer in the crust under the Tianchi summit of the Changbai volcano, which was interpreted as evidence for the presence of a magma chamber (Tang, 1998; Tang et al., 2001). An active‐source seismic experiment revealed a low‐V anomaly with a reverse‐triangle shape below the Changbai volcano, and the anomaly consists of four parts from 10‐km depth to the bottom of the crust, suggesting that a magma chamber exists under the Tianchi summit (Zhang et al., 2002). However, a seismic reflection and refraction survey revealed a low‐V zone at depths of 10–25 km, which is located ~60 km to the north of the Tianchi summit rather than directly below it (Song et al., 2007). In addition, a teleseismic receiver‐function study suggested that low‐V anomalies exist both below and to the north of the Tianchi summit (Hetland et al., 2004).
These inconsistent results are attributed to the complicated structure of the volcano and different model resolutions due to the different data sets used in the previous studies. Hence, better constraints on the struc-ture of the crust and upper mantle beneath the Changbai volcano are necessary. A method of jointly invert-ing teleseismic receiver functions and surface‐wave dispersions from ambient noise has been widely used for investigating volcanic areas. For example, Ward et al. (2014) detected a prominent low‐V zone below the Altiplano‐Puna Volcanic Complex in the central Andes. The joint inversion approach can provide more complementary and reliable constraints on the S wave velocity (Vs) structure of the crust and upper mantle, but it has not been fully used for the Changbai volcanic area. Guo et al. (2015) applied this approach to study the 3‐D Vs structure beneath NE China, but their model has no resolution under the Changbai volcano, because the portable seismic network they used did not cover this volcano.
To clarify the detailed 3‐D structure and magmatic system of the Changbai volcano, in this work we use high‐quality waveform data recorded by a dense network of seismic stations deployed in and around the Changbai volcanic area. We installed 27 portable broadband stations around the volcano from 2007 to 2014, which recorded abundant local and teleseismic events. Parts of the data were used in a previous study to investigate the MTZ structure at 410‐ to 660‐km depths beneath the Changbai volcano (Tian et al., 2016). In this work, we have also collected many waveform data recorded at permanent seismic stations of the China Earthquake Administration (CEA; Zheng et al., 2009) and the NECESSArray portable stations (Tao et al., 2014), which are/were located near the Changbai volcano. We have analyzed these waveform data using a new method of joint inversion of receiver functions and ambient‐noise dispersions. Our present results shed new light on thefine 3‐D Vs structure of the crust and upper mantle and the magmatic system of the Changbai volcano.
2. Data and Methods
2.1. Receiver Functions
We used a total of 78 broadband seismic stations for our receiver‐function analysis, including 27 Jilin University (JLU) stations, 39 CEA permanent stations, and 12 NECESSArray portable stations (Figure 1a). The 27 JLU stations were operated in two periods: 16 stations were deployed from 2007 to 2010, and 11 JLU stations were mainly operated from 2012 to 2014. The seismograms at the CEA and NECESSArray sta-tions were recorded during 2009–2015 and 2009–2011, respectively. Our JLU stations had a dense distribu-tion around the Changbai volcano, whereas the other stadistribu-tions cover a broader area in NE China (Figure 1).
The receiver‐function analysis depends on orientations of two horizontal‐component seismometers. A pre-vious study of P wave particle motions found a misorientation problem for some CEA stations after analyz-ing teleseismic events recorded duranalyz-ing 2007–2008 (Niu & Li, 2011), which may affect receiver‐function results from the CEA data. The problematic stations have been corrected by the end of 2014 by the CEA staff. However, the CEA seismograms recorded during 2009 to 2015 are used in this study. Hence, it is necessary to make corrections to the misoriented stations before they are used in the receiver‐function analysis. In this work, we have estimated the component azimuths using a two‐step method that requires P phases of the radial (R) and tangential (T) receiver functions. Because the receiver functions are extracted from the horizontal (R, T) and vertical (Z) component seismograms and the P‐phase delay time can be defined before deconvolution, it is easy to obtain the P wave amplitudes or energy in the radial and tangential receiver func-tions. In addition, a single receiver function is only related to a short‐time window of a teleseismic seismo-gram. Thus, many teleseismic recordings enable us to reveal variations of the component azimuth during a temporal period.
With the two‐step method, the horizontal‐component seismograms are divided into groups in the first step. We assume that the horizontal components of all events have the same misoriented angles as those revealed by Niu and Li (2011). The radial component is then determined using the back‐azimuth and its misoriented angle (Figure 2a). The P‐phase maximum amplitude from the radial receiver function is assumed to be A. Another radial receiver function is calculated in the same way but without the misoriented angle, and its maximum P‐phase amplitude is assumed to be B. By defining R = A/|B|, the R values are chronologically listed to estimate variations of the misoriented angles (Figure 2b). In the second step, each group of seismo-grams is separately analyzed using the P‐phase energy of the tangential receiver functions. In this study, the misoriented angle is set in a range of−90° to +90° with an increment of 2°. When the summed P wave energy of tangential receiver functions reaches its minimum value, the corresponding angle is considered to be the misoriented angle of that group.
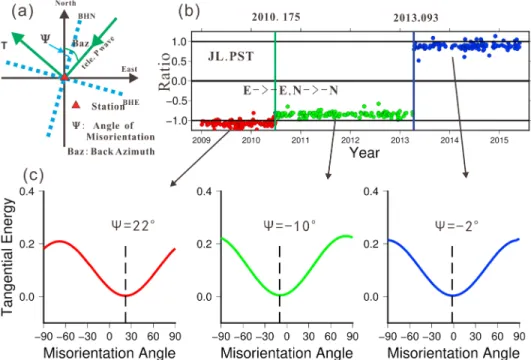
Figure 2. An example of correcting the misorientation for a China Earthquake Administration station (JL.PST). (a) A schematic diagram showing the misoriented angleΨ between the orientation of the N‐S horizontal‐component seism-ometer (BHN, the blue dashed line) and the north direction. The back‐azimuth and tangential direction at the station (the red triangle) are marked as Baz and T, respectively. BHE, the orientation of the E‐W horizontal‐component seismometer (BHE, the blue dashed line). (b) Temporal variations of the P‐phase amplitude ratio of each receiver function during 2009 to 2015. The red, green, and blue dots denote the P‐phase amplitude ratios in three periods separated by the green and blue vertical lines which approximated correspond to the dates (year and Julian day) of 2010.175 and 2013.093. (c) In the three periods shown in (b), the misoriented angle in each period is determined by minimizing the summed energy of P phases in the tangential receiver functions.
Figure 2 shows an example of the two‐step analysis for the CEA station JL.PST. Niu and Li (2011) found that this station had a misorientation ofΨ = 25°, and polarities of the BHN and BHE components are reversed. We calculated two sets of radial receiver functions with a misoriented angle of 25° and 0°. After plotting the temporal variations of the R value, we could identify three different groups (Figure 2b), which are separated at ~2010.175 (YYYY.JDAY) and 2013.093. Before 2013.093, the R value is negative, indicating reversed pola-rities of the BHN and BHE components. We analyzed the summed P‐phase energy of the tangential receiver functions and estimated the misoriented angles to be 22°,−10°, and − 2° in the three groups (Figure 2c). The misoriented angle (22°) in the period of 2009 to 2010.175 is close to the result of Niu and Li (2011). We have adopted the two‐step method to investigate all the CEA stations used in this study and made corrections to all the seismograms that had misoriented angles >8°, following Niu and Li (2011).
We used seismograms of teleseismic events (M > 5.5) with epicentral distances of 30° to 90° recorded at our JLU stations and the CEA stations. Three‐component raw seismograms are filtered using a Butterworth band‐pass filter of 0.03–2 Hz. Then receiver functions are computed in the time domain using an iterative deconvolution technique with a Gaussian factor of 2 (Ligorría & Ammon, 1999). The procedure of our pro-cessing the NECESSArray data is described in detail by H. Zhu et al. (2017). We manually selected all the available receiver functions that contain clear converted Ps and crustal multiple phases from the Moho (PpPs and PpSs+PsPs). Over 12,000 receiver functions arefinally used in this study.
We apply the H‐κ stacking method (Zhu & Kanamori, 2000) to estimate the crustal thickness and average Vp/Vs ratio in the crust beneath each station and take these values as a priori information in the following joint inversion. In the H‐κ stacking analysis, the crustal thickness is changed from 20 to 50 km with an inter-val of 0.1 km, and the Vp/Vs ratio is set in a range of 1.5 to 1.9 with an interinter-val of 0.01. According to the result of deep seismic soundings (Zhang et al., 2002), the mean crustal Vp is set to be 6.1 km/s. The weight assigned to Ps, PpPs, and PpSs+PsPs phases is 0.7, 0.1, and 0.2, respectively. Figure 3 shows examples of the receiver‐ function analysis at three JLU stations (CBN04, CBN06, and CBN08) and their H‐κ stacking results. The sta-tion CBN06 is located near the Tianchi summit, whereas stasta-tions CBN04 and CBN08 are located to the northeast and southwest of the Tianchi summit, respectively (Figure 1a).
The receiver functions need some further processing before they are used in the joint inversion. First, a four‐ bin move‐out method is applied to correct the receiver functions for a certain ray parameter of 0.06 s/km (Chen & Niu, 2013). This method is effective for correcting the time difference of the converted and reverb-erated phases recorded at various distances by stretching or contracting each bin. We then stack the receiver functions at each station to suppress noisy signals of the records and estimate the standard deviation at each point. In addition, a time window of−2 to +21 s relative to the first P wave is chosen to cut the receiver func-tions, and we also decimate the receiver functions with a sampling rate of 10 Hz.
2.2. Ambient‐Noise Tomography
To compute interstation correlation functions, we collected continuous vertical‐component seismograms recorded at some of the stations. A total of 74 stations is used in the ambient‐noise analysis, which are shown as triangles in Figure 1b. We adopt a data processing method similar to that described by Bensen et al. (2007). The instrument response isfirst removed from the continuous vertical‐component records, and then the records are decimated with a sampling rate of 1 Hz. After the records are merged in a daily length, they are demeaned and detrended. Moreover, all the records arefiltered in a period range of 4–100 s. A run‐abso-lute‐mean method in temporal normalization is applied to remove the influence of earthquake signals, and spectral normalization is also adopted to balance the spectral components and broaden the bandwidth of the ambient noise (Bensen et al., 2007; Guo et al., 2015). The noise correlation functions (NCFs) are computed in the frequency domain. We then stack simultaneously the NCFs for every station pairs. Figure 4 shows exam-ples of the NCFs at stations DNG04, DNG06, and DNG08.
Because of the nonuniform distribution of noise sources, positive and negative lags of NCFs are also stacked to improve the signal‐to‐noise ratio before measuring the Rayleigh‐wave fundamental group‐velocity disper-sions in a period range of 5–40 s using a modified version of the interactive procedure (Yao et al., 2006). The dispersion curves arefirst selected with the following criteria. (1) The signal‐to‐noise ratio, which is defined as the ratio of the maximum in the signal window to the root mean square in the noise window, is greater than 5. (2) The interstation distance, which is used for determining the upper limit of period in the
dispersion curve, is greater than the double wavelength. (3) For a single period to all dispersion curves, we only keep the velocity values within two times of the standard deviation. To obtain a reliable result of ambient noise tomography, we manually selected the dispersion curves and removed some suspicious ones. Previous studies found a strong noise source in Kyushu (Zeng & Ni, 2010; Zheng et al., 2011), which may contaminate the ambient noise results (Guo et al., 2015; Shen et al., 2016). A small number of our NCF results show obvious signal from the Kyushu source. For the dispersions computed from those NCFs, we have discarded those measurements in the periods possibly influenced by the Kyushu noise but Figure 3. (a, c, e) Receiver functions measured at stations CBN04, CBN06, and CBN08. (b, d, f) H‐κ stacking results at the three stations.
keep the measurements in other periods. As a result, 1,573 dispersion curves are obtained, and they are used to conduct ambient‐noise tomography. The number of ray paths at each period is shown in Figure 7i. In this study, an iterative nonlinear inversion method based on the subspace technique (Kennett et al., 1988; Rawlinson & Sambridge, 2005) is adopted to map lateral variations of the Rayleigh‐wave group velocity in the study region. The travel time at each site is estimated using the fast‐marching method (Rawlinson & Sambridge, 2004). The interval of the inversion grid is set to be 0.5° × 0.5°, and the checkerboard recovery test is performed to estimate the resolution. We adopt a 1° × 1° checkerboard model with ±0.2‐km/s velocity perturbations relative to an average group velocity of 3 km/s and add Gaussian random noise with a stan-dard deviation of 0.5 s to the synthetic data calculated for the checkerboard model (Kim et al., 2017). 2.3. Joint Inversion
A 3‐D Vs model beneath the study region is constructed by combining the individual 1‐D velocity measure-ments. From the ambient‐noise tomography, we finally selected ~140 sites of dispersion curves with a grid size of 0.5° × 0.5°, but receiver functions at only 78 seismic stations are available in our study region. Hence, the receiver functions are grouped with the dispersion curves at their closest sites. Then the two data sets are jointly inverted at the locations of receiver functions, whereas the rest of ambient‐noise dispersion curves are inverted separately. The receiver functions are primarily sensitive to Vs contrasts and sharp dis-continuities but have a poor constraint on the absolute Vs. In contrast, the ambient‐noise dispersion is sen-sitive to the absolute average Vs but cannot reveal sharp Vs interfaces. Hence, a joint inversion of the two data sets can provide constraints on both the absolute crustal Vs and the Moho discontinuity (Bodin et al., 2012; Julià et al., 2000). Several techniques have been developed to perform a joint inversion of receiver func-tions and ambient‐noise or surface‐wave dispersions, for example, the linear damped least‐squares method Figure 4. Cross‐correlation record sections at stations (a) DNG04, (b) DNG06, and (c) DNG08. The red and purple dashed lines denote an apparent velocity of 4 and 2 km/s, respectively.
(Julià et al., 2000) and nonlinear inversion methods such as the niching genetic algorithm (Lawrence & Wiens, 2004), the neighborhood algorithm (Li et al., 2017), and the trans‐dimensional Bayesian algorithm (Bodin et al., 2012; Shen et al., 2013). In this study, we use the hierarchical trans‐dimensional Bayesian method (Bodin et al., 2012; Kim et al., 2017) to invert for a 3‐D Vs model beneath the study region. The hierarchical trans‐dimensional Bayesian method treats the number of layers in the velocity model as an unknown parameter that is updated in the inversion process. This is the major difference from the other methods. Just like any other Bayesian algorithms, Bayes' (1763) equation is used to estimate the posterior probability density (PPD) function from the prior information of the model and the observed data:
p mð jdobsÞ∝p dð obsjmÞp mð Þ; (1)
where m and dobsrepresent the model vector and data vector, respectively, p(m| dobs) is the PPD function,
p(dobs| m) is the likelihood function, and p(m) is the prior probability density of the model. In this study,
the likelihood function is defined as
p dð obsjmÞ ¼ ∏ 2 i¼1 1 ffiffiffiffiffiffiffiffiffiffiffiffiffiffiffiffiffiffiffiffi 2π ð ÞNiC i j j q × exp − gð ið Þ−dm iobsÞ T Ci−1ðgið Þ−dm iobsÞ 2 ( ) ; (2)
where the subscript i indexes the type of the input data (receiver functions or ambient‐noise group‐velocity dispersion curves in this work), Niis the number of data points of each data type, Ciis the covariance matrix
with a size of Ni× Ni, and gi(m) represents synthetic data.
In the hierarchical Bayesian scheme, the Vs model is parameterized using the 1‐D Voronoi‐cell method at each site (Bodin et al., 2012; Kim et al., 2017). The number of layers, the depth of cells, and the standard deviation of ambient noise data are also taken as unknown parameters. In this study, the maximum depth of our model is set to be 60 km. Furthermore, Vs and the number of layers vary in the range of 2–5 km/s and 3–40, respectively. Following the procedure of Kim et al. (2017), we randomly generate a series of interfaces between the minimum and maximum depths, after sorting them from shallow to deep areas. The thickness of each layer is then computed from the depths of adjacent interfaces. Because the crustal thickness and the average Vp/Vs ratio are estimated from the H‐κ stacking analysis, the Vp/Vs ratio of each layer is set to be the same as the crustal average Vp/Vs ratio obtained by the H‐κ stacking when the layer is located above the Moho discontinuity. Following the previous studies of this region (Duan et al., 2005; Hetland et al., 2004), the Vp/Vs ratio below the Moho isfixed to be 1.8. The density of each layer is computed using its empirical relationship with Vp and Vs (Brocher, 2005). After randomly initi-alizing the model parameters, a new Vs model is estimated from the starting model with one of following options: (1) selecting one cell and resetting its Vs value (p = 1/3); (2) perturbing the depth of a selected interface (p = 1/6); (3) removing an existing layer or adding a new layer (p = 1/3); and (4) changing the standard deviation of the ambient noise (p = 1/6).
As a nonlinear inversion approach, the trans‐dimensional Bayesian method needs a mass of forward mod-eling. A parallel tempering algorithm is adopted to enhance the computational efficiency (Kim et al., 2017; Sambridge, 2014), including 32 Markov chains in inversion. For each Markov chain, 50,000 posterior models are collected for statistical analysis after a“burn‐in” period of the first 100,000 samples. In this study, the average of the posterior models from the nontempered chains is treated as thefinal inversion result. In addition, the standard deviation and PPD of the model can also be estimated. Figure 5 shows an example of the inversion result at station CBN06. The Vs profile beneath the Tianchi summit (Figure 5b) clearly shows two low‐V anomalies at depths of ~10 km and 50–60 km. In addition, a sharp Moho is detected at ~41‐km depth (Figure 5b).
3. Results
3.1. Receiver‐Function Result
As a priori condition of the joint inversion, the crustal thickness and Vp/Vs ratio are very important. In this work, the two parameters are determined by interpolation of the results at 78 stations, which exhibit strong lateral variations in the study region (Figure 6). The crustal thickness varies from ~27 to ~41 km
with an average of ~31 km. The thickest crust exists under station JL.CBS near the Tianchi summit (Figure 6a). In the western part of the study region, the crust beneath the Songliao Basin is thinner than that under the surrounding areas. In contrast, under the Changbai and Jingpohu volcanoes, a quite thick crust (~41 km) is revealed. However, the crust is not thick (~31 km) under the Longgang volcano. Our results of the crustal thickness are generally consistent with those of the previous studies (Tao et al., 2014; Zhang et al., 2013).
The crustal Vp/Vs ratio shows a similar pattern as that of the crustal thickness, varying from 1.66 to 1.85 with an average of ~1.74 (Figure 6b). At the stations located around the Changbai volcano, the Vp/Vs ratio reaches 1.8, corresponding to a thick crust of up to 40 km. This result is discussed in detail in section 4. 3.2. Rayleigh‐Wave Group Velocity
We mapped the Rayleigh‐wave group velocity at periods of 5 to 40 s with an interval of 1 s, and the results at some periods are shown in Figures 7 g–7 k. Figure 7 l shows a statistical result of the ray paths at each period, which approximately exhibits a Gaussian distribution, and the maximum number of ray paths appears at a period of 15 s. Figures 7a–7e show the results of checkerboard recovery tests at periods of 5, 12, 20, 27, and 36 s. Figure 8 shows the corresponding ray paths and travel‐time residuals, indicating that the input anomalies are generally well recovered at these periods and so the obtained tomographic results are reliable. At short periods of 5 and 12 s, the group velocities are predominantly sensitive to the upper crustal Vs structure (Figures 7 g and 7 h), and the Songliao Basin exhibits an obvious low‐V anomaly which reflects a thick sedimentary layer there. A prominent low‐V anomaly is visible in and around the Changbai volcano. Our images at periods of 5 and 12 s are similar to the results of recent ambient‐noise studies (Kim et al., 2017; Shen et al., 2016). At longer periods of 20, 27, and 36 s, the group velocity images (Figures 7i–7 k) mainly reflect the Vs structure of the lower crust and the uppermost mantle, where the low‐V anomaly is still visible under the Changbai volcano. A clear N‐S‐oriented low‐ V anomaly appears to the west of the Jingpohu volcano at a period of 20 s, which is not clear in the group Figure 5. The trans‐dimensional Bayesian inversion result at station CBN06 that is located near the Tianchi summit of the Changbai volcano (Figure 1a). (a) PPD of the layer interface depths. (b) PPD of S wave velocity (Vs) as a function of depth. The solid and dashed black lines denote the mean Vs (thefinal inversion result) and its ±1 standard deviation. (c) PPD of the number of layers in the Vs model. (d) PPD of the ambient‐noise Rayleigh‐wave group‐velocity dispersion. The triangles denote the measured group velocities at different periods. (e) PPD of the receiver function at the station. The black line denotes the input receiver function at the station. LVZ = low‐velocity zone; PPD = posterior probability distributions.
velocity result of Shen et al. (2016). Unlike the images at the short per-iods, the images at the long periods become complex under the Songliao Basin, and the low‐V area has a negative correlation with the increasing period, and the basin is surrounded by a belt of high‐V anomalies. In the northeastern part of the study region, a distinct low‐V anomaly exists in the northeast of the Jingpohu volcano in the lower crust or the uppermost mantle. This anomaly is also visible in the Rayleigh‐wave phase‐velocity tomography (Wang & Chen, 2017).
3.3. S Wave Velocity Structure
A 3‐D Vs model is constructed by interpolating the 1‐D profiles obtained by a joint inversion of receiver functions and ambient‐noise Rayleigh‐ wave group velocity dispersions. Figure 9 shows map views of the 3‐D Vs model at nine depths from 6 to 54 km, and Figure 10 shows its cor-responding standard deviations. In the upper and middle crusts (6‐ and 10‐km depths), the Songliao Basin shows up as a large low‐V anomaly reflecting the thick sedimentary layer there (Figures 9a and 9b), and a low‐V zone appears beneath the Jingpohu volcanic area. At depths of 10 and 14 km (Figures 9b and 9c), a prominent low‐V zone is visible under the Changbai volcano. However, this low‐V anomaly is not obvious at 6‐km depth under Changbai (Figure 9a), suggesting that a magma chamber exists mainly in the midcrust at depths greater than 10 km. In the middle and lower crusts, the Vs image looks complex (Figures 9d–9f). A relatively high‐V anomaly is revealed at depths of 18–30 km beneath Changbai (Figures 9d–9f). A prominent low‐V zone is visible to the northeast of the Jingpohu volcano, and a large low‐V anomaly appears to the south of the Longgang volcano in the middle to lower crust (Figures 9d–9f). At the bottom of the crust and the uppermost mantle, prominent low‐V anomalies exist under the Changbai and Jingpohu volcanoes at 38‐ and 54‐km depths, respectively (Figures 9 g–9i). At 46‐km depth below the Changbai volcano (Figure 9 h), however, our images show a high‐V anomaly. These results are generally consis-tent with those of recent ambient‐noise studies (Kim et al., 2017; Wang & Chen, 2017).
Figure 11 shows three vertical cross sections of the Vs tomography, which pass through the Changbai, Longgang, and Jingpohu volcanoes. The Moho discontinuity obtained from the receiver‐function H‐κ stacking is shown with a black dashed line in Figure 11, which is roughly coincident with the 3.9‐km/s Vs contour line in the cross sections. Under the Changbai volcano, a prominent low‐V anomaly with a Vs of ~3.1 km/s is visible at depths of 8–15 km (Figures 11a and 11b). Moreover, a thick crust (~40 km) exists beneath the Changbai volcano (Figures 11a and 11b), which is similar to the previous results of receiver functions and ambient‐noise tomography (Duan et al., 2005; Hetland et al., 2004; Kim et al., 2017; Ri et al., 2016; Song et al., 2007; Wang & Chen, 2017; Zhang et al., 2002). In addition, a relatively low‐V anomaly appears below the Moho under Changbai, and the anomaly seems to extend to a greater depth (Figures 11a and 11b). Under the Jingpohu volcano, the Moho is slightly deeper (~35 km), and a low‐V zone exists in the middle crust (Figure 11c). Unlike the Changbai and Jingpohu volcanoes, the Longgang volcano is underlain by a thinner crust (~31 km; Figures 11b and 11c), suggesting that Longgang has a crustal structure different from those under the other two volcanoes.
Figure 6. Distribution of (a) the crustal thickness and (b) average crustal Vp/Vs ratio in the study region, which are shown in both colors and con-tour lines. The black triangles denote locations of the 78 seismic stations used in this study. The red triangles denote three active volcanoes as shown in Figure 1. The color scale is shown at the upper‐left corner of each map.
4. Discussion
Our 3‐D Vs tomography reveals three remarkable features: (1) a low‐V body in the midcrust under the Changbai volcano; (2) a deep Moho (~40 km) directly below the Changbai volcano; and (3) a relatively low‐V volume in the uppermost mantle, which is located below the thick crust under the Changbai Figure 7. (a–e) Results of the checkerboard recovery tests at periods of 5, 12, 20, 27, and 36 s. The scale for the group‐velocity perturbations is shown on the right. (f) The input checkerboard model and the seismic stations used in this study (white triangles); the red dashed line shows the resolved area. (g–k) Maps of group‐velocity perturbations at periods of 5, 12, 20, 27, and 36 s relative to the average velocity at each period shown at the upper‐left corner of each map. The scale of the group velocity perturbations is shown on the right. The gray dashed line denotes the boundary of the Songliao Basin. The black triangles denote the three volcanoes. (l) A histogram showing the number of ray paths at each period.
volcano. Here a thick crust means that the Moho depth is greater than 40 km. In the following, we compare the presentfindings with the previous results and discuss their magmatic and geodynamic implications. 4.1. Low‐V Zone in the Midcrust
Several previous studies have revealed a pronounced low‐V zone in the middle or lower crust beneath or close to the Changbai volcano, which has a Vp < 6 km/s and a Vs < 3 km/s (Hetland et al., 2004; Kim et al., 2017; Song et al., 2007; Zhang et al., 2002). The seismic explosion study of X. Zhang et al. (2002) detected a low‐Vp body in the midcrust with a lateral extent of ~100 km in the N‐S direction. Their result is supported Figure 8. (a–e) Maps showing the distribution of ray paths at each period shown in Figure 7. (f–g) Histograms showing the number of travel‐time residuals at each period.
by the Magnetotelluric (MT) soundings (Tang, 1998; Tang et al., 2001; Qiu et al., 2014) which revealed a low‐ resistivity body below the Tianchi summit. A 2‐D Poisson's ratio profile (Liu et al., 2004) and a 3‐D density model (Choi et al., 2013) also support the result of X. Zhang et al. (2002), suggesting that the low‐V body also exhibits a high Poisson's ratio and a low density. A previous receiver‐function result shows that a low‐V body exists at depths of 10–20 km, and it has a Vs < 3 km/s (Hetland et al., 2004). A recent receiver‐function observation at the North Korea side of the Changbai volcano reveals a similar feature (Ri et al., 2016). Recent ambient‐noise studies also found a large‐scale low‐V zone beneath the Changbai volcano (Kim et al., 2017; Wang & Chen, 2017).
A similar low‐V body is visible beneath the Changbai volcano in our Vs tomography (Figures 11a and 11b), which is located at depths of 8–15 km, and extends ~100 km in the N‐S and E‐W directions. The location and geometry of the low‐V zone in our result are generally consistent with those imaged by X. Zhang et al. (2002) who found the low‐V zone at depths of 9–15 km with its N‐S extent of ~100 km. However, in the lower crust, there is no low‐V zone in our Vs tomography, which is consistent with the ambient‐noise observation (Wang & Chen, 2017) but different from the result of X. Zhang et al. (2002).
The cause of the low‐V zone beneath the Changbai volcano was controversial in the previous studies. Although the MT profile and the gravity study showed that the low‐V zone has characteristics of low Figure 9. (a–i) Map views of the obtained 3‐D S wave velocity (Vs) model. The layer depth is shown at the lower‐right corner of each map. The Vs scales are shown on the right. The three solid lines in (a) denote locations of the vertical cross sections shown in Figure 11.
resistivity and low density, its Poisson's ratio (or Vp/Vs ratio) was uncertain in the previous results of seismic refraction/reflection and receiver‐function studies. Some researchers suggested that the low‐V zone exhibits a high Poisson's ratio (Liu et al., 2004; Ri et al., 2016), whereas other researchers showed that the low‐V zone has a low Poisson's ratio (Hetland et al., 2004; Song et al., 2007). If this low‐V zone has a high Poisson's ratio, it may indicate the presence of partial melt or high temperature in the crust (e.g., Mavko, 1980). In contrast, if its Poisson's ratio is lower, it may reflect compositional variations (e.g., Behn & Kelemen, 2003; Christensen, 1996; Kim et al., 2017; Song et al., 2007). Our receiver‐function stacking result shows a high Vp/Vs ratio (~1.80) in the crust beneath the Changbai volcano, much higher than the average value of 1.74 (Figure 6b). Hence, we deem that the low‐V zone in the midcrust beneath the volcano may indicate the presence of partial melt. However, the H‐κ stacking of receiver functions only reveals the average Vp/Vs ratio in the crust. A high‐resolution study of the Vp/Vs ratio in the midcrust is needed to resolve this issue.
4.2. Thick Crust Under the Changbai Volcano
Both the receiver‐function stacking and joint inversion results show a 5‐ to 10‐km depressed Moho under the Changbai volcano (Figures 6a, 11a, and 11b). Previous studies with different approaches have also revealed a Figure 10. The same as Figure 9 but showing the distribution of one standard deviation of Vs at each depth.
thick crust in this area (e.g., Choi et al., 2013; Hetland et al., 2004; Kim et al., 2017; Liu et al., 2004; Ri et al., 2016; Song et al., 2007; Tang, 1998; Tang et al., 2001; Wang & Chen, 2017; Wu et al., 2009; Zhang et al., 2002). These previous studies focused on the low‐V zone beneath Changbai but did not discuss much on the depressed Moho there. Recently, Kim et al. (2017) proposed a model of double layering of the middle‐to‐ lower crustal magmatic system, based on their Vs model and previous Vp models (Song et al., 2007; Zhang et al., 2002), to interpret the deeper Moho under the Changbai volcano. They suggested that two low‐V layers exist in the middle‐to‐lower crust: The upper one has a low Poisson's ratio due to its highly felsic composition, whereas the lower layer has a high Poisson's ratio which may be related to hot mafic Figure 11. Vertical cross sections of S wave velocity (Vs) tomography along the three profiles shown in Figure 9a. The black solid lines denote the Vs contour lines. The black dashed line denotes the Moho discontinuity estimated from the receiver‐function stacking.
intrusion. The mafic intrusion body stays at the bottom of the original crust and so forming a thick crust there (Kim et al., 2017).
To date, hot mafic intrusion from the uppermost mantle has been commonly adopted to interpret crustal thickening in volcanic areas. In addition to the Changbai volcano, some other active volcanoes like those in Iceland also have a thick crust (e.g., Allen et al., 2002; Li & Detrick, 2005). It is considered that the thick crust under the Iceland volcanoes is caused by an area of enhanced melt production at the plume head from the upper mantle, and then the melt material is transported into the crust (Green et al., 2017; Rickers et al., 2013; Wolfe et al., 1997). As mentioned above, the Changbai volcanism is considered to be caused by hot upwellingflow in the BMW above the stagnant Pacific slab in the MTZ (Zhao et al., 2004, 2009; Zhao & Tian, 2013). We deem that the thick crust under Changbai is related to the mafic intrusion ascending from the BMW. Christensen (1996) showed that the continental crust with mafic intrusion has a high Vp/Vs ratio and a Vs of ~3.9 km/s, which can explain our Vs and Vp/Vs results in the Changbai volcanic area (Figures 11a and 11b). The Jingpohu volcano also has a depressed Moho (Figures 11a and 11c), and so we speculate that its cause is similar to that of the Changbai volcano.
4.3. Magmatic System of the Changbai Volcano
Love‐wave inversion results show a notable low‐V zone at the bottom of the crust and the uppermost mantle beneath the Changbai volcano (Fu et al., 2016), suggesting the existence of a channel for magma migration beneath the volcano. The magmatic channel in the upper mantle beneath Changbai is not obvious in the previous ambient‐noise results (Kim et al., 2017; Wang & Chen, 2017). However, a low‐V zone with a Vs of ~4 km/s is visible in the uppermost mantle under Changbai in the present results (Figures 11a and 11b). This value is approximately equal to the Vs of asthenospheric material estimated by Kim et al. (2017). This low‐V volume is located below the deep Moho and extends to the bottom of our model (60‐ km depth). Geochemical and petrologic studies (Tian & Tang, 1989; Xie et al., 1988) suggested that the sur-face petrosilex at the Tianchi summit may derive from the upper mantle, and in the process of upwelling, part of magma stored in the crust, then experienced crystallization and differentiation, and eventually erupted to the surface. We cautiously speculate that this low‐V volume may reflect a magma upwelling chan-nel beneath the Changbai volcano, and hot material from the asthenosphere ascends through this chanchan-nel andfinally enters into the crust.
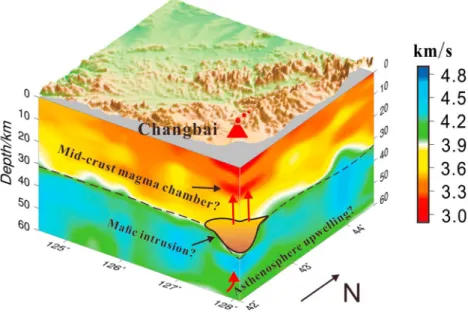
Figure 12. A cartoon showing main features of the crustal and upper mantle structure beneath the Changbai volcano, emphasizing the possible relationship between the crustal heterogeneities and mantle upwelling. The dashed line denotes the Moho discontinuity from the receiver‐function stacking, and the red arrows indicate the ascent of magma beneath the volcano.
Integrating the current and previous results, we present a cartoon to show the main features of the crustal structure and magmatic system of the Changbai volcano (Figure 12). A large magma chamber exists in the midcrust, which ascended from the upper mantle. High mafic material upwelled to the crust–mantle boundary and then stayed at the bottom of the crust, leading to a 5‐ to 10‐km depressed Moho below the Changbai volcano. Part of the hot material continues to arise to the middle crust and stays there as a magma chamber. A relatively high velocity in the lower crust beneath Changbai may reflect cooled intrusive mate-rial. The low‐V volume in the uppermost mantle indicates a magma upwelling channel that continuously supplies magma feeding the intraplate volcano.
5. Conclusions
In this study, we use abundant three‐component seismograms to study the crust and upper mantle structure beneath the Changbai volcano and adjacent areas. A high‐resolution 3‐D Vs model at depths of 0–60 km is obtained by conducting a trans‐dimensional Bayesian joint inversion of teleseismic receiver functions and ambient‐noise Rayleigh‐wave group velocity dispersions. Lateral variations of the crustal thickness and Vp/Vs ratio are revealed using a receiver‐function H‐κ stacking method. Main results of this work are sum-marized as follows.
1. A thick (~40 km) crust and a high Vp/Vs ratio (~1.80) are revealed beneath the Changbai volcano. 2. A midcrustal low‐V zone exists beneath the Changbai volcano at depths of 8–15 km, and it extends
~100 km in the N‐S direction. This low‐V zone may reflect a magma chamber under the volcano. 3. The crust beneath the Changbai volcano is 5–10 km thicker than that under the surrounding areas,
which may be caused by mafic intrusion from the upper mantle.
4. A low‐V volume is revealed in the uppermost mantle under the Changbai volcano, which may reflect hot and wet upwellingflow driven by the deep subduction of the Pacific slab.
References
Ai, Y., Zheng, T., Xu, W., He, Y., & Dong, D. (2003). A complex 660 km discontinuity beneath north east China. Earth and Planetary Science Letters, 212(1‐2), 63–71. https://doi.org/10.1016/S0012‐821X(03)00266‐8
Allen, R. M., Nolet, G., Morgan, W. J., Vogfjörd, K., Nettles, M., Ekström, G., et al. (2002). Plume‐driven plumbing and crustal formation in Iceland. Journal of Geophysical Research, 107(B8), 2163. https://doi.org/10.1029/2001JB000584
Basu, A. R., Wang, J., Huang, W., Xie, G., & Tatsumoto, M. (1991). Major element, REE, and Pb, Nd and Sr isotopic geochemistry of Cenozoic volcanic rocks of eastern China: Implications for their origin from suboceanic‐type mantle reservoirs. Earth and Planetary Science Letters, 105(1‐3), 149–169. https://doi.org/10.1016/0012‐821X(91)90127‐4
Bayes, T. (1763). An essay towards solving a problem in the doctrine of chances. Philosophical Transactions of the Royal Society of London, 53, 370–418.
Behn, M. D., & Kelemen, P. B. (2003). Relationship between seismic P‐wave velocity and the composition of anhydrous igneous and meta‐ igneous rocks. Geochemistry, Geophysics, Geosystems, 4(5), 1041. https://doi.org/10.1029/2002GC000393
Bensen, G. D., Ritzwoller, M. H., Barmin, M. P., Levshin, A. L., Lin, F., Moschetti, M. P., et al. (2007). Processing seismic ambient noise data to obtain reliable broadband surface wave dispersion measurements. Geophysical Journal International, 169(3), 1239–1260. https://doi. org/10.1111/j.1365‐246X.2007.03374.x
Bird, P. (2003). An updated digital model of plate boundaries. Geochemistry, Geophysics, Geosystems, 4(3), 1027. https://doi.org/10.1029/ 2001GC000252
Bodin, T., Sambridge, M., Tkalčić, H., Arroucau, P., Gallagher, K., & Rawlinson, N. (2012). Trans‐dimensional inversion of receiver functions and surface wave dispersion. Journal of Geophysical Research, 117, B02301. https://doi.org/10.1029/2011JB008560 Brocher, T. M. (2005). Empirical relations between elastic wave speeds and density in the Earth's crust. Bulletin of the Seismological Society
of America, 95(6), 2081–2092. https://doi.org/10.1785/0120050077
Chen, C., Zhao, D., Tian, Y., Wu, S., Hasegawa, A., Lei, J., et al. (2017). Mantle transition zone, stagnant slab and intraplate volcanism in Northeast Asia. Geophysical Journal International, 209, 68–85.
Chen, Y., & Niu, F. (2013). Ray‐parameter based stacking and enhanced pre‐conditioning for stable inversion of receiver function data. Geophysical Journal International, 194, 1682–1700.
Choi, S., Oh, C. W., & Götze, H. J. (2013). Three‐dimensional density modeling of the EGM2008 gravity field over the Mount Paekdu volcanic area. Journal of Geophysical Research: Solid Earth, 118, 3820–3836. https://doi.org/10.1002/jgrb.50266
Christensen, N. I. (1996). Poisson's ratio and crustal seismology. Journal of Geophysical Research, 101(B2), 3139–3156. https://doi.org/ 10.1029/95JB03446
Duan, Y., Zhang, X., Liu, Z., Qin‐Xi, U., Zhao‐Fan, X. U., Wang, F., et al. (2005). Study on crustal structures of Changbaishan‐Jingpohu volcanic area using receiver functions. Chinese Journal of Geophysics, 48, 352–358.
Fan, Q., Liu, R., Li, D., & Li, Q. (1999). Significance of K‐Ar age of bimodal volcanic rocks at Wangtian'evolcano, Changbaishan area. Chinese Science Bulletin, 44(7), 660–663. https://doi.org/10.1007/BF03182731
Fu, Y. V., Gao, Y., Li, A., Li, L., Shi, Y., & Zhang, Y. (2016). Origin of intraplate volcanism in northeast China from Love wave constraints. Journal of Geophysical Research: Solid Earth, 121, 8099–8112. https://doi.org/10.1002/2016JB013305
Fukao, Y., Obayashi, M., Inoue, H., & Nenbai, M. (1992). Subducting slabs stagnant in the mantle transition zone. Journal of Geophysical Research, 97, 4809–4822. https://doi.org/10.1029/91JB02749
Acknowledgments
This work was supported by the National Key Research and Development Project of China (2017YFC0601301), the National Natural Science Foundation of China (grants 41474030 and 41430322), and a grant from Japan Society for the Promotion of Science (grant 19H01996). The obtained velocity models and data of receiver functions and dispersion curves in this work are available in the supporting information. Most of the figures were made using the GMT soft-ware (Wessel & Smith, 1998). We are very grateful to M. Savage (the Editor), an Associate Editor, and two anon-ymous referees for their thoughtful review comments and suggestions that have improved this paper.
Green, R., Priestley, K., & White, R. (2017). Ambient noise tomography reveals upper crustal structure of Icelandic rifts. Earth and Planetary Science Letters, 466, 20–31. https://doi.org/10.1016/j.epsl.2017.02.039
Guo, Z., Chen, Y., Ning, J., Feng, Y., Grand, S., Niu, F., et al. (2015). High resolution 3‐D crustal structure beneath NE China from joint inversion of ambient noise and receiver functions using NECESSArray data. Earth and Planetary Science Letters, 416, 1–11. https://doi. org/10.1016/j.epsl.2015.01.044
Hetland, E. A., Wu, F., & Song, J. (2004). Crustal structure in the Changbaishan volcanic area, China, determined by modeling receiver functions. Tectonophysics, 386(3‐4), 157–175. https://doi.org/10.1016/j.tecto.2004.06.001
Huang, J., & Zhao, D. (2006). High‐resolution mantle tomography of China and surrounding regions. Journal of Geophysical Research, 111, B09305. https://doi.org/10.1029/2005JB004066
Julià, J., Ammon, C. J., Herrmann, R. B., & Correig, A. M. (2000). Joint inversion of receiver function and surface wave dispersion obser-vations. Geophysical Journal International, 143(1), 99–112. https://doi.org/10.1046/j.1365‐246x.2000.00217.x
Kennett, B., Sambridge, M., & Williamson, P. (1988). Subspace methods for large inverse problems with multiple parameter classes. Geophysical Journal International, 94(2), 237–247. https://doi.org/10.1111/j.1365‐246X.1988.tb05898.x
Kim, S., Tkalčić, H., & Rhie, J. (2017). Seismic constraints on magma evolution beneath Mount Baekdu (Changbai) volcano from trans‐ dimensional Bayesian inversion of ambient noise data. Journal of Geophysical Research: Solid Earth, 122, 5452–5473. https://doi.org/ 10.1002/2017JB014105
Lawrence, J., & Wiens, D. (2004). Combined receiver‐function and surface wave phase‐velocity inversion using a niching genetic algo-rithm: Application to Patagonia. Bulletin of the Seismological Society of America, 94(3), 977–987. https://doi.org/10.1785/0120030172 Lei, J., & Zhao, D. (2005). P‐wave tomography and origin of the Changbai intraplate volcano in Northeast Asia. Tectonophysics, 397(3‐4),
281–295. https://doi.org/10.1016/j.tecto.2004.12.009
Li, A., & Detrick, R. (2005). Seismic structure of Iceland from Rayleigh wave inversions and geodynamic implications. Earth and Planetary Science Letters, 241, 901–912. https://doi.org/10.1016/j.epsl.2005.10.031
Li, J., Song, X., Zhu, L., & Deng, Y. (2017). Joint inversion of surface wave dispersions and receiver functions with P‐velocity constraints: Application to southeastern Tibet. Journal of Geophysical Research: Solid Earth, 122, 7291–7310. https://doi.org/10.1002/2017JB014135 Li, X., & Yuan, X. (2003). Receiver functions in northeast China—Implications for slab penetration into the lower mantle in northwest
Pacific subduction zone. Earth and Planetary Science Letters, 216(4), 679–691. https://doi.org/10.1016/S0012‐821X(03)00555‐7 Li, Z., & Li, X. (2007). Formation of the 1300‐km‐wide intracontinental orogen and postorogenic magmatic province in Mesozoic South
China: Aflat‐slab subduction model. Geology, 35(2), 179–182. https://doi.org/10.1130/G23193A.1
Ligorría, J. P., & Ammon, C. J. (1999). Iterative deconvolution and receiver‐function estimation. Bulletin of the Seismological Society of America, 89, 1395–1400.
Liu, J. (1999). Volcanoes in China. Beijing, 219: Science Press.
Liu, R. (2000). Active volcanoes in China. Beijing, 114: Seismological Press.
Liu, X., Zhao, D., Li, S., & Wei, W. (2017). Age of the subducting Pacific slab beneath East Asia and its geodynamic implications. Earth and Planetary Science Letters, 464, 166–174. https://doi.org/10.1016/j.epsl.2017.02.024
Liu, Z., Niu, F., Chen, Y. J., Grand, S., Kawakatsu, H., Ning, J., et al. (2015). Receiver function images of the mantle transition zone beneath NE China: New constraints on intraplate volcanism, deep subduction and their potential link. Earth and Planetary Science Letters, 412, 101–111. https://doi.org/10.1016/j.epsl.2014.12.019
Liu, Z., Zhang, X., Wang, F., & Duan, Y. (2004). 2‐D crustal Poisson's ratio from seismic travel time inversion in Changbaishan‐Tianchi volcanic region. Acta Seismologica Sinica (English Edition), 18(3), 345–353. https://doi.org/10.1007/s11589‐005‐0084‐y
Ma, J., Tian, Y., Liu, C., Zhao, D., Feng, X., & Zhu, H. (2018). P‐wave tomography of Northeast Asia: Constraints on the western Pacific plate subduction and mantle dynamics. Physics of the Earth and Planetary Interiors, 274, 105–126. https://doi.org/10.1016/j. pepi.2017.11.003
Maruyama, S., Isozaki, Y., Kimura, G., & Terabayashi, M. (1997). Paleogeographic maps of the Japanese Islands: Plate tectonic synthesis from 750 Ma to the present. Island Arc, 6(1), 121–142. https://doi.org/10.1111/j.1440‐1738.1997.tb00043.x
Mavko, G. M. (1980). Velocity and attenuation in partially molten rocks. Journal of Geophysical Research, 85(B10), 5173–5189. https://doi. org/10.1029/JB085iB10p05173
Niu, F., & Li, J. (2011). Component azimuths of the CEArray stations estimated from P‐wave particle motion. Earthquake Science, 24(1), 3–13. https://doi.org/10.1007/s11589‐011‐0764‐8
Qiu, G., Pei, F., Fang, H., Du, B., Zhang, X., Zhang, P., et al. (2014). Analysis of magma chamber at the Tianchi volcano area in Changbai mountain. Chinese Journal of Geophysics, 57, 3466–3477.
Rawlinson, N., & Sambridge, M. (2004). Wave front evolution in strongly heterogeneous layered media using the fast marching method. Geophysical Journal International, 156(3), 631–647. https://doi.org/10.1111/j.1365‐246X.2004.02153.x
Rawlinson, N., & Sambridge, M. (2005). The fast marching method: An effective tool for tomographic imaging and tracking multiple phases in complex layered media. Exploration Geophysics, 36(4), 341–350. https://doi.org/10.1071/EG05341
Ri, K., Hammond, J., Chol‐Nam, K., Hyok, K., Yun, Y. G., Gil‐Jong, P., et al. (2016). Evidence for partial melt in the crust beneath Mt. Paektu (Changbaishan), Democratic People's Republic of Korea and China. Science Advances, 2, e1501513(4). https://doi.org/10.1126/ sciadv.1501513
Rickers, F., Fichtner, A., & Trampert, J. (2013). The Iceland–Jan Mayen plume system and its impact on mantle dynamics in the North Atlantic region: Evidence from full‐waveform inversion. Earth and Planetary Science Letters, 367, 39–51. https://doi.org/10.1016/j. epsl.2013.02.022
Sambridge, M. (2014). A parallel tempering algorithm for probabilistic sampling and multi‐modal optimization. Geophysical Journal International, 196(1), 357–374. https://doi.org/10.1093/gji/ggt342
Shen, W., Ritzwoller, M., Kang, D., Kim, Y., Lin, F., Ning, J., et al. (2016). A seismic reference model for the crust and uppermost mantle beneath China from surface wave dispersion. Geophysical Journal International, 206(2), 954–979. https://doi.org/10.1093/gji/ggw175 Shen, W., Ritzwoller, M., Schultepelkum, V., & Lin, F. (2013). Joint inversion of surface wave dispersion and receiver functions: A Bayesian
Monte‐Carlo approach. Geophysical Journal International, 192(2), 807–836. https://doi.org/10.1093/gji/ggs050 Simkin, T., & Siebert, L. (1994). Volcanoes of the world. Washington DC, 349: Geoscience Press.
Song, J., Hetland, E. A., Wu, F. T., Zhang, X., Liu, G., & Yang, Z. (2007). P‐wave velocity structure under the Changbaishan volcanic region, NE China, from wide‐angle reflection and refraction data. Tectonophysics, 433(1‐4), 127–139. https://doi.org/10.1016/j. tecto.2006.09.012
Sun, Y. T., Guo, Z. F., Cheng, Z. H., Zhang, M. L., & Zhang, L. H. (2017). Gaseous anomalies related to the activities of Changbai Volcano in 2002~2005: Evidence from multi‐sensor hyperspatial satellite archived data. Acta Petrologica Sinica, 33, 221–230. (in Chinese)
Tang, J. (1998). The electronic structure of Tianchi volcano area by magnetotelluric soundings. In R. X. Liu, H. Q. Wei, & J. T. Lee (Eds.), The recent eruptions of the Tianchi Volcano in the Changbaishan, (pp. 108–123). Beijing, China: Science Publisher. (in Chinese) Tang, J., Deng, Q., Zhao, G., Li, W., Xuan, F., Jin, W., et al. (2001). Electric conductivity and magma chamber at the Tianchi volcano area in
Changbaishan. Seismology & Geology, 23, 191–200.
Tang, Y., Obayashi, M., Niu, F., Grand, S. P., Chen, Y. J., Kawakatsu, H., et al. (2014). Changbaishan volcanism in northeast China linked to subduction‐induced mantle upwelling. Nature Geoscience, 7(6), 470–475. https://doi.org/10.1038/ngeo2166
Tao, K., Niu, F., Ning, J., Chen, Y. J., Grand, S., Kawakatsu, H., et al. (2014). Crustal structure beneath NE China imaged by NECESSArray receiver function data. Earth and Planetary Science Letters, 398, 48–57. https://doi.org/10.1016/j.epsl.2014.04.043
Tian, F., & Tang, D. (1989). Petrogenesis of the Cenozoic volcanic rocks in the Changbaishan region. Acta Petrologica Sinica, 5, 49–64. (in Chinese)
Tian, Y., Zhu, H., Zhao, D., Liu, C., Feng, X., Liu, T., & Ma, J. (2016). Mantle transition zone structure beneath the Changbai volcano: Insight into deep slab dehydration and hot upwelling near the 410 km discontinuity. Journal of Geophysical Research: Solid Earth, 121, 5794–5808. https://doi.org/10.1002/2016JB012959
Wang, W., & Chen, Q. (2017). The crust S‐wave velocity structure under the Changbaishan volcano area in northeast China inferred from ambient noise tomography. Chinese Journal of Geophysics, 60, 3080–3095.
Ward, K., Zandt, G., Beck, S., Christensen, D., & Mcfarlin, H. (2014). Seismic imaging of the magmatic underpinnings beneath the Altiplano–Puna volcanic complex from the joint inversion of surface wave dispersion and receiver functions. Earth and Planetary Science Letters, 404, 43–53. https://doi.org/10.1016/j.epsl.2014.07.022.v
Wei, W., Zhao, D., Xu, J., Wei, F., & Liu, G. (2015). P and S wave tomography and anisotropy in Northwest Pacific and East Asia: Constraints on stagnant slab and intraplate volcanism. Journal of Geophysical Research: Solid Earth, 120, 1642–1666. https://doi.org/ 10.1002/2014JB011254
Wessel, P., & Smith, W. (1998). New, improved version of generic mapping tools released. Eos Transactions, American Geophysical Union, 79(47), 579–579. https://doi.org/10.1029/98EO00426
Wolfe, C., Bjarnason, I., VanDecar, J., & Solomon, S. (1997). Seismic structure of the Iceland mantle plume. Nature, 385(6613), 245–247. https://doi.org/10.1038/385245a0
Wu, J., Ming, Y., Fang, L., & Wang, W. (2009). S‐wave velocity structure beneath Changbaishan volcano inferred from receiver function. Earthquake Science, 22(4), 409–416. https://doi.org/10.1007/s11589‐009‐0409‐3
Xie, G., Basu, A. R., & Tatsumoto, M. (1988). Petrochemistry and Sr, Nd, Pb‐isotopic geochemistry of Cenozoic volcanic rocks, Changbaishan area, Northeast China. Acta Petrologica Sinica, 4, 1–13. (in Chinese)
Xu, J., Liu, G., Wu, J., Ming, Y., Wang, Q., Cui, D., et al. (2012). Recent unrest of Changbaishan volcano, northeast China: A precursor of a future eruption? Geophysical Research Letters, 39, L16305. https://doi.org/10.1029/2012GL052600
Yao, H., van der Hilst, R., & de Hoop, M. (2006). Surface‐wave array tomography in SE Tibet from ambient seismic noise and two‐station analysis—I. Phase velocity maps. Geophysical Journal International, 166(2), 732–744. https://doi.org/10.1111/j.1365‐246X.2006.03028.x Zeng, X., & Ni, S. (2010). A persistent localized microseismic source near the Kyushu Island, Japan. Geophysical Research Letters, 37,
L24307. https://doi.org/10.1029/2010GL045774
Zhang, M., Guo, Z., Liu, J., Liu, G., Zhang, L., Lei, M., et al. (2018). The intraplate Changbaishan volcanicfield (China/North Korea): A review on eruptive history, magma genesis, geodynamic significance, recent dynamics and potential hazards. Earth‐Science Reviews, 187, 19–52. https://doi.org/10.1016/j.earscirev.2018.07.011
Zhang, G., Wu, Q., Pan, J., Zhang, F., & Yu, D. (2013). Study of crustal and Poisson ratio of NE China by H‐K stackand CCP stack methods. Chinese Journal of Geophysics, 56(12, 4048–4094.
Zhang, X., Zhang, C., Zhao, J., Yang, Z., Li, S., Zhang, J., et al. (2002). Deep seismic sounding investigation into the deep structure of the magma system in Changbaishan‐Tianchi volcanic region. Acta Seismologica Sinica (English Edition), 15(2), 143–151. https://doi.org/ 10.1007/s11589‐002‐0003‐4
Zhao, D. (2004). Global tomographic images of mantle plumes and subducting slabs: Insight into deep Earth dynamics. Physics of the Earth and Planetary Interiors, 146(1‐2), 3–34. https://doi.org/10.1016/j.pepi.2003.07.032
Zhao, D., Lei, J., & Tang, Y. (2004). Origin of the Changbai volcano in Northeast China: Evidence from seismic tomography. Chinese Science Bulletin, 49(13), 1401–1408. https://doi.org/10.1360/04wd0125
Zhao, D., Maruyama, S., & Omori, S. (2007). Mantle dynamics of Western Pacific and East Asia: Insight from seismic tomography and mineral physics. Gondwana Research, 11(1‐2), 120–131. https://doi.org/10.1016/j.gr.2006.06.006
Zhao, D., & Tian, Y. (2013). Changbai intraplate volcanism and deep earthquakes in East Asia: A possible link? Geophysical Journal International, 195(2), 706–724. https://doi.org/10.1093/gji/ggt289
Zhao, D., Tian, Y., Lei, J., Liu, L., & Zheng, S. (2009). Seismic image and origin of the Changbai intraplate volcano in East Asia: Role of big mantle wedge above the stagnant Pacific slab. Physics of the Earth and Planetary Interiors, 173(3‐4), 197–206. https://doi.org/10.1016/j. pepi.2008.11.009
Zheng, X., Ouyang, B., Zhang, D., Yao, Z., Liang, J., & Zheng, J. (2009). Technical system construction of Data Backup Center for China seismograph network and the data support to researches on the Wenchuan earthquake. Chinese Journal of Geophysics, 52, 1412–1417. Zheng, Y., Shen, W., Zhou, L., Yang, Y., Xie, Z., & Ritzwoller, M. (2011). Crust and uppermost mantle beneath the north China craton,
northeastern China, and the Sea of Japan from ambient noise tomography. Journal of Geophysical Researchh, 116, B12312. https://doi. org/10.1029/2011JB008637
Zhu, H., Tian, Y., Liu, C., Feng, X., Yang, B., Liu, C., et al. (2017). High‐resolution crustal structure of Northeast China revealed by tele-seismic receiver functions. Chinese Journal of Geophysics, 60(5), 1676–1689.
Zhu, L., & Kanamori, H. (2000). Moho depth variation in southern California from teleseismic receiver functions. Journal of Geophysical Research, 105(B2), 2969–2980. https://doi.org/10.1029/1999JB900322