A Preliminary study on the Attenuation of
High-frequency P and S Waves in the Crust of
the Yangsan Fault Area (Extended Abstract)
著者
Tae-Woong Chung, Sato Haruo
雑誌名
The science reports of the Tohoku University.
Fifth series, Tohoku geophysical journal
巻
36
号
2
ページ
291-294
発行年
2001-09
A Preliminary Study on the Attenuation of High-frequency P and S
Waves in the Crust of the Yangsan Fault Area, Southeastern Korea
(Extended Abstract)
TAE-WOONG CHUNG' and HARUO SAT02
Department of Earth Sciences and Research Institute of Geoinformatics and Geophysics, Sejong University, Seoul 143-747 Korea
2 Department of Geophysics , Graduate School of Science, Tohoku University, Aramaki-Aoba, Sendai 980-8578
(Received November 15, 2000)
Studies on the attenuation characteristics of seismic waves are important for the quantitative prediction of strong ground-motion especially in seismically active zones and/or densely populat-ed industrial areas. In Korea, the Yangsan fault has been receiving increasing attention in its seismic activity, because the fault lies in an industrial area. On June 26, 1997, an earthquake of magnitude 4.3 took place associated with this fault, although in Korea there have been very few earthquakes more than magnitude 4 class in this century. For the fault region, Kim et al. (1999)
obtained for P-waves (hereafter, Qi;') ; however, the value was derived from only ten earthquake data. There have been no reports on Q-1 for S-waves (hereafter, QS in Korea. In this paper, using more than 120 earthquakes occurred from 1994 to 2000, we make the
simultane-ous measurement of and QS 1 by means of extended coda-normalization method (Yoshimoto et al., 1993).
We used data of the seismic station located Deok--jung Ri, southeastern Korea. This station is one of the network stations operated by Korea Institute of Korea Institute of Geology, Mining and Materials (KIGAM) from December 1994. Three-component velocity transducers are equipped in the station with natural frequency of 1 Hz (Chi et al., 1996). For digitized seismo-grams with a sampling interval of 0.02 s or 0.01 s, P and S-wave amplitudes were measured from
UD and NS-component, respectively. We analyzed 121 seismograms of local earthquakes that occurred from Dec. 1994 to Feb. 2000. The local magnitudes of all the events range from 1.8 to 3.9.
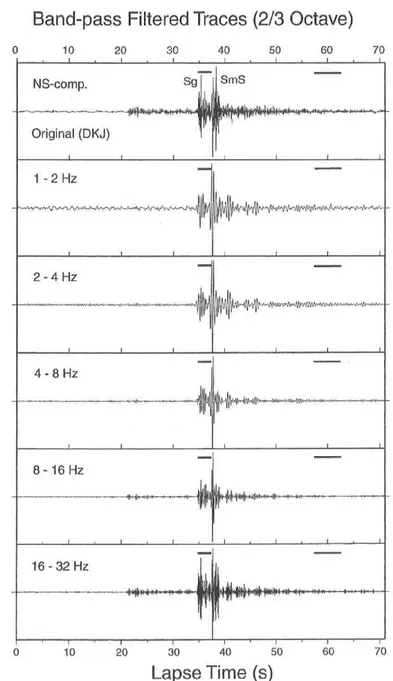
The coda spectral amplitude was derived from the time window of 5 s centered at 60 s. The span of 5 s was also chosen for both the P- and S-wave time window to pick the maximum amplitude of direct arrivals. Some S-wave windows were, however, narrowed to exclude later phases reflected from Moho (SmS), which are higher amplitude than Sg (Fig. 1). Such a distinct difference of phase amplitudes was not observed in P-wave data. In addition, some record sections for the hypocentral distance greater than about 120 km showed too close phase to discriminate Sg from SmS and Lg. We excluded these from our data set.
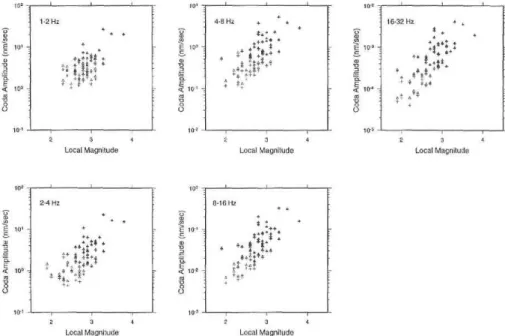
We subtracted the noise power spectra sampled with a lapse of 5 s prior to the P-wave arrival from the spectral amplitudes of P- and S-wave arrivals and coda spectra, assuming that the signal and noise are statistically independent and that the noise is stationary. We found that the noise subtraction reduced the coda spectral amplitude for events of small magnitude, and hence improved linearity between local magnitude and the coda spectral amplitude (Fig. 2).
292 TAE-WOONG CHUNG AND HARUO SATO
Band-pass
0 10 20Filtered
Traces
30 40(2/3 Octave)
50 60 70 NS-comp. Sg SmS Original (DKJ) 1 -2 Hzi
lvl,'
2 - 4 Hz 4 - 8 Hz 8 - 16 Hz1"1
16 - 32 Hz 0 10 20 30 40 50 60 70Lapse Time (s)
Fig. 1. Example of time windows of direct S-waves and coda for original {top) and bandpass-filtered seismograms recorded at station located in Deok-jung Ri, southeastern Korea. The time window of a direct S-waves (left solid line) is
narrower than that of coda (right solid line) to exclude the high amplitude phase
of SmS.
Since this linearity was suggested by the coda observations (Tsujiura, 1978), the subtraction of noise power spectra was plausible in this study.
Seismograms were filtered by using a phaseless four-pole Butterworth filter with five octave-width frequency-bands, 1-2,2-4,4-8,8-16 and 16-32 Hz (Fig. 1). Q,;' and Qs 1 were obtained from the slope of the linear regression line. The number of data increased with increasing central
01 ec3 lel 4 10' 3 10, 4,4;1 2 3 4 Local Magnitude 10,
1 Ur
g- < 1(0 *:.. LIV 23 4 Local Magnitude 10. 10. 0. 104 0 105 2 34 Local Magnitude g 10' 3 Ur, ',tt r„*T4W k4 0 A a fly; VJ C .'
01
t!:t+
+a. , -' , in-' . i 22 3 43 4Local Magnitude Local Magnitude
Fig. 2. Coda spectral amplitude vs local magnitude. Triangles and crosses refer to
before and after the noise power subtraction, respectively.
12 10 (7 T. 6 12 10 4 50 c5 +5 100 150 Hypocentral Distance r(km) Sc 100 150 Hypocentral Distance r(km) 12 10 t 8 C' 6 4 12 10 <°-' C 4 5(1 100 150 Hypocentral Distance r(km) 50 100 150 Hypocentral Distance r(km) 12 6 50 100 150 Hypocentral Distance r(km)
Fig. 3. The coda-normalized amplitude of P (crosses) and S (circles) waves. best fit lines from the least-squares estimate are expressed by two solid lines :
upper and lower lines are for S and P-wave amplitudes, respectively.
The the
294 TAE-WOONG CHUNG AND HARUO SATO Q P,S 10.1 10-2 1 0-3 10-4 Kim et at (1999) 10° 101 102 Frequency (Hz)
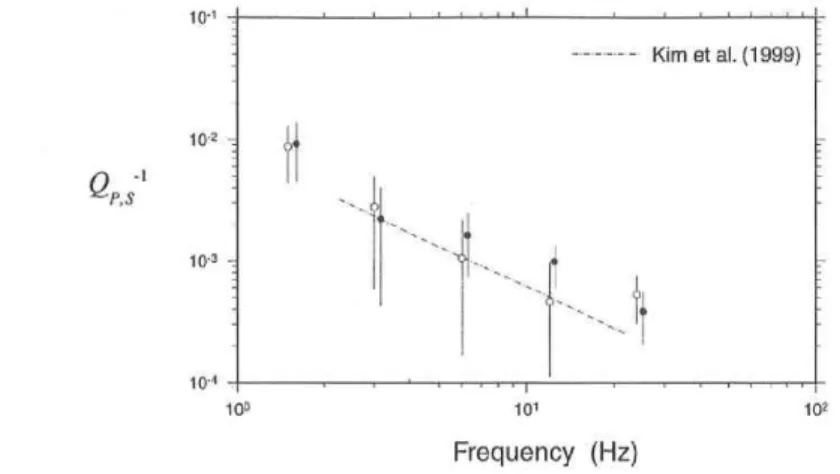
Fig. 4. Qg' (open circles) and QV (solid circles) in the southeastern Korea. The error bar indicates the standard deviations. A grey chained line refers to the
study on the same area based on the reversed two station method (Kim et al.,
1999).
frequencies (Fig. 3). The number of the P-wave data was 61, 80, 81, 92, and 110 in the frequency range of 1-2, 2-4, 4-8, 8-16, and 16-32 Hz, respectively. For the corresponding frequency range, the number of the S-wave data was 37, 61, 60, 66, and 80, respectively. The small number in the 1-2 Hz range was due to large noise probably induced by sea waves. The high frequency data showed smaller scatter around the regression line than that for the low frequency data.
We found strong frequency dependence from the plots of ();;' and Q.-1(Fig. 4). Q;,-' and Q;' decreased from 1 X 10⁻² and 9 x 10⁻³ and at 1.5 Hz to 6 x 10⁻⁴ and 5 x 10⁻⁴ at 24 Hz, respectively. The standard deviations represented by error bars are smaller in high frequency than those in low frequency. Our resuts for Q)71 shows a good agreement with the Kim et al. (1999)'s measurement (grey chained line), which was carried out in the same area based on the reversed two-station method : this uses a two-station spectral ratio for aligned two sources (Chun et al., 1987).
Acknowledgements : The authors are grateful for help and advise by Kazuo Yoshimoto. This study was supported by grants from 1999 National Research and Development Program of Korea Ministry of Science and Technology ; and the Korea Science and Engineering Foundation (No. 1999-2-311-005-3).
References
Chi, H.C., J.S. Jun and I.C. Shin, 1996 : KIGAM Research Report, KR-96(C)-4, 127 pp (in Korean). Chun, K.Y., G.F. West, R.J. Kokoski and C. Samson, 1987 : A novel technique for measuring Lg attenuation:
results from Eastern Canada between 1 to 10 Hz, Bull. Seism. Soc. Am., 77, 398-419.
Kim, S.K., M.S. Jun and J.K. Kim, 1999 : Attenuation of P-waves in the Kyungsang Basin, Southeastern Korea, J. Geol. Soc. Korea, 35, 223-228 (in Korean).
Tsujiura, M., 1978 : Spectral analysis of the coda waves from local earthquakes, Bull. Earthq. Res. Inst. Univ. Tokyo, 53, 1-48.
Yoshimoto, K., H. Sato and M. Ohtake, 1993 : Frequency-dependent attenuation of P and S waves in the Kanto area, Japan, based on the coda-normalization method, Geophys. J. Int., 114, 165-174.