Comparative Study with East Asia
著者
Hirano Katsumi
権利
Copyrights 日本貿易振興機構(ジェトロ)アジア
経済研究所 / Institute of Developing
Economies, Japan External Trade Organization
(IDE-JETRO) http://www.ide.go.jp
journal or
publication title
IDE Discussion Paper
volume
6
year
2004-08-01
Discussion Papers are preliminary materials circulated
to stimulate discussions and critical comments
DISCUSSION PAPER No. 6
Mass
Unemployment in South
Africa: A Comparative Study with
East Asia*
Katsumi HIRANO**
August 2004
* This paper is the revised and up-dated version of chapter 9 in Chris Alden and
Katsumi Hirano eds., Japan and South Africa in a Globalising World: A Distant Mirror,
Ashgate, 2003.
The Institute of Developing Economies (IDE) is a semigovernmental,
nonpartisan, nonprofit research institute, founded in 1958. The Institute
merged with the Japan External Trade Organization (JETRO) on July 1, 1998.
The Institute conducts basic and comprehensive studies on economic and
related affairs in all developing countries and regions, including Asia, Middle
East, Africa, Latin America, Oceania, and East Europe.
The views expressed in this publication are those of the author(s). Publication does not imply endorsement by the Institute of Developing Economies of any of the views expressed.
INSTITUTE OF DEVELOPING ECONOMIES (IDE), JETRO 3-2-2, WAKABA,MIHAMA-KU,CHIBA-SHI
CHIBA 261-8545, JAPAN
A Comparative Study with East Asia
*
Katsumi HIRANO**
Introduction
Democratisation in South Africa cannot be fully depicted through ordinary analyses employed on democratisation in other African countries, where the focus is placed on political transformation accompanied by shifts in power. Rather, it can be better understood as a change in the nature of the country’s ‘social contract’ after Apartheid. This is because the new constitution of the Republic of South Africa incorporated fundamental human rights for the first time in the country’s history and, as a result, forty million citizens were newly enfranchised, forming the basis of a re-legitimised sovereign state. In this novel context, the principle of policy making is fundamentally different than that which informed it before 1994 with respect to expected benefits, its beneficiaries, and also its object.
The same assumption should be applied to the country’s economic policies. The above principle should be always recalled, no matter whether policies are demand-oriented or supply-oriented, market-oriented or discretionary ones. The new government is obliged to formulate and execute economic policies for the purpose of realising the best interests of all forty million citizens, and the government opens itself to criticism if it fails in this mission. This is the primary task entrusted to the African National Congress (ANC) by the citizenry.
It is in this context that the mass unemployment problem will be analysed in this paper. On the one hand, South Africa’s economy, which is bound to lead the continent’s economy in the future, is the largest and the most powerful one in Africa. On the other hand, it is characterised by an
*
This paper is the revised and up-dated version of chapter 9 in Chris Alden and Katsumi Hirano eds., Japan and South Africa in a Globalising World:
A Distant Mirror, Ashgate, 2003.
**
unbelievably high rate of unemployment that cannot be found among countries at the same degree of development in the world. This problem may frustrate the efforts to build a democratic society within South Africa, and, concurrently dim already tenuous hopes for economic recovery across the African continent. Job creation is one of the key responsibilities with which the new citizens charge the ANC government and also an indispensable element for political stability in South Africa. It can be said that the task of job creation is beyond being merely a part of economic policies but is now a part of its social contract, because no nation can expect a democratic society to flourish without plentiful and stable opportunities to work assuring sufficient income for its citizenry. This task is recognised as part of the ANC’s historical mission to build new lives for South Africans in the aftermath of Apartheid.
In order to achieve this objective, it is necessary to be open to new approaches and outlooks that could facilitate the building a new economy for the forty million nationals. In this paper, I will try to present a outlook on the South African macro-economy and then analyse its unemployment problem based on international comparative studies informed by the viewpoint of industrial structure theory in the latter section, finally, concluding with some recommendations.
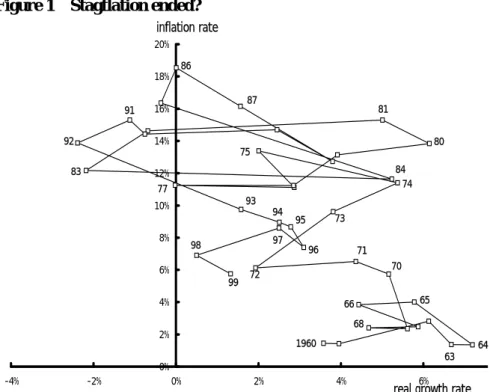
Figure 1 Stagflation ended?
99 98 75 87 77 86 91 92 83 93 97 96 81 80 74 84 73 72 71 70 65 68 66 64 1960 63 95 94 0% 2% 4% 6% 8% 10% 12% 14% 16% 18% 20% -4% -2% 0% 2% 4% 6%
real growth rate inflation rate
Macro-Economic Situation in South Africa
Figure 1 shows the macro-economic performance of South Africa from 1960 to 1999 as a sequence that places the inflation rate vertically and the real economic growth rate horizontally. The right and lower zone indicates good performance while the left and upper zone indicates worsening performance. The South African economy enjoyed a relatively good per-formance until the 1960s and thereafter it deteriorated after a brief turn around in the early stages of the 1970s. Experiencing negative growth rates with high inflation during 1982-3, the economy fell into its worst depression for decades in the early 1990s. Notably, these were the circum-stances in which the process of democratisation commenced. In short, the South African economy presented a typical phenomenon of stagflation where stagnation is coincident with inflation.
Its economic performance started improving gradually from 1993 and hit a peak in 1996. While the tough monetary policy succeeded in keeping inflation down, the South African economy seemed to recover its growth capacities to a certain extent.
Figure 2 Per capita GDP at 1995 constant price, 1963-1999
1981 11000 12000 13000 14000 15000 16000 17000 63 65 67 69 71 73 75 77 79 81 83 85 87 89 91 93 95 97 99 Rand
Source: SSA, South African Statistics, 2000.
Figure 2 shows that the trend of per capita GDP in South Africa.
After hitting a peak in 1981, it is on a downward trend experiencing
violent fluctuations. According to the best fitting curve that is added
to the figure to extract the tendency, the growth of per capita
production stalled in the very early stages of the 1980s and started to
decrease thereafter. This means that the trend of economic growth
from the 1980s failed to keep up with the rate of population
increase.
1Based on this fact, it can be easily inferred that South
Africa should accelerate its economic growth rate in order to increase
again its average income. Figure 3 shows the portion of fixed
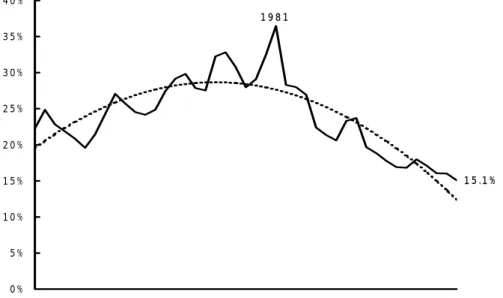
invest-ment in GDP, and its downward tendency from 1982 is obvious. It
can be said that South African economy became gradually
consumptive in its nature as well as did inflationary in the 1970s. As
a result, the potential of economic growth dropped to a lower than
desirable level.
Figure 3 Share of investment in GDP, 1957-1999
1 5 .1 % 1 9 8 1 0 % 5 % 1 0 % 1 5 % 2 0 % 2 5 % 3 0 % 3 5 % 4 0 % 5 7 5 9 6 1 6 3 6 5 6 7 6 9 7 1 7 3 7 5 7 7 7 9 8 1 8 3 8 5 8 7 8 9 9 1 9 3 9 5 9 7 9 9
Source: South African Reserve Bank, Quarterly Bulletin, 1990-2001.
We will see this trend in the industrial sector in Figure 4. The growth of the manufacturing sector, which was steady in 1960s and 70s, was suddenly put on hold in 1982. Reflecting these indicators, the number of non-agricultural formal employees continues to decrease after hitting a peak in 1989 (see Figure 5). Thus the era of democratisation opened with major labour retrenchment.
Figure 4 Value of net production by industry at 1995 constant price, 1957-1999 1981 0 20000 40000 60000 80000 100000 120000 57 59 61 63 65 67 69 71 73 75 77 79 81 83 85 87 89 91 93 95 97 99 (Rand million) manufacturing mining
agriculture, forestry, and fishery
Source: SSA, South African Statistics, 2000.
Figure 5 Number of non-agricultural formal employment, 1971-1999
1 9 8 9 3 5 0 0 0 0 0 3 7 0 0 0 0 0 3 9 0 0 0 0 0 4 1 0 0 0 0 0 4 3 0 0 0 0 0 4 5 0 0 0 0 0 4 7 0 0 0 0 0 4 9 0 0 0 0 0 5 1 0 0 0 0 0 5 3 0 0 0 0 0 5 5 0 0 0 0 0 7 1 7 3 7 5 7 7 7 9 8 1 8 3 8 5 8 7 8 9 9 1 9 3 9 5 9 7 9 9
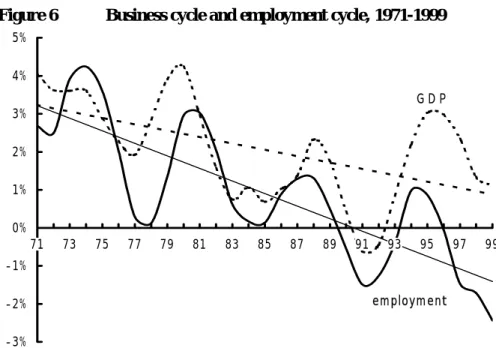
Because South Africa has particularly clear business cycles, we must distinguish cyclical elements and long-term trends in analysing its economic phenomena. Figure 6 illustrates the business cycles of South Africa by the method of calculating change rates in a time-series of GDP, non-agricultural formal employment and investment, which were beforehand processed with repeated moving average in order to remove short-term fluctuation. Approximate seven-year cycles are synchronised among these three waves. There is probably a Juglár cycle that is explained by the periodical movement of fixed investment. The fact that the year of 1997 belongs to the recession phase indicates that to some extent the deterioration of economic indicators will be inevitable. Conversely speaking, this sort of deterioration may not be so serious.
Figure 6 Business cycle and employment cycle, 1971-1999
-3% -2% -1% 0% 1% 2% 3% 4% 5% 71 73 75 77 79 81 83 85 87 89 91 93 95 97 99 em ploym ent G D P
Source: SSA, South African Statistics, 2000.
The problems needing serious consideration are contained within the trends that determine vertical positions of each cycle. The regression lines in Figure 6 tell us that the long-term trend of employment is going down at a higher pace than the trend of economic growth, sinking to minus at last in 1990. The annual average rate of the increase in total labour forces during this period is calculated as 1.95 per cent, and the regression line of employment changes at this level around 1977. Therefore, unemployment has tended to accumulate after the Soweto uprising of 1976.
To sum up, the current potential of the South African economy is not large enough to sustain the lives of the nation of forty million. This
under-standing provides an important foundation to consider as to what sort of economic policies should be pursued in the new South Africa.
Employment and Industrial Structures
South Africa conducted a complete census in 1996. According to its result, the unemployment rate is 33.9 per cent as a whole, 42.5 per cent amongst black people and 52.4 per cent amongst black women.2 These startling figures suggest the defects and the abnormality of the South African economy. An economy that can provide employment for no more than two thirds of total labour force, less than half of black women, is hardly qualified as ‘national economy’.
We must ask a crucial question: whether macro-economic analysis can write a prescription to guide proper policies for alleviating such serious unemployment. Because aggregate amounts like GDP, foreign trade, investment etc. are targets in the macro-economic analysis, the main focus is placed on designing a certain pattern of equilibrium growth. For example, GEAR, the current economic plan in South Africa, made an assumption of attaining 6.1 per cent growth rate until 2000 and more than 3 per cent of annual employment increase is expected to be sustained in the model.3 Based on this kind of macro-economic model, additional measures are formulated for job creation such as micro-enterprise supports, tax policies, productivity policies, and so on. It is a longstanding corollary of the macro-economic analysis to enlarge the overall macro-economic pie first and then to add some means for specific targets like the growth of labour-intensive industries. And also GEAR is influenced by neo-liberal thought that puts the priority on market forces and discourages policy intervention. Therefore, the policies employed by the government tend to be indirect in nature and leave decisions to the private sector.
But, is it possible to overcome the evident lack of employment creation in South Africa through growth-orientated policies? Can market forces remove the long-lasting trend of unemployment accumulation? It can be supposed that a certain lesion exists beneath the phenomena of mass unemployment in South Africa, which is rarely examined in usual macro-economic analyses. The real causes that have generated unemployment on such a large scale are in fact hidden behind aggregate indicators. In sum, mass unemployment in this country is not cyclical but structural. Structural unemployment cannot be alleviated through macro-economic policies and market mechanism.
Full employment is definitely attainable in the same size economy as is presently in place in South Africa. We can find Asian countries that enjoy full employment at even lower per capita GNP levels than South Africa. This means that the absolute magnitude of GDP cannot be attributed to mass unemployment. If its real cause exists in another dimension than GDP volume, an improvement in economic growth will not contribute to addressing the core problem of unemployment. The problem is situated within the structure of the South African economy and the way it produces its total supply. Therefore, we need to examine which industrial sector is deficient in employment creation in South Africa. From this point of view, it is quite useful to see its industrial structure. First, I will examine the Malaysian economy as a point of comparison that attained full employment at nearly same level of per capita GNP as South Africa.
Figure 7 Composition of employment in Malaysia and South
Africa, 1996 0% 5% 10% 15% 20% 25% 30% 35% Malaysia South Africa mining
agriculture, forestry, and fishery
manufacturing
construction
finance and insurance transport and communication
government services other services
registered unemployment
Source: SSA, South African Statistics, 2000; Ministry of Finance, Malaysia, Economic Report, 1998/99.
Figure 7 is a diagram comparing the breakdown of employment (shares in the total number of economically active population) by industry in Malaysia and South Africa. While the unemployment rate counts 2.6 per cent in Malaysia, the employment shares of the manufacturing sector, and the agricultural, forestry, and fishing sectors in Malaysia much exceed those of its South African counterparts. Little differences in the figures on sectors of finance and insurance, and transport and communication will indicate the similarity of economic development level of these two countries. The most important differences between full employment Malaysia and underemployment South Africa, accordingly, exists in the manufacturing sector and the agricultural sector. As Table 1 shows, the number of black employment in production sectors has been shrinking very rapidly in South Africa.
Table 1 Black labourers
1996 1991 change (%) Total labour force 9,888,468 7,497,039 31.9
Private households 932,918
Community, social and personal services
896,804 1,715,733 47.2 Unspecified 695,599
Wholesale and retail trade 614,699 686,884 -10.5
Manufacturing 588,412 730,117 -19.4
A g r i c u l t u r e , f o r e s t r y a n d f i s h e r y
557,663 909,817 -38.7 Mining and quarrying 459,344 720,261 -36.2
Construction 388,445 326,285 19.1
T r a n s p o r t , s t o r a g e a n d c o m m u n i c a t i o n
292,140 254,437 14.8 Finance, insurance, etc. 239,516 97,402 145.9 Electricity, gas and water 60,150 59,599 0.9 Total employment 5,682,476 5,750,766 -1.2
Unemployment 4,205,992 1,746,273 140.9
Source: SSA, South African Statistics, 2000
Employment in the Manufacturing Sector
What is the most notable distinction between Malaysian manufacturing industry and South African one? Figure 8 shows percentages of employment in total labour forces by manufacturing sub-sector divided along the International Standard Industrial Classification of All Economic Activities (ISIC)4.
Figure 8 Employment composition by manufacturing sub-sector of Malaysia and South Africa, 1993
0.0% 0.5% 1.0% 1.5% 2.0% 2.5% 3.0% 3.5% 4.0% 4.5% 311/ 312 313 314 321 322 323 324 331 332 341 342 351/ 352 353/354 355 356 361/369 362 371 372 381 382 383 384 385 390 Malaysia South Africa
[ISIC Revision2 code]
311/312 food products 313 beverages
314 tobacco 321 textiles
322 wearing apparel, except footwear 323 leather and fur products 324 footwear, except rubber or plastic
331 wood products, except furniture 332 furniture and fixtures, except metal
341 paper and products 342 printing and publishing 351/352 industrial, and other chemicals
353/354 petroleum refineries/misc. petroleum and coal products 355 rubber products 356 plastic products
361/369 pottery, china, earthenware/other non-metallic mineral products 362 glass and products 371 iron and steel
372 non-ferrous metals 381 fabricated metal products 382 non-electrical machinery 383 electrical machinery 384 transport equipment
385 professional and scientific equipment 390 other manufacturing industries
The Malaysian composition peaks in the sub-sectors of wood products (ISIC code 331) and the electrical machinery (383); especially the ratio of the latter is remarkable. On the other hand, South Africa has no salient peak. Employment composition is configured in the same way on Mauritius, which is the only country enjoying full employment among Sub-Saharan African countries, with the wearing apparel sub-sector occupying 17.4 per cent of total labour forces.5 Besides Mauritius, there are a number of countries that have peak employment in the fibre-related industries. The manufacturing employment compositions in full employment countries commonly characterised by peaks such as these and are never shaped in the form of a high plateau. Above all, the sub-sector of electrical machinery should be recognised to be of special importance as a labour-intensive industry, which is accompanied by a large range of supporting industries of parts production and its assembly lines which themselves absorb a great deal of labour. And also the demand for electro-mechanical domestic appliances, the mainstay of electrical machinery, reflects the degree of economic development in each country.
Figure 9 Weighted average of employment composition by
manufacturing sub-sector of five developed countries in comparison to South Africa, 1993
0.0% 0.2% 0.4% 0.6% 0.8% 1.0% 1.2% 1.4% 1.6% 1.8% 2.0% 311/3 12 313 314 321 322 323 324 331 332 341 342 351/ 352 353/35 4 355 356 361/ 369 362 371 372 381 382 383 384 385 390 weighted average of developed countries South Africa
Source: UNIDO, International Yearbook of Industrial Statistics, 1996;
William Petty pointed out as early as the 17th century the historical fact that each industry will not grow equally in the context of overall economic progress; today this observation is known as the Petty-Clerk law and the detailed research made by Simon Kuznets, Hollis Burnley Chenery and other prominent scholars have contributed to further advances in this theory. The product-cycle theory of Raymond Vernon and the flying-geese theory of Kaname Akamatsu belong to this line of argument in the realm of development economics.
What features will be expected at the end of industrial development? Figure 9 provides the answer in the area of employment. The broken line in this figure is the shape made by weighted-average of employment compositions according to the volume of total labour forces in five developed countries, namely the US, Japan, Germany, France, and the UK. It stands for the most advanced feature of the manufacturing employment,6 which is not a theoretical product but based upon reality. Therefore, I call it provisionally a ‘prototype’ of manufacturing employment because it is not a ‘model’ of a counterfactual nature. The discrepancy between the proto-type and South Africa’s composition indicates the deficit in South African industrial structure as well as its developmental objectives. These discre-pancies are apparently found in the machinery industries.
The percentage of employment in the machinery industries in various countries is listed in Table 2. As mentioned above, its share in terms of total labour force in South Africa is much smaller than in Malaysia. Indicated by the figures on Zimbabwe and Kenya, the machinery industries as well as the whole manufacturing sector, are generally tiny in Africa.7 In this sense, South Africa also lacks what is absent in other African countries.
On the other hand, it will be noted that New Zealand and Uruguay show figures very close to South Africa in the employment ratio in the machinery industries, and to a degree one finds the same trend in Finland’s electrical machinery industry. These three countries, despite a similar level of per capita GNP, have small populations under ten million. If a small population functions as a disadvantage in the development of machinery industries, which is still a merely hypothetical assumption, South Africa may have experienced the same tendency because its economy had been constructed for the sake of five million white people8 under Apartheid. One would need to quantify theoretically the expected size of domestic demand and labour market in making domestic production profitable than importation of machinery in order to verify this hypothesis. If this hypothesis can be proven somehow, the industrial structure theory will be able to support the argument that the ultimate cause of mass unemployment in South Africa originates in the Apartheid system9 through the correlation between its racial discrimination and underdevelopment of the machinery industries.
Table 2 Percentage of employment of the machinery industries in total economically active population, 1993
non-
electrical electrical transport total population GNP machinery machinery machinery per cap.
mn dollar Singapore 4.53 6.19 2.17 12.89 2.8 19,850 Germany 2.82 2.52 2.32 7.66 81.2 23,560 Japan 2.06 2.67 1.45 6.18 124.5 31,490 Malaysia 0.59 4.36 0.50 5.45 19.0 3,140 France 1.58 1.72 1.95 5.25 57.5 22,490 Slovak Rep. 2.75 1.25 1.04 5.04 5.3 2950 2) UK 1.74 1.52 1.62 4.88 58.4 18,060 Denmark 1) 2.62 0.86 0.86 4.34 5.2 26,730 US 1.50 1.16 1.34 4.00 258.1 24,740 Croatia 1.12 1.14 1.23 3.49 4.5 3,250 2) Finland 1.51 0.91 0.89 3.31 5.1 19,300 South Africa 0.54 0.73 0.66 1.93 39.7 2,980 New Zealand 0.80 0.63 0.39 1.82 3.5 12,600 Brazil 0.39 0.28 0.42 1.09 156.5 2,930 Uruguay 0.20 0.26 0.25 0.71 3.1 3,830 Thailand 3) 0.18 0.23 0.24 0.65 57.6 2,110 Mexico 0.07 0.22 0.27 0.56 90.0 3,610 Mauritius 0.15 0.19 0.14 0.48 1.1 3,030 Zimbabwe 0.07 0.16 0.16 0.39 10.7 520 Indonesia 0.04 0.12 0.12 0.28 191.7 740 Notes: 1)1992, 2)1995, 3)1991.
Source: employment statistics from UNIDO, Industrial Statistics, 1996;
population from, FAO, Production Yearbook, 1996; per capita GNP from, World Bank, World Development Report, 1995.
The presence of countries like Thailand that enjoyed full employment despite a smaller portion of employment in the machinery industries than in South Africa should be pointed out. We must consider this observation next.
Employment in the Agricultural Sector
We saw in Figure 7 that the share of agricultural employment in South Africa is less than half of its Malaysian counterparts. In 1991 the number of employees in the sector of agriculture, forestry, and fishery was 1.2 million occupying 10.5 per cent in the total economically active population in South Africa (25.4 per cent in Malaysia), and that number decreased to 0.8
million, 8.9 per cent in share, at time of the 1996 census. It was a remarkable reduction even granted the reliability of the 1991 census. The agricultural production itself continued to dwindle from 1979 in South Africa, and its employees were retrenched very rapidly as shown in Figure 11. Because industrialisation is generally accompanied with a shrinking of the primary sector, the phenomenon that the number of people engaged in agriculture has decreased is not be necessarily problematic. However, it must be carefully considered whether the current level of the agricultural employment in South Africa is reasonable.
Figure 10 Number of farming units
5 0 0 0 0 6 0 0 0 0 7 0 0 0 0 8 0 0 0 0 9 0 0 0 0 1 0 0 0 0 0 1 1 0 0 0 0 1 2 0 0 0 0 5 2 5 6 6 0 6 4 6 8 7 2 7 6 8 0 8 4 8 8 9 2 9 6
Source: SAA, South African Statistics, 2000.
Figure 11 Number of agricultural employees
700000 800000 900000 1000000 1100000 1200000 1300000 1400000 1500000 1600000 72 74 76 78 80 82 84 86 88 90 92 94 96
Table 3 Ratio of agricultural employment, 1996
(B)economically (C)economically GNP (A)total active (B)/(A) active in (C)/(B) per cap.
population population agriculture
thousand thousand (%) thousand (%) dollar World 5,767,775 2,767,970 48.0 1,305,054 47.1 Europe 728,778 356,069 48.9 37,065 10.4 Asia 3,416,765 1,698,526 49.7 1,022,328 60.2 South America 322,305 136,355 42.3 26,389 19.4 Africa 738,730 314,106 42.5 186,878 59.5 Japan 125,351 66,443 53.0 3,490 5.3 39,640 Argentina 35,219 13,829 39.3 1,497 10.8 8,030 South Africa 42,393 16,646 39.3 1,840 11.1 3,160 Mauritius 1,129 476 42.2 55 11.6 3,380 Korea Rep. 45,314 22,008 48.6 2,823 12.8 9,700 Brazil 161,087 72,287 44.9 12,924 17.9 3,640 Malaysia 20,581 8,321 40.4 1,844 22.2 3,890 Mexico 92,718 36,535 39.4 8,592 23.5 3,320 Colombia 36,444 15,651 42.9 3,682 23.5 1,910 Indonesia 200,453 93,101 46.4 49,169 52.8 980 Ghana 17,832 8,347 46.8 4,618 55.3 390 Thailand 58,703 34,333 58.5 20,154 58.7 2,740 India 944,580 409,545 43.4 250,556 61.2 340 Zimbabwe 11,439 5,318 46.5 3,520 66.2 540 China 1,232,083 731,538 59.4 520,355 71.1 620 Kenya 27,799 13,417 48.3 10,422 77.7 280 Tanzania 30,799 15,865 51.5 13,164 83.0 120
Source: FAO, Production Yearbook, 1997; World Bank, World Development Report, 1997.
Table 3 shows the ratios of agricultural employment in total economically active population in various countries. The Food and Agri-culture Organization of the United Nations (FAO), the source of this table, counted 1.84 million of the number of ‘economically active in agriculture’ in South Africa, which figure is considerably different from the above mentioned figure of the 1996 census. It may be partly because Statistics South Africa (SSA) counted only ‘agricultural employees’. Because 18.8 million lived in non-urban areas in South Africa,10 it is hard to imagine that the total number of people engaged in agriculture is fewer than one million. The FAO has calculated that number through estimating the ratio of economically active in agriculture within the framework the economically active population as a whole.11 That figure for South Africa, 11.1 per cent,
is quite low in comparison to developing countries, rather near to Europe (10.4 per cent). Thailand, which is surpassed by South Africa in terms of its portion of employment in the machinery industries, holds more than five times the percentage of South Africa in terms of agricultural employment. This is the reason why Thailand could attain full employment.
Figure 12 Agricultural employment and per capita GNP, 1993
Ghana Japan UK France Germany US Korea, Rep. South Africa Mauritius Brazil Mexico Malaysia Egypt Turkey Indonesia Kenya China Zimbabwe Cameroon Thailand 0% 10% 20% 30% 40% 50% 60% 70% 80% 0 5000 10000 15000 20000 25000 30000 35000 rat io of agricult u ral employment per capita GNP
Source: FAO, Production Yearbook, 1997; World Bank, World Development Report, 1997.
Figure 12 illustrates the relationship between the ratio of agricultural employment and per capita GNP. Middle-income countries (Thailand, Turkey, Mexico, Malaysia, Brazil, Mauritius, and South Africa) are vertically scattered, Thailand at the upper-most, South Africa at the lowest. Low-income countries are on upper left-hand side, and high-income
countries on lower right-hand side. Figure 13 does the same for the two ratios of agricultural and manufacturing employment, in which the high-income group is situated at the lower centre place, with the best fitting curve shaped convex. This feature corresponds to the tendency towards a ‘service economy’, that is, the shift of employment to the high-income service industry along with economic progress. In this figure, Mauritius can be clearly distinguished by its position at right end of the curve. The difference between Mauritius and South Africa, which is not so evident in Table 3 and Figure 12, exists in the relative scale of manufacturing employment.
Figure 13 Manufacturing employment and agricultural
employ-ment, 1993 Cameroon Mauritius Russia Malaysia Korea, Rep. Germany Kenya China Zimbabwe Ghana Indonesia Turkey Egypt Mexico Brazil
South Africa Japan France UK US Thailand 0% 10% 20% 30% 40% 50% 60% 70% 80% 0% 5% 10% 15% 20% 25% 30% rati o of agri cutural empl oyment
ratio of manufacturing employment
Source: UNIDO, International Yearbook of Industrial Statistics, 1996; FAO, Production Yearbook, 1997.
What is the reason that agricultural employment in South Africa is so small? The answer will be naturally induced from its history. The compulsory removal of black population all around the country during the Apartheid era left immeasurable damage and small-scale farmers, who have sustained economies in the African continent holding more than 60 per cent of all African labour forces, had been almost eliminated as a component of national production in this country. While I mentioned before that strong machinery industries exist neither in South Africa nor in other African countries, in this particular instance, South Africa does not have a thick stratum of black farmers that is a main source of employment in other African countries.
It can be theoretically explained that the number of farming units have decreased along with industrial development (see Figure 10). The ratio of agricultural engagement among white population went down to 4.5 per cent at the time of the 1996 census, rather resembling the situation in developed countries. The problem with respect to this trend is the fact that the number of agricultural employees has decreased too, deprived of their employers who withdrew from agricultural production. It can be understood as one of the results brought on by Apartheid that tried to build here a national economy for five million white people. The current structure of South African agriculture, as a part of five million-populated developed economy, should be definitely different to one that is potentially required for forty million-populated developing economy. Therefore, the national task left to the new government after democratisation is to reform fundamentally the structure of agricultural production and employment.
Conclusion: Industrial Policy for a National Economy of 40 Million People
In summary, mass unemployment in South Africa is due to its industrial structure. This conclusion is not one that one comes to through abstract reasoning but through comparative studies based on realities that are found in national economies of various parts of the world. In this sense, I tentatively call the approach employed in this paper a ‘prototype analysis’. In a real economy, labour-intensive industries in general could not develop. What we know is that some specific type of industries were formed and developed at specific stages in each country’s history.
The Apartheid system created a racial enclosure of what was ‘South African’ with the result that the national economy of five million white people was constructed on a territory where forty million people live. This illegitimate act is the origin of the mass unemployment problem today. In
fact, the unemployment rate of 4.2 per cent amongst the white segment, according to the 1996 census, means that South African economy still functions satisfactorily for white people. The abnormally low level of agricultural employment and underdevelopment of machinery industries, which are the main causes of mass unemployment, can be attributed ultimately to Apartheid policies. Many national economies enjoying full employment depend on these very same sectors that are, in South Africa, under-developed. In the five million-populated national economy, this sort of industry – which requires a highly qualified labour force in sufficient numbers as well as significant domestic demand – was restricted from developing and the choice was made to import its products. This situation caused unemployment to become structural in nature.
The actions of the newly democratic government will gradually amend the racial disparity of land tenure, wages, and education created by Apartheid. But, the structural unemployment cannot be eliminated by macro-economic policies or market mechanisms. Efforts to amend the gap caused by such structural unemployment are required. It is proposed here that this be undertaken through initiatives in industrial policy that foster specific industries through selective supports. If the author is permitted to speak audaciously, if this approach is pursued, there might be an additional two million people engaged in the agricultural sector and the ratio of its employment rise to beyond 20 per cent of the total labour force. Furthermore, the electrical machinery industry could double in size from its current status. Is it feasible to attain full employment in South Africa without resort to fostering the domestic production of electro-mechanical domestic appliances, and to re-establish farming communities composed of homesteads? In South Africa, many fathers, mothers, and children are forced to live separately owing to the migrant labour system, and the demographic feature of regional gender balance has been peculiarly distorted. Re-establishment of rural communities with income-generating abilities sufficient to lead family lives could be critical to guaranteeing the reunion of many families. The international community, including East Asia, provides these suggestions based on historical experiences of economic development to new South Africa.
1 The economic growth rates in each decade are calculated respectively at 4.49 per cent in 1950s, 5.72 per cent in 60s, 2.89 per cent in 70s, and 1.31 per cent in 80s.
2 Statistics South Africa, “Census in Brief”, http://www.stassa.gov.za/censuspr, 1998/12/10, Table 2.30.
3 Growth, Employment and Redistribution: A Macro-Economic Strategy, Pretoria:
Ministry of Finance, 1996, pp.5-7.
4 The United Nations Industrial Development Organization (UNIDO), International
Yearbook of Industrial Statistics, 1996. The latest comparison between South Africa
and Malaysia can be made in 1993, because the classification for South Africa has been changed to ISIC Revision 3 afterward, and Revision 2 still used for Malaysia.
5 75 thousand were employed among the total 432 thousand labourers in the apparel industry in Mauritius. UNIDO, ibid.
6 If the compositions of employment in the concerned five countries are much different each other, it will not be reasonable to call any shape of their weighted average “pro-to-type”. Those compositions quite resemble in fact, especially between the US and the UK.
7 In respect to the whole manufacturing sector, Mauritius has a highest level of employment among African countries and South Africa follows next. Adding Zimbabwe at the third place, these three countries can be categorised as industrialised states in Africa even in the absence of strong machinery production, because the contribution of manufacturing exceeds agriculture only in these three countries in Sub-Saharan Africa.
8 The size of white population was 4,434,697 in the 1996 census, but totalled 5,068,110 at the 1991 census.
9 Regarding the effects of Apartheid policies on unemployment, the job reservation system, the racial discriminated educational system, the decentralisation policy, etc., are often pointed out. For example, Gary Cawker and Andrew Whiteford, Confronting
Unemployment in South Africa, Pretoria: Human Science Research Council, 1993,
Chapter 2.
10 Statistics South Africa, “Census in Brief”, Table 2.3.
11 The explanation for using this method reads, “Information on agricultural population derived from national population censuses or surveys is scare. In deriving estimates and projections of agricultural population presented in the table, FAO has largely relied on the close relationship existing between the ratio of economically active population (EAPA/TEAP) and the ratio of agricultural population to total population (AP/TP). For most countries the ratios were assumed to be equal, so that the agricultural population is derived as a product of the EAPA/TEAP value and total population”. FAO Yearbook