Mapping the Thai automotive value chain with
international input-output data
著者
Kuroiwa Ikuo
権利
Copyrights 2020 by author(s)
journal or
publication title
IDE Discussion Paper
volume
768
year
2020-03
INSTITUTE OF DEVELOPING ECONOMIES
IDE Discussion Papers are preliminary materials circulated
to stimulate discussions and critical comments
Keywords: value chain mapping, trade in value added, automotive industry
JEL classification: D57, F14, O53
* Chief senior researcher, Development Studies Centre, IDE ([email protected])
IDE DISCUSSION PAPER No.768
Mapping the Thai Automotive Value
Chain with International Input-Output
Data
Ikuo Kuroiwa*
March 2020
Abstract
This study explores how the automotive value chain has evolved in Thailand since the 1990s. Trade in value added analysis is applied to international input-output data. Moreover, the method of value chain mapping is introduced to illustrate the upstream and downstream transactions of goods and services along the value chain. The results show that international linkages have been strengthened by the expansion of production networks in East Asia, whereas domestic linkages started to decline after 2000. In addition, the value chain mapping analysis indicates that the Thai automotive industry achieved high self-sufficiency in automotive inputs, but still depended heavily on imported basic metals.
The Institute of Developing Economies (IDE) is a semigovernmental,
nonpartisan, nonprofit research institute, founded in 1958. The Institute merged
with the Japan External Trade Organization (JETRO) on July 1, 1998.
The
Institute conducts basic and comprehensive studies on economic and related
affairs in all developing countries and regions, including Asia, the Middle East,
Africa, Latin America, Oceania, and Eastern Europe.
The views expressed in this publication are those of the author(s). Publication does not imply endorsement by the Institute of Developing Economies of any of the views expressed within.
INSTITUTE OF DEVELOPING ECONOMIES (IDE), JETRO
3-2-2, WAKABA,MIHAMA-KU,CHIBA-SHI
CHIBA 261-8545, JAPAN
©2020 by author(s)
No part of this publication may be reproduced without the prior permission of the
author(s).
1. Introduction
1A country’s participation in global value chains (GVCs) has become an increasingly important strategy for economic development. Unlike in the past, today’s developing countries can take part in the GVCs of sophisticated products by specializing in a niche segment of a value chain. These developments are the result of the rapid decline in transportation and communication costs spurred by trade liberalization and technological development.
However, mere participation in GVCs is not sufficient. To sustain economic growth, there ought to be industrial deepening, which advances the formation of backward linkages by creating a robust supplier base (ADB, 2013). Industrial deepening is especially important for the automotive industry, which has strong agglomeration economies.
The advantages of industrial deepening or industrial agglomeration are manifold. First, industrial deepening increases the share of domestic value added in products and improves a country’s balance of payments position. Second, the increase in assembler industries stimulates the development of upstream industries in sequence from parts and component suppliers to materials and machinery manufacturers through backward linkage effects (Hirschman, 1958), leading to the upgrading of the industrial structure. Finally, the development of supplier industries brings about other benefits of agglomeration such as forward linkage effects, which increase the competitiveness of downstream industries by delivering parts and components at lower cost, in less time, and with more flexibility.
On the contrary, the declining transportation and communication costs have increased the benefits of specialization and trade, reaping significant gains from the fragmentation of production processes across borders. For instance, as some production processes of automotive parts—notable examples are a wiring harness and an automotive seat cover—are labor intensive, it would be more efficient to relocate such production facilities to low-income countries.2
which encourages local supplier development and strengthens domestic linkages. The second is the benefit of specialization and trade, which increases the share of foreign procurement and strengthens international linkages. It is therefore a matter of empirical evidence to demonstrate the types of linkages―domestic or foreign―that are strengthened during industrial development.
Against this background, the first aim of this study is to analyze the structural change in the Thai automotive value chain (including the formation of both domestic supplier bases and international production networks) and demonstrate which types of linkages―domestic or international―are strengthened during this process. The Thai automotive industry and its supplier bases have developed rapidly since the end of the 1980s. Concurrently, its value chain has increasingly become internationalized as a result of trade liberalization and regional integration efforts in East Asia since the early 1990s. In this paper, the method of trade in value added is employed to examine the structural change in input procurement and development of value chains since the 1990s.
Another aim of this study is to introduce the method of value chain mapping using international input-output data, which have recently been used to analyze the structure of vertical trade and decompose gross trade data (Hummels, Ishii, and Yi, 2001; Daudin, Rifflart, and Schweisguth, 2011; Johnson and Noguera, 2012; Koopman, Wang, and Wei, 2014; Wang, Wei, Yu, and Zhu 2017). However, no attempts to use international input-output data for value chain mapping have thus far been made. Hence, adopting value chain mapping, which was first introduced by Kuroiwa (2016), fills this void in research and provides objective information on both the upstream and the downstream transactions of goods and services as well as primary inputs (value added) and final outputs (final demand) throughout the value chain.
Two sets of international input-output data—the Institute of Developing Economies (IDE-JETRO) Asian Input-Output (AIO) tables for 1990, 1995, 2000, and 2005 and the Organization for Economic Cooperation and Development (OECD) Inter-Country Input-Output (ICIO) tables for 2000
and 2011 (2016 edition)—are used to conduct the trade in value added and value chain mapping analyses.
The remainder of this paper is organized as follows. Section 2 outlines the development of the Thai automotive industry. Section 3 reviews the literature. Section 4 explains the value chain mapping and trade in value added analyses. Section 5 examines the empirical results. The paper concludes with a summary of the findings in Section 6.
2. Summary of the Thai automotive industry
The import substitution policy of the automotive industry was introduced in Thailand in the 1960s. Subsequently, it was extended to automotive parts and components, and the local content requirement (LCR) emerged because of the government’s policy direction.
In the 1990s, the policy orientation changed dramatically. The import substitution policy was replaced by trade liberalization and export promotion; in 1991, the government allowed the importation of completely built vehicles with engines of less than 2300 cc and reduced the tariff on imported vehicles. In 1994, the government decided to grant a tax incentive to exporting firms in the industry.
Another turning point in the automotive industry policy direction came after the Asian financial crisis in 1997. To help local firms in financial distress, the government allowed a majority equity holding by foreign firms. In addition, it abolished the LCR in 2000 in accordance with the World Trade Organization’s Agreement on Trade-Related Investment Measures.
- Figure 1 -
Thailand’s automotive production started to increase rapidly at the end of the 1980s, although it plummeted temporarily during the periods of the Asian financial crisis (1997–1998), global financial crisis (2009), flooding (2011), and political conflict (2014).
Although exports of complete vehicles started in 1988, the Asian financial crisis triggered the rapid growth in vehicle exports. Consequently, the Thai automotive industry has become export-driven, with its share of exports exceeding 50 percent in recent years. It is particularly competitive in commercial vehicle exports, and Thailand has become known as the production hub of one-ton pickup trucks. In 2012, motor vehicle production reached 2.46 million units (with 1.02 million vehicles exported), making Thailand the ninth largest automotive manufacturer in the world.
In 2014, Japanese companies dominated the Thai automotive industry by accounting for 88.6 percent and 87.5 percent of Thailand’s domestic production and domestic market, respectively. In particular, Toyota had a close to 40 percent share in both domestic production and market size (Fourin, 2015). As discussed later in the paper, such a market structure significantly affects the procurement of parts and components for the Thai automotive industry.
3. Literature review
Many studies have been conducted on the automotive industry in Thailand because of its success in the developing world. Although many developing countries have tried to create an automotive industry through protectionist measures, few have become internationally competitive. Relevant research work can be classified into several categories. Among them, industrial policy is one of the most controversial issues owing to its mixed findings. For example, Wad (2009) and Busser (2008) conclude that industrial policy did not play a decisive role in the growth in the Thai automotive industry, whereas Hassler (2009) and Rock (2001) show the positive value of industrial policy.
Wad (2009), Athukorala and Kohpaiboon (2010), Warr and Kohpaiboon (2017) observe that the abolition of the LCR was a wholly positive aspect of economic liberalization, considering the heavy costs of the LCR on consumer welfare as well as investors’ reluctance to invest when the requirement was in place. On the other hand, Hassler (2009) and Natsuda and Thoburn (2012) contend that the LCR provided a basis for the further localization of the Thai automotive industry, which actually took place after the 1990s (Baba, 2005).
The other factor affecting the localization of the automotive industry is the benefits of spatial agglomeration or formation of industrial clusters. Industrial clusters are formed by market externalities such as transportation cost savings, labor market pooling, and knowledge spillovers (Marshall, 1920; Fujita, Krugman, and Venables, 1999; Rosenthal and Strange, 2004; Fujita and Thisse, 2013). In particular, transportation cost and time savings―in tandem with savings in inventory costs that can be achieved by introducing a just-in-time production system―are among the most important forces causing the localization of automotive parts. This is particularly relevant for heavy and bulky parts such as body parts and other stamping parts, whose production facilities are often located close to assemblers. As a result, these agglomeration forces are likely to stimulate the local procurement of automotive parts and development of automotive clusters. In the Thai context, a number of researchers, including Lecler (2002), Poangsakorn and Techakanont (2008), and Kuroiwa, Techakanont, and Keola (2017), demonstrate that automotive clusters were initially formed in Bangkok and its vicinity and then extended to the Eastern Seaboard after the 1990s.
By contrast, the reduction in service link costs3 is a force driving production fragmentation or vertical specialization (VS). When service link costs are reduced sufficiently, a labor-intensive production block will be separated from other blocks and relocated to a less-developed country (Jones and Kierzkowski, 1990; Arndt and Kierzkowski, 2001). In particular, production fragmentation is strong in East Asia owing to the existence of a large number of countries at different income levels
(Kimura and Ando, 2003).
As for the geographical sphere of automotive value chains, Dicken (2007) observes that rather than organizing operations on a global scale, leading automotive producers aim to create distinct production and marketing networks within Europe, North America, and East Asia. More specifically, Lall (2003) contends that production fragmentation is strong in the automotive sector,4
but the weight of the product and its high basic capability requirements mean that it only extends to a few proximate, relatively industrialized locations.
Indeed, Thailand has traditionally been highly dependent on Japan for automotive parts and components, but Japan’s share has been taken by neighboring East Asian countries such as ASEAN nations and China (Athukorala and Kohpaiboon, 2010; Warr and Kohpaiboon, 2017). At the same time, ASEAN countries and Australia have become an important market for the Thai automotive industry owing to the progress made by the ASEAN Free Trade Area and Thailand–Australia FTA, respectively (Kohpaiboon and Yamashita, 2011). In sum, the Thai automotive value chain has been increasingly regionalized owing to greater economic integration and rapid industrial development in East Asia.
4. Method
This study adopts two methods of input-output analysis: value chain mapping and the VS share and its decomposition method.
4.1 Value chain mapping
Value chain mapping, using international input-output data, was first introduced by Kuroiwa (2016). It demonstrates both the upstream and the downstream transactions of intermediate goods and services as well as value added (primary inputs) and final demand (final outputs). Moreover, unlike conventional value chain analysis, it covers direct (i.e., first-order) repercussion effects not only on
automotive parts5 but also on other intermediate goods and services such as machinery parts, metal products, and rubber and plastics products as well as trade, transport, and financial services. Further, value chain mapping captures the indirect (i.e., secondary or higher-order) repercussion effects on entire upstream industries, which may include basic metals, chemicals, minerals, and crude petroleum.
(1)
Upstream transactions
Using the conventional mathematical expression for the Leontief (demand-side) model, upstream transactions associated with one unit of final demand for a specific sector―say, sector j in country
s―can be obtained by post-multiplying the input coefficient matrix 𝐀𝐀 by the diagonal matrix 𝐋𝐋̂(𝒔𝒔)(𝒋𝒋): 𝐔𝐔(𝒋𝒋)(𝒔𝒔)=𝐀𝐀𝐋𝐋̂(𝒔𝒔)(𝒋𝒋), (1)
where 𝐋𝐋̂(𝒔𝒔)(𝒋𝒋) is the diagonal matrix of 𝐥𝐥(𝒋𝒋)(𝒔𝒔), which represents the column vector of the Leontief inverse
matrix and output of all sectors in all countries, induced by one unit of final demand for sector j in country s.
Similarly, induced value added―the remuneration paid for primary inputs such as labor compensation, profits, and indirect taxes—is calculated by post-multiplying the row vector of the value added coefficients (i.e., value added to output ratios) by 𝐋𝐋̂(𝒔𝒔)(𝒋𝒋):
𝐯𝐯(𝒋𝒋)(𝒔𝒔)′= 𝐯𝐯(𝐜𝐜)′𝐋𝐋̂(𝒔𝒔)(𝒋𝒋), (2)
where 𝐯𝐯(𝐜𝐜)′is the row vector of the value added coefficients for all sectors in all countries.
Equations (1) and (2) represent upstream intermediate transactions and value added (primary inputs), respectively, which are associated with one unit of motor vehicles, when sector j is designated as the motor vehicle sector in a country.
(2)
Downstream transactions
associated with one unit of primary inputs for sector i in country r can be given by pre-multiplying the output coefficient matrix B by the diagonal matrix 𝐆𝐆�(𝒊𝒊)(𝒓𝒓):
𝐃𝐃(𝒊𝒊)(𝒓𝒓)=𝐆𝐆�(𝒊𝒊)(𝒓𝒓)𝐁𝐁, (3)
where 𝐆𝐆�(𝒊𝒊)(𝒓𝒓) is the diagonal matrix of 𝐠𝐠(𝒊𝒊)(𝒓𝒓), which represents the row vector of the Ghosh inverse matrix (Ghosh, 1958) and indicates the output of all sectors in all countries induced by one unit of primary inputs for sector i in country r. As shown below, the Ghosh model in which downstream transactions are stimulated by upstream transactions is associated with forward linkages, whereas the Leontief model, which has the opposite transmission mechanism, is associated with backward linkages (Miller and Blair, 2009).
Final output (for household consumption, gross fixed capital formation, etc.) associated with one unit of primary inputs for sector i in country r is calculated as
𝐅𝐅(𝒊𝒊)(𝒓𝒓)=𝐆𝐆�(𝒊𝒊)(𝒓𝒓)𝐅𝐅(𝐜𝐜), (4)
where 𝐅𝐅(𝐜𝐜) is the matrix of the final demand coefficients (i.e., final demand to total output ratio). Equation (3) and Equation (4) represent the downstream intermediate transactions and final demand (final outputs), respectively, which are associated with one unit of motor vehicles when sector i is designated as the motor vehicle sector.
4.2 VS share and its decomposition method
The VS share represents the percentage share of foreign content embodied in exports (i.e., the share of value added induced by exports but that accrues to foreign countries). Therefore, the VS share indicates the true dependency on foreign inputs.7 The VS share of sector j in country s―equivalent to Equation (40) in Koopmans, Wang, and Wei (2014)―can be expressed as
𝑉𝑉𝑉𝑉(𝑗𝑗)(𝑠𝑠) share=100 X ∑𝑟𝑟≠𝑠𝑠𝑚𝑚 ∑𝑖𝑖=1𝑛𝑛 𝐯𝐯(c)𝑖𝑖𝑟𝑟𝑳𝑳(𝒋𝒋)𝒊𝒊(𝒔𝒔)𝒓𝒓= 100 X ∑𝑚𝑚𝑟𝑟≠𝑠𝑠∑𝑛𝑛𝑖𝑖=1𝐯𝐯(𝑗𝑗)𝑖𝑖(𝑠𝑠)𝑟𝑟, (5)
Leontief inverse matrix that represents the output of sector i in country r induced by one unit of export demand for sector j in country s. Thus, 𝐯𝐯(𝑗𝑗)𝑖𝑖(𝑠𝑠)𝑟𝑟 indicates the value added (in sector i in country r)
induced by export demand (for sector j in country s). The VS share is closely related to upstream transactions under value chain mapping. Indeed, the VS share can be calculated by aggregating the induced foreign value added obtained from Equation (2) across countries and sectors. Therefore, as in value chain mapping, the VS share captures both the direct and the indirect repercussion effects on overseas industries.
Moreover, the 𝑉𝑉𝑉𝑉(𝑗𝑗)(𝑠𝑠) share can be decomposed as follows:
(i)
The share of foreign content by country of origin (
𝑟𝑟) is calculated by
𝑉𝑉𝑉𝑉_𝑓𝑓(𝑗𝑗)(𝑠𝑠)𝑟𝑟share =100 X ∑𝑛𝑛 𝐯𝐯(𝑗𝑗)𝑖𝑖(𝑠𝑠)𝑟𝑟
𝑖𝑖=1 , (6)
where, if r=s in Equation (6), the above index represents the share of domestic content.
(ii)
The share of foreign content by industry of origin (i) is given by
𝑉𝑉𝑉𝑉_𝑓𝑓(𝑗𝑗)𝑖𝑖(𝑠𝑠) share =100 X ∑𝑚𝑚 𝐯𝐯(𝑗𝑗)𝑖𝑖(𝑠𝑠)𝑟𝑟.
𝑟𝑟≠𝑠𝑠 (7)
In sum, the 𝑉𝑉𝑉𝑉_𝑓𝑓(𝑗𝑗)(𝑠𝑠)𝑟𝑟share and 𝑉𝑉𝑉𝑉_𝑓𝑓(𝑗𝑗)𝑖𝑖(𝑠𝑠) share can be derived from Equation (5) by aggregating 𝐯𝐯(𝑗𝑗)𝑖𝑖(𝑠𝑠)𝑟𝑟 across industries and countries, respectively.
5. Empirical results
This section examines first the procurement of intermediate inputs by the Thai automotive industry during 1990–2011 and then the results of the analyses for VS share and value chain mapping.
5.1. Procurement of intermediate inputs (1990–2011)
Using the AIO tables for 1990, 1995, 2000, and 2005 and ICIO tables for 2011 (2016 edition), Figure 2 indicates the percentage shares of all intermediate inputs; these include not only automotive parts and components, but also other parts, materials, and services used by the Thai automotive industry.
Figure 2 shows that the share of domestic procurement increased from 32.6 percent to 45.2 percent during 1990–20008 but declined slightly to 44.6 percent in 2005. The declining trend continued until 2011. The share of domestic procurement continued to rise until the LCR was abolished in 2000.
― Figure 2 ―
The share of procurement from ASEAN countries continued to rise from less than 2 percent to more than 5 percent during 1990–2005, while the share of Japan as well as the rest of the world (ROW) declined substantially. However, the share of the ROW, which includes China, increased in 2011. Among the factors that affected the shift in source countries (i.e., the increasing trend of domestic procurement until 2000 and that of foreign procurement after 2000), the following factors appear to be important.
(1) LCR
After the LCR was introduced in 1975, the level of local content imposed by the government continued to increase until the end of the 1980s. The high-level LCR continued until it was abolished in 2000. More specifically, the LCR was gradually increased from 25 percent for passenger cars in 1975 to 54 percent in 1990; the LCRs for petrol-fueled and diesel-fueled pick-up trucks were raised to 60 percent and 72 percent, respectively (Wattanasiritham, 2000).
The LCR policy raised the costs of automotive parts and thus negatively affected the efficiency of motor vehicle production.9
However, despite these costs, it helped engage local and foreign suppliers in the supply chain and increased the share of domestic procurement.10 For example, Table 1 shows that the number of Thai firms established in the respective periods outnumbered foreign firms and joint ventures and that they grew substantially during 1986–1999. Moreover, many foreign parts
suppliers, particularly Japanese suppliers, made investments to comply with assemblers requests. Table 1 shows that the number of Japanese investments started to increase rapidly in the mid-1980s.
― Table 1 ―
Table 2 reveals that the types of parts produced in Thailand also increased in the same period. In particular, the number of technologically sophisticated parts such as engine parts grew substantially owing to the LCR that was specifically imposed on engine parts during 1989–1998; engine manufacturers had to increase local content every year, from 20 percent in 1989 to 70 percent in 1998.11
By contrast, Warr and Kohpaiboon (2017) contend that manufacturers are strongly averse to restrictions on their input procurement decisions. Hence, the abolishment of the LCR attracted more investment and thus helped raise local content. Warr and Kohpaiboon (2017) show that the value of imported parts per locally assembled vehicle continued to decrease even after 2000 (although only until 2005), a result that partially conflicts with that shown in Figure 1.12
As discussed below (see also Warr and Kohpaiboon, 2017), agglomeration economies induce higher local content without policy intervention. Thus, policy intervention such as the LCR becomes unnecessary once the critical mass of industrial agglomeration is established. However, whether the critical mass can be achieved without policy intervention remains an open question.
― Table 2 ―
(2) Local procurement and forward linkage effects
import liberalization of completely built vehicles, tariff reductions, and removal of barriers to market entry in the early 1990s. Since then, automotive assemblers have been forced to reduce production costs and increase competitiveness in the market. Since many automotive parts and components are heavy and bulky, the option of procuring them locally would reduce transportation and logistics costs and enhance the competitiveness of assemblers; this agglomeration effect, called the forward linkage effect, is expected to attract more assemblers to the host country (Fujita, Krugman, and Venables, 1999). In addition, local procurement facilitates just-in-time production and delivery, which lowers inventory costs.13 Thus, assemblers have strong incentives to request parts suppliers to be located in their vicinity.
(3) Growth in vehicle production and backward linkage effects
Owing to scale economies, there is a certain threshold production volume at which the costs of procuring parts and components locally become lower than those of procuring them from the international market. When this occurs, rapid growth in motor vehicle production would induce the establishment of local suppliers and increase domestic procurement; this agglomeration effect (i.e., backward linkage effect) is expected to tempt more parts suppliers to the host country. As Figure 1 shows, Thai vehicle production volume has grown rapidly since the end of the 1980s, accompanied by a significant rise in the number of automotive parts suppliers (Tables 1 and 2).
(4) Formation of automotive production networks in East Asia
The above three factors contributed to increasing the domestic procurement of automotive parts. However, as shown in Figure 2, the share of domestic procurement started to decline after 2000. At this turning point around 2000, the benefits of specialization and trade, including those associated with trade in parts and components in the region, became greater than the benefits of agglomeration:
moreover, automotive exports, which have increased dramatically since the end of the 1990s, may have raised demand for imported inputs because international markets require higher product quality. As a result, production networks started to expand rapidly across national boundaries and international linkages strengthened, especially with neighboring countries in East Asia. In the next subsection, we focus on the structural change that occurred in 2000–2011 when the share of domestic procurement started to decline as a result of expanding production networks.
5.2. VS structure (2000–2011)
In this subsection, the OECD ICIO tables for 2000 and 2011 (2016 edition) are used to calculate the VS share and examine the development of cross-border production networks.
(1) VS share
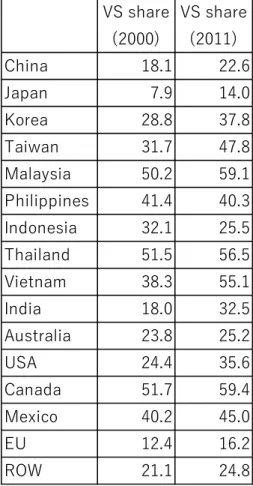
Table 3 shows the VS share of the automotive industry in 16 countries or regions, which are regroupings of the 62 countries or regions covered in the original ICIO tables. As in many other countries (with the exception of the Philippines and Indonesia), the VS share of the Thai automotive industry increased from 51.5 percent to 56.5 percent during 2000–2011. This implies that as the Thai automotive industry became more integrated into GVCs, its dependency on foreign content increased, consistent with the declining domestic procurement after 2000 shown in Figure 2.
― Table 3 ―
ASEAN countries such as Malaysia, Thailand, and Vietnam had relatively high VS shares, exceeding 50 percent in 2011. Canada and Mexico—members of the North American Free Trade Agreement—also had high VS shares. These facts suggest that small and open economies actively
involved in production networks tend to have high VS shares. By contrast, larger economies such as Japan, the European Union (EU), and China had relatively low VS shares, whereas the United States, which is closely integrated with the North American automotive value chain, was the notable exception.
In sum, although the automotive industry has strong agglomeration economies, the benefits of specialization and trade have gained ascendancy over the benefits of agglomeration owing to trade liberalization and economic integration. In this regard, the geographical spread of automotive value chains, as demonstrated by the increasing VS, is not unique to East Asia. In the next section, the VS share of Thai automotive exports is subdivided into its constituent elements.
(2) Decomposition of the VS share
Table 4 shows the share of foreign content in Thai automotive exports by country of origin (Equation (6)). Japan’s content was the largest among all countries, reflecting the fact that the Thai automotive industry has been dominated by Japanese companies. However, Japan’s share declined sharply from 21.9 percent to 14.9 percent during 2000–2011. Other developed countries/regions such as the EU and the United States have also seen a substantial decline in their shares.
― Table 4 ―
East Asian countries, on the contrary, demonstrate the opposite trend. In particular, Southeast Asian countries and China have increased their shares; the share of ASEAN countries as a whole rose from 4.7 percent to 6.2 percent during 2000–2011 and that of China increased from 1.7 percent to 6.5 percent. Moreover, the shares of Korea, India and Mexico as well as Australia and Canada have also increased. Hence, the shift in sourcing intermediate inputs from Japan and other developed countries to neighboring East Asian (i.e., Northeast Asian and Southeast Asian) nations and emerging
automotive manufacturing countries has been drastic.
Table 5 presents the share of foreign content, by industry of origin, in Thai automotive exports (Equation (7)). Wholesale and retail trade had the highest share (10.2 percent in 2000 and 2011). Other services such as transportation, financial intermediation, research and development, and other business activities also had higher foreign than domestic content shares. These results suggest that a great amount of service content was imported to produce automotive exports.14 Service content rises further when measured in value added terms because a variety of services are used as inputs for manufactured goods and thus a substantial amount of service content is imported indirectly through manufacturing trade.
― Table 5 ―
The shares of both basic metals and mining15
are significantly high. Moreover, they increased rapidly and even exceeded 8 percent in 2011. There was higher dependency on importing basic metals owing to the weak production capacity of the basic metals industry, whose domestic content was less than 1 percent. Similarly, other material industries such as chemicals, rubber and plastics, and fabricated metal products also had high foreign content shares. This finding implies that the actual dependency on domestic inputs (i.e., domestic content) was significantly lower than the nominal local content, which is calculated based on assemblers’ domestic sourcing of intermediate inputs, because a large proportion of value added leaked out of the country in the upstream production process.
By contrast, the domestic content share of the motor vehicle sector exceeded 25 percent, while its foreign content share decreased to only 3.5 percent in 2011. This reflects a remarkable achievement in the localization efforts for parts and components. Similarly, machinery and equipment achieved a relatively high domestic content share (3.6 percent in 2000 and 2.2 percent in 2011), whereas other
machinery industries such as computer, electronic and optical equipment, and electrical machinery still had low shares.
5.3. Mapping the automotive value chain (2000–2011)
The separate decomposition of the VS share shows how much value added is generated by country of origin (Table 4) and sector of origin (Table 5). Value chain mapping, on the contrary, combines this information to demonstrate how much value added as well as intermediate transactions are generated in a specific country-sector pair throughout the value chain.
(1) Upstream transactions
Figures 3a and 3b show the upstream intermediate transactions of goods and services as well as value added associated with one unit of motor vehicle demand in Thailand (Equations (1) and (2)). Here, one unit is normalized to 100 units, and thus only induced intermediate transactions and value added that exceed one unit (i.e., 1 percent of original motor vehicle demand) are shown in the figure.16
― Figures 3a and 3b ―
Figure 3a shows that in 2000, 27.1 units of Thai motor vehicle outputs were used as inputs for its own industry. Simultaneously, motor vehicle outputs were provided by Japan (9.5 units), the EU (2.3 units), and the Philippines (1.2 units). In addition, machinery and equipment, basic metals, and rubber and plastic products constitute major inputs for the motor vehicle sector. Service inputs such as wholesale and retail trade, transportation, and electricity, gas, and water supply also occupy a high share. As a result, high value added was generated in such sectors as motor vehicles (25.5 units), wholesale and retail trade (5.1 units), and machinery and equipment (3.6 units).
Foreign inputs were highly concentrated on Japan; in particular, they were high in motor vehicles, wholesale and retail trade, basic metals, and machinery and equipment, reflecting the fact that the Thai automotive industry has been dominated by Japanese firms. In addition, the motor vehicle sector exceeded 1 percent in the EU and the Philippines, while basic metals did so in the ROW. In 2011, source countries of intermediate inputs became more diversified. In addition to Japan and the ROW, China, Korea, and Australia became major suppliers of basic metals. At the same time, backward linkages with Japanese industries weakened significantly, as they were replaced by those in neighboring East Asian countries.
(2) Downstream transactions
Because the motor vehicle industry—more specifically, assembling motor
vehicles—is close to the final market, downstream intermediate transactions of motor
vehicles are expected to be relatively rare. However, its parts and components, which
constitute an important part of the motor vehicle industry, are used as inputs for its own
industry. In addition, other industries such as trade and transportation may use them
actively in their operations.
Figures 4a and 4b show the downstream intermediate transactions of goods and
services as well as those of final outputs; these are associated with 100 units of motor
vehicle primary inputs (value added) in Thailand (Equations (3) and (4)).
― Figures 4a and 4b ―
Figure 4a shows that, in 2000, 27.1 units of motor vehicle outputs were used as inputs for its own industry, whereas the largest domestic transactions were in gross fixed capital formation (28.3 units)17
and household consumption (14.9 units). In foreign markets, motor vehicle outputs were used as inputs and distributed to the motor vehicle industry in the EU (4.9 units), Japan (2.9 units), Australia (1.2 units), and the ROW (1.1 units). However, a greater proportion was destined for capital formation and household consumption in the EU (5.1 units and 7.9 units, respectively), Japan (1.1 units and 1.6 units), Australia (1.9 units and 2.8 units), the United States (1.1 units for household consumption), and the ROW (3.0 units and 2.2 units). In addition, some foreign final outputs were induced indirectly through intermediate transactions; for example, 4.9 units of motor vehicle outputs were induced in the EU by inputs from the Thai motor vehicle industry and the EU motor vehicle industry induced 1.3 units of motor vehicle outputs for capital formation and 2.2 units for household consumption in the EU.
In 2011, countries closely linked to the Thai motor vehicle industry changed substantially. In particular, the Thai motor vehicle industry provided inputs and strengthened forward linkages with neighboring Southeast Asian countries such as Indonesia and Malaysia; simultaneously, in addition to the Philippines and Australia, they have become an important market for the complete motor vehicles assembled in Thailand. The ASEAN Free Trade Area and other regional integration efforts, such as the ASEAN-Australia-New Zealand FTA, have facilitated trade not only in parts and components but also in complete motor vehicles in these countries. On the contrary, linkages with Japanese and EU industries have substantially weakened, as shown in Figure 4b.
6. Conclusion
In the Thai automotive industry, the share of the domestic procurement of intermediate inputs continued to rise during 1990–2000 but declined during 2000–2011. Moreover, our trade in value added analysis demonstrates that the foreign content of Thai automotive exports increased in the latter period. These results suggest that the dependency on domestic procurement initially increased but started to decline after around 2000.
Although a more detailed analysis is necessary, the abolition of the LCR in 2000 as well as trade liberalization and regional integration efforts since the early 1990s appear to have affected the trend of sourcing intermediate inputs. As a result, although the automotive industry has strong agglomeration economies, the benefits from specialization and trade have gained ascendancy over those from agglomeration and thus international linkages have strengthened, especially with neighboring East Asian countries.
The decomposition analysis of foreign content shows that Japan had the largest foreign content share, but that its share declined significantly during 2000–2011. By contrast, the shares of Southeast Asian countries and China increased substantially owing to the economic integration and rapid industrial development in these countries. It also shows that a large amount of service content was imported to produce automotive exports because services are used as inputs for manufactured goods; thus, a substantial amount of service content is imported indirectly through manufacturing trade. In the manufacturing sector, Thailand had higher dependency on the import of basic metals owing to the weak production capacity of the domestic basic metals industry.
Other material industries such as chemicals, rubber and plastics, and fabricated metal products also had high foreign content shares, suggesting that the actual dependency on domestic inputs was significantly lower than the nominal local content indicates because a large proportion of value added leaked out of the country in upstream production processes. On the contrary, the motor vehicle industry had a strikingly high domestic content.
The value chain mapping analysis also shows that the Thai motor vehicle industry achieved high self-sufficiency in its parts and components but had high dependency on basic metals imported from Japan, China, Korea, and Australia. Downstream intermediate transactions in the motor vehicle sector are relatively scarce, but a proportion of motor vehicle outputs was used as inputs for its own industry, whereas a greater proportion was used either for fixed capital formation or household consumption in
both domestic and foreign markets. In particular, the Thai motor vehicle industry strengthened linkages with neighboring Southeast Asian countries and Australia, where the ASEAN Free Trade Area and other regional integration efforts facilitated trade not only in parts and components but also in complete motor vehicles.
References
Arndt, S. W. and H. Kierzkowski (2001), Fragmentation: New Production Patterns in the World
Economy, Oxford: Oxford University Press.
Athukorala, P.-C. and A. Kohpaiboon (2010), Thailand in Global Automobile Networks, International Trade Centre.
Asian Development Bank [ADB] (2013), Asia’s Economic Transformation: Where to, How, and How Fast?, Part 1 Special Chapter in Key Indicators for Asia and the Pacific.
Baba, T. (2005), Supporting Industries in Asia (in Japanese Ajia no Susono Sangyo). Tokyo: Hakuto Shobo.
Busser, R. (2008), ‘Detroit of the East Asia’? Industrial Upgrading, Japanese Car Producers and the Development of the Automotive Industry in Thailand, Asia Pacific Business Review, 14 (1): pp. 29-45.
Daudin, G., C. Rifflart and D. Schweisguth (2011), Who Produces for Whom in the World Economy?, Canadian Journal of Economics, 44, pp. 1403–1437.
Dicken, P. (2007), Global Shift: Mapping the Changing Contours of the World Economy (5th Edition), London: SAGE Publications.
Dyer, J. H. (1994), Dedicated Assets: Japan’s Manufacturing Edge, Harvard Business Review, November-December: pp. 174-88.
Fourin, 2015. Vehicle Production and Sales Data, Nagoya, Aichi (Japan): Fourin.
Fujita, M., P. Krugman, and A.J. Venables (1999), Spatial Economies: Cities, Regions, and
International Trade. Cambridge, Mass.: MIT Press.
Fujita, M. and J.-F. Thisse (2013), Economics of Agglomeration: Cities, Industrial Location, and
Globalization (2nd edition), Cambridge: Cambridge University Press.
Ghosh, A. (1958), Input-Output Approach to an Allocation System, Econometrica, 25, pp. 58-62. Hassler, M. (2009), Variations of Value Creation: Automobile Manufacturing in Thailand,
Environment and Planning A, 41: pp. 2232-2249.
Hirschman, A.O. (1958), The Strategy of Economic Development. New Haven, Conn.: Yale University Press.
Hummels, D., J. Ishii, and K. Yi. (2001), The Nature and Growth of Vertical Specialisation in World Trade, Journal of International Economics, 54, pp. 75-96.
Jones, R. W. and H. Kierzkowski (1990), The Role of Services in Production and International Trade: A Theoretical Framework, in R. W. Jones and A. Kruger (eds) The Political Economy of
International Trade: Essays in Honor of Robert E. Baldwin, Oxford: Basil Blackwell.
Johnson, R. and G. Noguera (2012), Accounting for Intermediates: Production Sharing and Trade in Value-added, Journal of International Economics, Vol. 86: pp. 224-236.
Kimura, F. and M. Ando (2003), The Economic Analysis of International Production/Distribution Networks in East Asia and Latin America: The Implication of Regional Trade Arrangements.
Business and Politics, 7 (1), Article 2.
Koopman, R., Z. Wang, and S. J. Wei. (2014), Tracing Value Added and Double-Accounting in Gross Exports, American Economic Review 104(2): pp. 459-494.
Kohpaiboon, A. and N. Yamashita (2011), FTAs and the Supply Chain in the Thai Automotive Industry, in Findlay, C. (ed.) ASEAN + 1 FTAs and Global Value Chains in East Asia. ERIA Research Project 2010-29, Jakarta: ERIA: pp321-362.
Kuroiwa, I. (2016), Mapping Agricultural Value Chains with International Input-Output Data, IDE
Discussion Paper No. 623. Chiba: Institute of Developing Economies-Japan External Trade
Organization (IDE-JETRO).
Kuroiwa, I., K. Techakanont, and S. Keola (2017), Testing Localization of Thai Automotive Industries,
IDE Discussion Paper No. 693. Chiba: Institute of Developing Economies-Japan External
Trade Organization (IDE-JETRO).
Lall, S. (2003), Reviving Industrial Strategy: The Role of Government Policy in Building
Industrial Competitiveness, G-24 Discussion Paper 28.
Lall, S., M. Albaladejo, and J. Zhang. 2004. Mapping fragmentation: electronics and automobiles in Southeast Asia and Latin America. Oxford Development Studies
32(3): 407-32.
Lecler, Y. (2002), The Cluster Role in the Development of the Thai Car Industry, International Journal
of Urban and Reginal Research, vol. 26.4, pp 799-814.
Marshall, A. (1920), Principle of Economics. London: Macmillan.
Miller, R. E. and P. D. Blair (2009), Input-Output Analysis: Foundations and Extensions, Second
Natsuda, K. and J. Thoburn (2012), Industrial Policy and the Development of the Automobile Industry in Thailand, Journal of the Asia Pacific Economy. 18(3), pp. 417-37.
Poapongsakorn, N. and K. Techakanont (2008), The Development of Automotive Clusters and Production Networks in Thailand in I. Kuroiwa and T. M. Heng (ed.) Production Networks
and Industrial Clusters in Southeast Asia: Integrating Economies in Southeast Asia,
Singapore: ISEAS.
Rock, M. (2001), Selective Industrial Policy and Manufacturing Export Success in Thailand. In K. S. Jomo (ed.) Southeast Asia’s Industrialization. London: Palgrave.
Rosenthal, S.S. and W.C. Strange (2004), Evidence on the Nature and Sources of Agglomeration Economies in J. Vernon Henderson and Jacques-Francois Thisse (ed.), Handbook of
Regional and Urban Economies Volume 4. Amsterdam: North Holland.
Techakanont, K. (2011), Thailand Automotive Parts Industry in Mitsuhiro Kagami (ed.), Intermediate
Goods Trade in East Asia: Economic Deepening Through FTAs/EPAs, BRC Research Report
No. 5. Bangkok Research Centre, Institute of Developing Economies-Japan External Trade Organization, Bangkok, Thailand.
Wad, P. (2009), The Automobile Industry of Southeast Asia: Malaysia and Thailand, Journal of the
Asia Pacific Economy, 14 (2): 172-193.
Wang, Z., S.-J. Wei, X. Yu, and K. Zhu. (2017), Measures of Participation in Global Value Chains and Global Business Cycles. NBER Working Paper 23222.
Wang, Z., S.-J. Wei, X. Yu, and K. Zhu. 2017b. Characterizing Global Value Chains: Production Length and Upstreamness. NBER Working Paper 23261.
Warr, P. and Kohpaiboon A (2017), Thailand’s Automotive Manufacturing Corridor, ADB Economics
Working Paper Series No. 519.
Wattanasiritham, S. (2000). The Impact of Local Content Requirement Policy on the Development of
Thai Auto-Parts Industry: Case of Engine Industry. Unpublished master thesis, Graduate
Appendix: Sector Classification of the OECD ICIO Tables
AGR Agriculture, hunting, forestry, and fishing MIN Mining and quarrying
FOD Food products, beverages, and tobacco
TEX Textiles, textile products, leather, and footwear WOD Wood and products of wood, and cork
PAP Pulp, paper, paper products, printing, and publishing PET Coke, refined petroleum products, and nuclear fuel CHN Chemicals and chemical products
RBP Rubber and plastics products NMM Other non-metallic mineral products MET Basic metals
FBM Fabricated metal products MEQ Machinery and equipment, nec
CEO Computer, electronic, and optical equipment ELQ Electrical machinery and apparatus, nec MTR Motor vehicles, trailers, and semi-trailers TRQ Other transport equipment
OTM Manufacturing nec; recycling EGW Electricity, gas, and water supply CON Construction
WRT Wholesale and retail trade; repairs HTR Hotels and restaurants
TRN Transport and storage PTL Post and telecommunications FIN Financial intermediation REA Real estate activities
RMQ Renting of machinery and equipment ITS Computer and related activities
BZS Research and development and other business activities GOV Public admin. and defense; compulsory social security EDU Education
HTH Health and social work
OTS Other community, social, and personal services PVH Private households with employed people HC Household consumption
NPI Non-profit institution serving household GGF General government final consumption GFC Gross fixed capital formation
INV Changes in inventories
CON Direct purchase abroad by residents DISC Discrepancies
VA Value added
CT Output at basic prices Source: ICIO tables (OECD).
Figure 1. Domestic Production, Domestic Sales, and Exports of Automobiles in Thailand (1961–2014)
Source: Author’s calculation based on data from the Thailand Automotive Club, Federation of Thai Industries. 500 1,000 1,500 2,000 2,500 196 1 196 3 196 5 196 7 196 9 197 1 197 3 197 5 197 7 197 9 198 1 198 3 198 5 198 7 198 9 199 1 199 3 199 5 199 7 199 9 200 1 200 3 200 5 200 7 200 9 201 1 201 3 (Unit: 1,000 vehicles) Domestic Production Domestic sales Export
Figure 2. Procurement of Intermediate Inputs by Country or Region: Motor Vehicle Sector in Thailand (1990–2011)
Source: Calculated from the Asian input-output tables for 1990, 1995, 2000, and 2005 (IDE-JETRO) and from the ICIO table for 2011 (2016 edition. OECD).
Note 1: The bars show the percentage shares of intermediate inputs provided by respective countries or regions. In the Asian tables, ASEAN includes Indonesia, Malaysia, Singapore, and the Philippines. Note 2: Care should be taken when comparing the results for 1990–2005 with those for 2011 because different international input-output data are used for the calculation.
0% 10% 20% 30% 40% 50% 60% 70% 80% 90% 100% 1990 1995 2000 2005 2011
Figure 3a. Flow of Upstream Transactions: Motor Vehicle Sector in Thailand (2000)
Source: Calculated from the ICIO table for 2000 (OECD).
Note 1: For the sector classification, see the Appendix.
Note 2: Arrows show the direction of the repercussion effects, and these are drawn based on the input-output relationship calculated from Equations (1) and (2).
Primary input (V.A.) Intermediates (2) Intermediates (1) final output
THA MTR THA MTR
25.5 100
THA WRT THA MTR
5.1 27.1
THA MEQ THA MEQ THA MEQ
3.6 5.0 10.2
THA FIN THA WRT
2.1 4.6
THA EGW THA MET
1.6 2.4
THA TRN THA TRN
1.2 2.1
THA MET THA RBP
1.1 2.0 THA EGW JPN WRT 1.7 5.8 THA FIN JPN MTR JPN WRT 1.6 4.0 2.1 THA CHN JPN MET 1.5 2.1 JPN MEQ JPN MTR JPN MTR 1.6 6.2 9.5 JPN TRN JPN WRT 1.1 3.6 JPN BZS JPN MET JPN MET 1.0 3.1 2.0 JPN MEQ EU WRT 1.9 1.2 PHL MTR ROW MIN 1.2 2.1 EU MTR 2.3 ROW MET 1.6
Figure 3b. Flow of Upstream Transactions: Motor Vehicle Sector in Thailand (2011)
Source: Calculated from the ICIO tables for 2011 (OECD). Note 1: For the sector classification, see the Appendix.
Note 2: Arrows show the direction of the repercussion effects, and these are drawn based on the input-output relationship calculated from Equations (1) and (2).
Primary input (V.A.) Intermediates (2) Intermediates (1) final output
THA MTR THA MTR
25.7 100
THA WRT THA MTR
3.3 24.5
THA FIN THA MEQ THA MEQ
2.3 2.4 7.3
THA MEQ THA MET
2.2 3.2
THA EGW THA WRT
1.2 3.0 THA RBP JPN WRT 2.4 3.8 THA ELQ JPN MET 2.1 3.2 THA FIN JPN MTR 1.9 1.9 THA EGW 1.7 CHN MET THA FBM 1.0 1.4 THA TRN ROW MIN JPN MTR 1.1 5.1 3.5 ROW WRT JPN WRT JPN MTR 1.5 1.2 5.0
ROW MET JPN MET JPN MET
1.4 4 4.1
JPN WRT 2.4
CHN MET CHN MET
1.8 1.6
KOR MET KOR MET
2.0 1.5
PHL MTR 1.2 AUS MET
2.0
ROW MIN ROW MET
Figure 4a. Flow of Downstream Transactions: Motor Vehicle Sector in Thailand (2000)
Source: Calculated from the ICIO tables for 2000 (OECD). Note 1 : For the sector classification, see the Appendix.
Note 2: Arrows show the direction of the repercussion effects, and these are drawn based on the input-output relationship calculated from Equations (3) and (4).
Primary input (V.A.) Intermediate (1) Intermediate (2) Final output
THA MTR THA GFC 100 28.3 THA MTR THA HC 27.1 14.9 THA WRT THA HC 6.0 1.1 THA TRN 2.2 JPN MTR JPN GFC 1.9 1.1 JPN MTR JPN HC .2.9 1.1 JPN HC EU MTR 1.6 1.7 EU MTR EU GFC 4.9 1.3 EU HC AUS MTR 2.2 1.2 EU GFC 5.1 ROW MTR EU HC 1.1 7.9 AUS GFC 1.9 AUS HC 2.8 USA HC 1.1 ROW GFC 3.0 ROW HC 2.2
Figure 4b. Flow of Downstream Transactions: Motor Vehicle Sector in Thailand (2011)
Source: Calculated from the ICIO tables for 2011 (OECD). Note 1 : For the sector classification, see the Appendix.
Note 2: Arrows show the direction of the repercussion effects, and these are drawn based on the input-output relationship calculated from Equations (3) and (4).
Primary input (V.A.) Intermediate (1) Intermediate (2) Final output
THA MTR THA GFC
100 31.3
THA MTR THA HC
24.5 12.0
THA WRT THA INV
2.3 2.0 JPN MTR JPN MTR MYS GFC 1.6 1.1 1.4 IDN GFC MYS MTR 1.4 1.3 IDN HC 2.2
IDN OTS IDN HC
2.0 1.10 IDN MTR 1.8 PHL GFC 1.4 ROW MTR 2.4 AUS GFC ROW OTS 3.3 2.0 AUS HC 3.1 EU HC 1.1 ROW GFC 8.1 ROW HC 3.8
Table 1. Ownership Types by Periods of Establishment: Thai Automotive Industry
Source: Calculated from the Thailand Automotive Industry Directory 2014.
-1960 1961-75 1976-85 1986-99 2000-14 Thai firms 8 69 97 297 102 Foreign firms 0 14 6 163 55 (Japanese firms) 0 9 4 115 33 Joint Venture 4 22 18 123 35 Unknown 11 56 71 302 197 Total 23 161 192 885 389
Table 2. Types of Parts by Periods of Establishment: Thai Automotive Industry
Source: Calculated from the Thailand Automotive Industry Directory 2014.
Note 1. Parts of other transport machinery such as motorcycles and agricultural machinery are included in the data.
Note 2. The number of types of parts is greater than the number of establishments because each establishment (or plant) may produce more than one type of part.
-1960 1961-75 1976-85 1986-99 2000-14
Engine 9 58 51 253 89
Drive train 1 7 11 52 29
Suspension / steering / wheel & tire 4 22 40 110 48
Axle/brake/body control, 1 19 28 125 53
Body and exterior 4 35 47 170 78
Interior 1 15 23 94 49
Climate control 3 11 22 68 25
Driving support & security 0 2 6 22 7
Electronic/electrical parts 1 11 17 95 26
Small/general parts 4 39 52 199 77
Categories by production process 3 41 61 260 124
Motorcycle parts 5 44 67 263 94
Automobile assembly 4 8 1 18 9
Agricultural machinery and other transport machinery 3 16 22 44 29
Chemical, oil, lubricant, paint, etc. 2 18 17 61 25
Accessories 0 13 16 61 28
Service (trading, logistics, trade show, training, etc.) 6 35 32 154 107
Machine tools, jigs and fixtures, moulds and dies, etc. 1 9 19 68 36
Table 3. VS (Foreign Content) Share: Motor Vehicle Sector in 16 Countries or Regions (2000, 2011)
Source: Calculated from the ICIO tables for 2000 and 2011 (OECD).
Note: The original OECD ICIO table contains 62 countries or regions, but these are aggregated into 21 countries or regions for this study; of these 21, only 16 have a motor vehicle assembly industry.
VS share (2000) VS share (2011) China 18.1 22.6 Japan 7.9 14.0 Korea 28.8 37.8 Taiwan 31.7 47.8 Malaysia 50.2 59.1 Philippines 41.4 40.3 Indonesia 32.1 25.5 Thailand 51.5 56.5 Vietnam 38.3 55.1 India 18.0 32.5 Australia 23.8 25.2 USA 24.4 35.6 Canada 51.7 59.4 Mexico 40.2 45.0 EU 12.4 16.2 ROW 21.1 24.8
Table 4. Decomposition of the VS (Foreign Content) Share by Country of Origin: Motor Vehicle Sector in Thailand (2000, 2011)
Source: Calculated from the ICIO tables for 2000 and 2011 (OECD).
Note: ASEAN includes Singapore, Malaysia, Brunei Darussalam, the Philippines, Indonesia, Vietnam, and Cambodia. VS share (2000) VS share (2011) Foreign content 51.5 56.5 China 1.7 6.5 Japan 21.9 14.9 Korea 1.4 2.2 Taiwan 1.4 1.1 Hong Kong 0.5 0.3 Singapore 1.3 0.9 Malaysia 1.2 1.3 Brunei Darussalam 0.1 0.1 Philippines 1.0 1.2 Indonesia 0.7 2.3 Vietnam 0.3 0.3 Cambodia 0.0 0.0 (ASEAN) 4.7 6.2 India 0.4 1.0 Australia 1.3 3.1 New Zealand 0.1 0.1 USA 3.7 2.9 Canada 0.3 0.5 Mexico 0.2 0.4 EU 8.0 6.2 ROW 6.2 11.1 Domestic content 48.5 43.5 Total content 100 100
Table 5. Decomposition of the VS (Foreign Content) and Domestic Content Shares by Industry of Origin: Motor Vehicle Sector in Thailand (2000, 2011)
Source: Calculated from the ICIO tables for 2000 and 2011 (OECD). Note: For the sector classification, see the Appendix.
Domestic content Foreign content Total content Domestic content Foreign content Total content AGR 0.6 0.4 1.0 0.7 0.6 1.3 MIN 0.7 3.2 3.9 0.7 8.2 9.0 FOD 0.1 0.2 0.3 0.1 0.2 0.3 TEX 0.4 0.2 0.6 0.3 0.2 0.5 WOD 0.1 0.1 0.2 0.2 0.2 0.3 PAP 0.2 0.8 1.0 0.1 0.6 0.6 PET 0.5 0.6 1.0 0.3 0.8 1.1 CHM 0.7 2.0 2.7 0.4 1.7 2.1 RBP 0.6 1.5 2.2 0.6 1.1 1.7 NMM 0.2 0.3 0.5 0.3 0.3 0.6 MET 1.1 4.5 5.6 0.9 8.5 9.3 FBM 0.6 1.5 2.1 0.5 1.3 1.8 MEQ 3.6 3.3 6.9 2.2 2.3 4.5 CEQ 0.1 1.2 1.3 0.0 0.8 0.8 ELQ 0.3 1.4 1.7 0.7 1.0 1.7 MTR 25.5 5.7 31.3 25.7 3.5 29.2 TRQ 0.0 0.1 0.1 0.0 0.1 0.1 OTM 0.1 0.2 0.3 0.1 0.3 0.4 EGW 1.6 1.3 2.9 1.2 1.3 2.5 CON 0.0 0.3 0.4 0.0 0.4 0.4 WRT 5.1 10.2 15.3 3.3 10.2 13.5 HTR 0.3 0.4 0.6 0.1 0.4 0.5 TRN 1.2 3.4 4.7 0.7 3.7 4.4 PTL 0.7 0.7 1.3 0.5 0.6 1.1 FIN 2.1 2.8 4.9 2.3 2.7 5.0 REA 0.7 1.0 1.7 0.4 1.0 1.4 RMQ 0.1 0.3 0.4 0.0 0.3 0.3 ITS 0.2 0.5 0.6 0.1 0.5 0.6 BZS 0.4 2.6 3.0 0.5 2.6 3.2 GOV 0.0 0.1 0.1 0.0 0.2 0.2 EDU 0.0 0.1 0.1 0.0 0.1 0.1 HTH 0.0 0.1 0.1 0.0 0.1 0.1 OTS 0.6 0.4 1.0 0.6 0.6 1.2 PVH 0.0 0.0 0.0 0.0 0.0 0.0 Total 48.5 51.5 100 43.5 56.5 100 2000 2011
1
This work is a major revision of “The Automotive Value Chain in Thailand (ERIA-DP-2016-33)”, and it was supported by JSPS KAKENHI Grant Number 17K03749.
2 For instance, in recent years, Yazaki and Toyota Boshoku in Thailand relocated
labor-intensive manufacturing facilities of a wiring harness and an automotive sheet cover to Cambodia and Laos, respectively.
3 In production fragmentation, production blocks are connected by service links, that is, bundles
of activities consisting of transportation, insurance, telecommunication, quality control, and management coordination, to ensure that they interact in a suitable manner (Arndt and Kierzkowski, 2001).
4
According to Lall, Albaladejo, and Zhang (2004), the intensity of fragmentation
differs because of four factors: the technical divisibility of production processes, the
factor intensity of the process, the technological complexity of each process, and the
value to weight ratio of the product. Considering the above factors, Lall (2003)
concludes that fragmentation is strong in motor vehicles (a medium-tech industry),
electronics (a high-tech industry), and clothing, footwear, sporting goods, and toys
(low-tech industries).
5 In international input-output tables, parts and components are not separated from the motor
vehicle sector. Thus, in this study, parts and components are defined as intermediate inputs produced and provided by the motor vehicle sector. Other categories of inputs used by the motor vehicle sector but produced by other sectors (e.g., electronics parts, rubber products, metal products, and plastics products) are not treated as automotive parts. By contrast, transactions of complete vehicles are captured in final demand sectors because they are used mainly for final consumption and capital formation.
6 In the Ghosh model, the accounting identity on the input side is expressed as 𝐱𝐱′ = 𝐢𝐢′𝐙𝐙 + 𝐯𝐯′.
Then, the output coefficients matrix is obtained by 𝐁𝐁 = 𝐱𝐱�−𝟏𝟏𝐙𝐙. Substituting this into the above equation yields 𝐱𝐱′= 𝐱𝐱′𝐁𝐁 + 𝐯𝐯′. Finally, 𝐱𝐱′ is given by 𝐱𝐱′ = 𝐯𝐯′(𝐈𝐈 − 𝐁𝐁)−1 = 𝐯𝐯′𝐆𝐆, where 𝐆𝐆 is
the Ghosh inverse matrix. Differentiating 𝑋𝑋𝑗𝑗𝑠𝑠 (total output for sector j in country s) with respect to 𝑣𝑣𝑖𝑖𝑟𝑟 (value added for sector i in country r) gives ∂𝑋𝑋𝑗𝑗
𝑠𝑠
∂𝑣𝑣𝑖𝑖𝑟𝑟 = 𝑔𝑔𝑖𝑖𝑗𝑗𝑟𝑟𝑠𝑠. Then, the row vector of sector i
in country r of the Ghosh inverse matrix, 𝐠𝐠(𝒊𝒊)(𝒓𝒓), indicates the output of all sectors in all countries induced by one unit of primary inputs for sector i in country r (for the technical details of the Ghosh model, see Chapter 12 in Miller and Blair (2009)).
7
As there are substantial leakages of value added (out of the home country) in the upstream production process, the actual dependency on foreign inputs is estimated only by calculating the percentage share of value added generated abroad (i.e., foreign content). Suppose, for example, the Thai automotive industry procures US$ 8,000 of its parts and components from domestic suppliers and US$ 2,000 from foreign suppliers. However, the domestic suppliers need to import US$ 3,000 of materials from abroad. Then, the actual dependency on foreign inputs is 50 percent as opposed to 20 percent (if neither the foreign suppliers nor the foreign material
producers import from Thailand).
8
Baba (2005) examines the trend of domestic procurement of the motor vehicle industry in the ASEAN4 countries (i.e., Thailand, Malaysia, Indonesia, and the Philippines). He finds that the share of domestic procurement increased only slightly (43.5 percent to 45.6 percent) during 1975–1990 but started to rise rapidly (45.6 percent to 50.8 percent) during 1990–1995. Tables 1 and 2 also show that the number of parts suppliers in Thailand increased sharply during 1986– 1999. These facts suggest that the automotive parts industry in Southeast Asia started to develop significantly in the early 1990s.
9
The LCR policy significantly raised the cost of automotive parts. Simultaneously, Thailand imposed high tariffs as well as non-tariff barriers on completely built vehicles. For example, the introduction of the LCR system was accompanied by an upward adjustment in import tariffs on
completely built units of passenger vehicles, vans, and pick-up trucks to 80 percent, 60 percent, and 40 percent, respectively (Athukorala and Kohpaiboon, 2010). Such welfare costs should be taken into account to evaluate the LCR as a policy intervention.
10 Some successful local firms such as the Thai Summit Group received substantial benefits
from the LCR policy. Starting as small enterprises during the LCR regime, these firms not only had their customers, but also received technical advice and support from foreign assemblers and parts suppliers. Today, with annual sales of US$ 2 billion, the Thai Summit Group has more than 40 subsidiaries and produces a variety of automotive parts including car bodies;
interior/exterior parts; wire harnesses; chasses; machine, forging, and die casting; and tooling.
11 More specifically, engine manufactures had to procure locally: cylinder blocks from 1994;
connecting rods and camshafts from 1996; cylinder heads from 1997; and crank shafts from 1998 onward (Techakanont, 2011).
12
The value of imported parts per locally assembled vehicle continued to decline until 2005. However, it started to rise again after 2005 (see Figure 5 in Warr and Kohpaiboon (2017)), consistent with the trend in Figure 2 in this paper. Warr and Kohpaiboon (2017) focus on imported automotive parts, while this study takes into account all the types of inputs used throughout the production process. Thus, the results of the analysis could be somewhat different.
13 The other factor affecting the localization of automotive parts is exposure to exchange rate
risk, which can be reduced by increasing the share of locally procured parts and components (Kohpaiboon and Yamashita, 2001). In addition, the localization of R&D activities and development of new vehicle models (e.g., Toyota’s IMV project) started in the 2000s. Geographical proximity facilitates face-to-face communication and product development coordination between suppliers and assemblers (Dyer, 1994).
14
The (total) share of foreign service content in Thai automotive exports increased slightly from 24.2 percent to 24.7 percent during 2000–2011.
15
Although mining products cannot be used directly by the motor vehicle industry, it does use inputs from the basic metals sector, which, in turn, uses inputs from the mining sector. Thus, motor vehicle production indirectly induces value added in the mining sector.
16
The total number of transactions recorded in the ICIO table is large; 509,796 (= (34 × 21)2) intermediate transactions plus 714 (= 34 × 21) value added transactions. Thus, the shares (in terms of the number) of transactions that appear in Figures 3a–4b are small, but their shares in transaction values are not. For example, the shares of value added (primary inputs) and final output captured in Figures 3a and 4a are 59.1 percent and 75.6 percent, respectively. Thus, these figures are expected to capture the lion’s share of transaction values in the value chain.
17 As discussed above, the production share of commercial vehicles (in particular, 1-ton pickup
trucks) is high in Thailand; the share of 1-ton pickup trucks in 2014 was 53 percent. This automatically increases the share of motor vehicles used for capital formation.