1
St. Luke’s International University Graduate School of Public Health
Capstone Project
“Lifetime Cancer Risk among Urban People of Myanmar Exposed to
Inorganic Arsenic through Rice Consumption”
Nwe Ni Tun
18-MP-212
St. Luke’s International University
Graduate School of Public Health
Supervisor: Prof. Mahbubur Rahman
Lab analysis advisor: Prof. Yuji Heike
2
Contents
Abstract ... 3 Introduction ... 5 Methods ... 8 Study Design ... 8Rice Sample Collection ... 10
Sample Preparation and Laboratory Analysis ... 11
Exposure and Risk Assessment ... 12
Statistical Analysis ... 13
Ethical Consideration ... 13
Results ... 14
Survey Results ... 14
Exposure and Risk Assessment Outcomes ... 15
Multivariables Regression Analysis ... 16
Discussion ... 17 Conclusions ... 20 Acknowledgments ... 21 Conflict of Interest ... 21 References ... 22 List of Figures ... 27 List of Tables ... 29 Appendices ... 38
3 Abstract
Background: Cancer incidence and mortality have been increasing in Myanmar over a period of time. Inorganic arsenic (iAs) has been classified in Group 1 of substances that are carcinogenic to humans. The arsenic content of rice is a major public health concern. However, the level of cancer risk associated with iAs exposure from rice consumption is unknown to Myanmar people. The objective of this study was to assess iAs concentration in consumer rice to estimate the lifetime cancer risk (LCR) associated with daily rice consumption for people living in Myanmar.
Methods: Our study population comprised a sample of 1,148 adults aged 18 years or older who were recruited using an Internet survey. Participants completed the survey questionnaire that included socio-demographics, body weight, rice consumption, and cooking behaviors, and lifestyle variables. In total, 36 samples of commonly consumed white rice were collected from local markets and rice mills. The iAs contents in both raw and cooked rice of these samples were detected by using high-performance liquid chromatography, inductively coupled plasma mass spectrometry (HPLC-ICP-MS) method.
Results: The mean concentration of iAs in cooked rice samples was 0.043 ± 0.015 mg/kg. Raw rice samples collected from the Ayeyarwady Delta region had higher mean iAs concentration (0.06 mg/kg and 0.07 mg/kg) than that of the other two regions (0.05 mg/kg
4
and 0.06 mg/kg of Central dry zone, 0.04 mg/kg and 0.05 mg/kg of Yangon deltaic). The Paw San Hmwe (short grain) rice samples from the Central Dry Zone region, particularly Shwebo Paw San, had the lowest level of iAs among all the samples (0.04 mg/kg). The Emata rice samples from the Ayeyarwady delta had the highest iAs contamination (0.07 mg/kg). Traditional rice cooking with clean water (water to rice ratio:10: 1) reduced ≥50% of its iAs content. Questionnaire survey data showed that the mean body weight and daily rice consumption were 74.8 kg and 0.77 kg/day for men, and 64.9 kg and 0.65 kg/day for women, respectively. The average LCR was 3.5 x 10⁻⁴, almost four times higher than the U.S. EPA acceptable upper limit (1.0 x 10⁻⁴). Overall, 93.5% of the study population had the LCR higher than the EPA upper limit. In reference to the lower limit of EFSA BMDL01 95% CI, 22% (252 participants) had the risk higher than this lower limit. In addition, participants who consumed more than 500g of cooked rice daily had the LCR 23 times higher than that of people who consumed less than 500g daily. Those who consumed rice grown in the Ayeyarwady Delta region had the LCR 4 times higher than their counterpart who consumed rice grown in the Central dry zone.
Conclusion: Although the iAs content in all white rice samples analyzed in this study was below the WHO-FAO Codex standards maximum contamination level (0.2 mg/kg), Myanmar adults are at increased risk of iAs-associated cancers due to their high daily rice consumption. A multi-pronged approach is needed to decrease the iAs content of cooked
5
rice as well as to adjust the rice consumption in order to reduce iAs associated with cancer risk in Myanmar.
Keywords: inorganic arsenic, rice, carcinogen, lifetime cancer risk, food safety, Myanmar
Introduction
World Health Organization (WHO) food safety fact sheets documented that globally 600 million (almost 1 in 10 people) get ill after eating contaminated food each year, resulting in 420,000 deaths and the loss of 33 million healthy life years (DALYs) (WHO, 2017). Safe and nutritious food is the key to sustaining life and promoting good health. Unsafe food containing harmful bacteria, viruses or chemical substances can cause adverse health effects and diseases which include cancers and chronic diseases. Cancer is one of the four main non-communicable diseases (NCD) which is collectively responsible for half of the global burden of diseases. According to the Global Cancer Observatory 2018 report (Bray et al., 2), cancer is the second leading cause of death globally; about 10 million people die from cancer yearly, and 70% of deaths from cancer occur in low-and-middle-income countries.
Myanmar has been witnessing double burden of diseases (communicable and non-communicable diseases) due to racial and political conflict, community displacement, inadequate access to health care and education, poor infrastructure, inappropriate use of pesticide, ineffective operation in food safety, and insufficient healthcare financing over the
6
past several decades. One review of city and hospital-based cancer registries estimated overall whole-body cancer incidence at 57.7 per 100,000 population for the 2002-2007 period with a higher incidence in women than men (HelpAge, 2016; MOHS, 2016). The Global Cancer Observatory 2018 report also showed that the incidence of cancer in Myanmar was 130.9 per 100,000 people per year from 2013 through 2018 with an upward trend over the period.
A carcinogen is a substance that can cause cancer. The International Agency for Research on Cancer (IARC) classifies arsenic as a Group 1 carcinogen based on some clinical and epidemiological evidence that its inorganic compounds (iAs) cause bladder, lung and non-melanoma skin cancer in humans (IARC, 2004; Chen et al., 1986; Tsuda et al., 1995; Tsugane et al., 2001; Marshall et al., 2007; Mostafa et al., 2008; Sanchez et al., 2016). The major routes of arsenic absorption in the general population are inhalation and ingestion. Food and Agriculture Organization (FAO) experts highlighted that arsenic exposure through drinking water and food has been a public health problem in many countries especially in Southeast Asia because of inappropriate use of inorganic fertilizers and pesticides, climate change, and industrial mining (FDA, 2013; FDA, 2014; Mateo et al., 2017). This issue has been globally and regionally assessed in order to examine the exposure status and to characterize the long-term consequence of health risk (Mantha, 2017; Liao et a;., 2018; Sawada et al., 2013; Melkonian et al., 2013; Davis et al., 2017; Li et al., 2017).
7
groundwater is arsenic contaminated (Winkel et al., 2008; WRUD/UNICEF, 2006). In 2014, a study reported that the arsenic level in groundwater of Myanmar, particularly in lower Ayeyarwady delta area, reached 50 – 630 μg/L (Geen et al., 2014), while the maximum limit defined by WHO is 10 μg/L (WHO, 2013). Another study reported an arsenic concentration of 46.7 μg/L based on the drinking water samples of 183 tube wells in the Ayeyarwady Delta region (Mochizuki et al., 2019). Heavy metals contamination in rice is also one of the food-related hazards and public health concerns in Myanmar (Zaw, 2016). The Joint WHO-FAO Codex Alimentarius Commission in July 2014 established a maximum level of 0.2 mg/kg for total As and iAs in polished rice while 0.25 mg/kg was set for brown rice (WHO-FAO, 2014). A study based on rice samples of the lower Ayeyarwady Delta (Myaung Mya, Labutta and, Pyinsalu townships) detected total arsenic above the WHO-FAO Codex limit (Zin et al., 2019). However, iAs concentration in their rice samples was not reported.
While the arsenic concentration of groundwater, drinking water, and rice in the Ayeyarwady Delta region of Myanmar has been detected at the level above the WHO limits, the arsenic contamination levels of other rice production regions of Myanmar have not been reported yet. Also, the associated risk of developing cancer with the exposure of inorganic arsenic from rice consumption is not known. This research aims to conduct a preliminary study to assess the lifetime cancer risk (LCR) of Myanmar adults from chronic iAs exposure through daily rice consumption.
8
Methods
Study Design
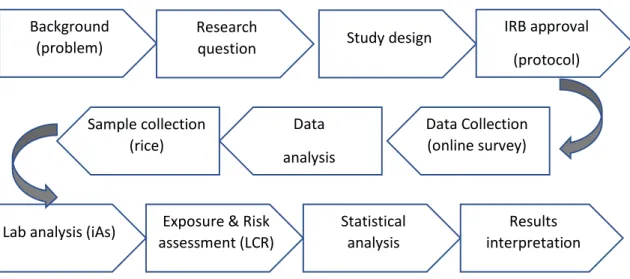
An observational cross-sectional design was used for this study. The process of study protocol used in this study is illustrated in Figure 1. Participants were recruited for this study by conducting an online survey, a questionnaire that the target audience can complete over the Internet via a digital device i.e., a smartphone or a tablet. Online surveys are usually created as Web forms with a database to store survey data. In this study design, Google Forms technology was used to develop the questionnaire, collect data, and monitor the survey progress. Facebook, a popular social networking media, was chosen as the survey platform because about 39.7% of the total Myanmar population were using it in 2019 (NapoleonCat, 2019). The advantages of online surveys compared with the offline survey or over-the-phone interview are negligible-cost, easy and quick data collection with automated and systematically validated form, and flexibility to manage data and conduct analytics.
We published an online survey “Demographics and Rice Intake Survey (Myanmar)” on a Facebook page with public access in July 2019. The survey page was reached out to 32,000+ Myanmar adults who lived in 14 states and divisions using the cheapest Facebook booster application (100 Yen per day). A total of 1282 Facebook users responded to the survey questionnaire with self-informed consent within a 1-month period.
9
The survey form was written in two languages, English and Myanmar. It was designed to collect data related to the socio-demographics, lifestyle, health conditions, and daily rice consumption and cooking behaviors of Myanmar people. The questionnaire includes yes/no, Likert-type, and open-ended questions. Center for Disease Control and Prevention’s National Health and Nutrition Examination Survey (CDC-NHANES) and the National Cancer Institute’s Food Frequency Questionnaire (NCI-FFQ) were used as the guidelines for the survey questions (CDC, 2001; NCI, 2001). Socio-demographic variables were gender, age, race, marital status, residential location (city and prefecture), level of education, occupation, body weight, and height. Body mass index (BMI) was calculated by using the formula BMI = Weight (kg) /Height (m2). Adult overweight and obesity were
categorized using the standard BMI cut-off values. The questions about the usage of the Internet (hours per day), frequency of exercise per week, smoking, tobacco chewing, and alcohol were included to capture lifestyle data. Regarding the health conditions of the survey participants, information on non-communicable chronic diseases and any family history of cancer were recorded if it was diagnosed by a medical doctor. In order to understand rice consumption behaviors of the study population, the variables such as type of rice (white rice or brown rice), name, brand, and origin of the rice, daily frequency of eating rice and rice-based food, serving size per meal, and method of rice cooking, were used in the questionnaire. The PDF snapshot of the survey form in the English version can be seen in the appendices.
10
The inclusion criteria were being of a local Myanmar residence, ≥18 years old, who consumed local rice and provided electronic informed consent. The total number of survey participants was 1,282; however, about 10% were excluded due to the eligibility criteria, and only 1,148 of them were included in the final analysis.
Rice Sample Collection
According to the survey data, 97.2% of the participants consumed white rice while the rest consumed brown rice. In Myanmar, white rice is more popular than brown rice. Therefore, this study was focused on white rice. The two most common white rice categories consumed by the study participants were a short-grain named Paw San Hmwe (abbreviated as PSM) and a long-grain called Emata. Based on the places where these two varieties of rice grown, three regions along with some designated areas were considered for sample collection (Figure 2)
Ayeyarwady Delta has been known as the rice pot of Myanmar since hundred years ago. The groundwater, tube well drinking water, and rice from there have been known for arsenic contamination. The central dry zone is well-known for good quality fragrance rice (e.g., Shwebo Paw San) while the Yangon deltaic is also famous for rice production. All these three regions were used as the sources of rice sample collection for arsenic exposure and risk assessment.
A total of 36 white rice samples were collected from both branded rice available in supermarkets (namely Theingi, Ayeyar, Zeyar, Thant, Precious, and Mya) and non-branded rice from local rice mills, markets, and consumers of the above-designated regions. Equally,
11
six samples of the PSM rice and another six of the Emata rice were collected to assess iAs concentration level of the rice from each of those three regions.
Sample Preparation and Laboratory Analysis
Dust and soil particles were cleaned manually from all samples. Then the samples were packed in clean and dry polyethylene zip-packets at room temperature and shipped to Japan. According to the survey response, 79% of the participants mentioned that they steamed the rice using the conventional way (i.e., rinse the rice with clean water 2-3 times, put water with a rice-to-water ratio of 1:2, and then cooked by electronic rice cooker) almost all the times, while the rest used a traditional way (boiled the rinsed rice with excess water with a rice-to-water ratio of 1:10, discarded the boiled water, and steamed the rice). In this study, 10g of each of the samples were prepared in raw and two steam-cooked methods: the conventional method and the traditional method.
Considering the possibility of a variety of arsenic (As) forms occurring in rice such as arsenite (As III), arsenate (As V), monomethylarsonic acid (MMA), and dimethylarsinic acid (DMA), a method called high-performance liquid chromatography inductively coupled plasma mass spectrometry (HPLC-ICP-MS) was developed in Japan (Ukena et al., 2014). This method was applied to the determination of total inorganic As (iAs) as the sum of As (III) and As (V) contained in the rice samples. Organic As compounds (MMA, DMA, and others) in the extraction solution were separated by the LC and detected by single ion monitoring using the ICP-MS, as for total As.
12
A brief summary of the laboratory process using the HPLC-ICP-MS in this study was as follows. Each rice sample was vacuum dried in a desiccator at room temperature for three days. The solid sample (0.5 g) was blended with 2 mL of 0.15 mol/L nitric acid solution and put into a 100C water bath for 2 hours and then cool to room temperature. After adding 2 mL of ultrapure water and shaking mildly, the mixture was centrifuged for 10 minutes at 2000-2600 x g. The supernatant was poured into 10 mL of volumetric flask. The process of adding 2 mL of ultrapure water, shaking, centrifuging, and collecting of supernatant was repeated twice using the same method as described above. After adding ultrapure water up to 10 mL, the solution was filtered and analyzed with the LC-ICP-MS detection (Agilent 7500ce ICP-MS system) for the quantification of iAs. As (III) and As (V) solutions were used for standard series of iAs determination at concentrations of 0, 1, 2, 5, 10, 20, 50 and 100 ng/mL. The detection limit (DOL) in this analysis was 0.02 ppm (parts per million). The detection of iAs concentration levels in all rice samples was performed in the laboratory of Japan Food Science.
Exposure and Risk Assessment
For the oral dose assessment of iAs in each participant, Lifetime Average Daily Dose (LADD) was calculated according to Equation (1) where C stands for iAs concentration of the rice taken (mg/kg), IR for average daily rice ingestion rate (kg/day), ED for exposure duration (day), BW for body weight (kg), and LT for life expectancy (day). According to the IHME statistics (IHME, 2016), 65 years and 69 years were applied as the life expectancy of
13
Myanmar men and women, respectively. The oral absorption factor is assumed as 100%. The unit of LADD is described in terms of “mg/kg/day”.
𝐿𝐴𝐷𝐷 =C x IR x ED
BW x LT mg/kg /day ( 1 )
The LCR was estimated using Equation (2), where CSF is the cancer slope factor (1.5 per mg/kg/day) for inorganic arsenic by oral ingestion (EPA, 1988). The LCR is a unitless probability to represent the risk of an individual or the average risk of a specific group of population.
𝐿𝐶𝑅 = 𝐿𝐴𝐷𝐷 𝑥 𝐶𝑆𝐹 ( 2 ) Statistical Analysis
All statistical analyses in this study were conducted using STATA version 15.0. Student t-test and one-way ANOVA were used to compare statistical significance between group means of the LCR. A chi-square test was used to analyze relationships between categorical variables. Bivariate and multivariate regression analysis was used to identify socio-demographic and lifestyle predictors of higher LCR.
Ethical Consideration
Human subject data collection procedures via the online survey, the form design of the questionnaire, and the research protocol explained in the study design session were approved by the Institutional Review Boards (IRB) of St Luke’s International Hospital (19 – R045). All survey participants were required to give electronic informed consent upon
14
submission of data. The purpose of the survey and the plan of the study were verbally explained at the beginning of the survey form. The identifiable information of every participant including name, email, and contact data was removed from the questionnaire and all the submitted data were kept as anonymous and confidential. The survey was conducted for one month. During the survey period, all respondents’ data were temporarily stored in a Google drive folder which was only accessible to the principal investigator. At the end of the survey, the data were moved into a password-protected personal computer for statistical analysis.
Results
Survey Results
In total, 1,148 survey participants (495 men and 653 women) were included in the study. Table 1 summarizes the characteristics of the study participants. The majority of the participants were 25-54 years old, single, normal weight, Bamar and university graduates. About 48% of the participants were professionals, 35% lived in Yangon, 18% were current smokers, 40% were alcohol drinkers, 61% exercised at least 1 to 4 times a week, 86% used the Internet more than 7 hours daily, 19% had ≥1 NCD diseases, and 3% had at least one cancer diagnosis. The mean body weight and daily cooked rice consumption were 74.8 kg and 0.77 kg/day for men and 64.8 kg and 0.65 kg/day for women, respectively. Almost 60% of the study population consumed the PSM rice (namely, Shwebo Paw San, Paw San Bae Kyar, Pathein Paw San, Pyapon Paw San, etc.) and 24% Emata rice (namely, Ma Naw Thukha,
15
Ma Gyan Taw, Sinn Thwe, Ayeyar Min, etc.). More than 61% consumed ≥500g cooked rice daily. The majority of the participants (79%) mentioned that they used the conventional method in cooking rice.
Exposure and Risk Assessment Outcomes
Table 2 shows the mean iAs concentration of the 36 white rice samples for two types of rice grains (the PSM and Emata), from each of the three regions. A composite of 6 samples was tested in raw, conventionally-cooked rice, and traditionally-cooked rice. The unit described for the mass of iAs contamination in these samples was mg/kg and it is equivalent to parts per million (ppm). Raw rice samples collected from the Ayeyarwady Delta region had higher mean iAs concentration (0.06 mg/kg and 0.07 mg/kg) than that of the other two regions (0.05 mg/kg and 0.06 mg/kg of Central dry zone, 0.04 mg/kg and 0.05 mg/kg of Yangon deltaic ). The Paw San Hmwe (short grain) rice samples from the Central Dry Zone region, particularly Shwebo Paw San, had the lowest level of iAs among all the samples (0.04 mg/kg). The Emata rice samples from the Ayeyarwady delta had the highest iAs contamination (0.07 mg/kg). More than 50% of the iAs concentration was reduced in all tests using the traditional cooking method while the reduction was higher in PSM samples.
In addition to the 36 white rice samples, we tested additional four Emata rice samples from Myaung Mya Township of the Ayeyarwady Delta to examine whether there were any differences in iAs concentration between the rice cultivated in freshwater and seawater exposed areas. As shown in the table (0.07e), there was no difference observed.
16
In summary, the iAs concentration of all these 36 samples did not exceed the WHO-FAO Codex limit.
The LADD and LCR were calculated for the individual participant by using Equation (1) and (2). Table 3 shows the results of LCR analysis among the study participants by socio-demographics. The average LCR of all the participants was 3.5 x 10⁻⁴, which means that the probability of having any kind of cancer during their lifetime was 0.00035. Alternatively, the average lifetime cancer risk of the study population was almost 4 in 10,000 people while the highest risk was observed as 19 x 10-4. On average, the risk was approximately four
times higher than the U.S EPA's acceptable upper limit (1.0 x 10⁻⁴) (EPA, 1988). Overall,
93.5% of the study participants had LCR higher than that upper limit. According to European Food Safety Authority (EFSA), the Benchmark Dose lower limit (BMDL01) of 95% Confidence
Interval for 1% cancer risk increase is 0.03 μg/kg/day (EFSA, 2009). Among the study population, 22% had a risk higher than the EFSA lower limit.
Multivariables Regression Analysis
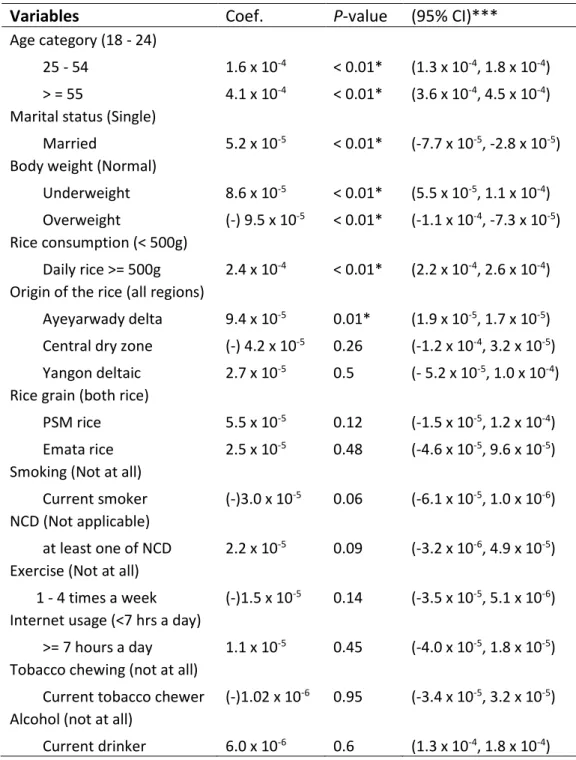
Multiple linear regression analysis (Table 4) showed that participants aged ≥55, married, those who consumed cooked rice >500g/daily, and those who consumed rice from the Ayeyarwady Delta region had a higher likelihood of LCR than their counterparts after adjusting for different sociodemographic and lifestyle characteristics.
In reference to the lower limit of EFSA BMDL01 95% CI (which is CI 0.03 μg/kg/day),
17
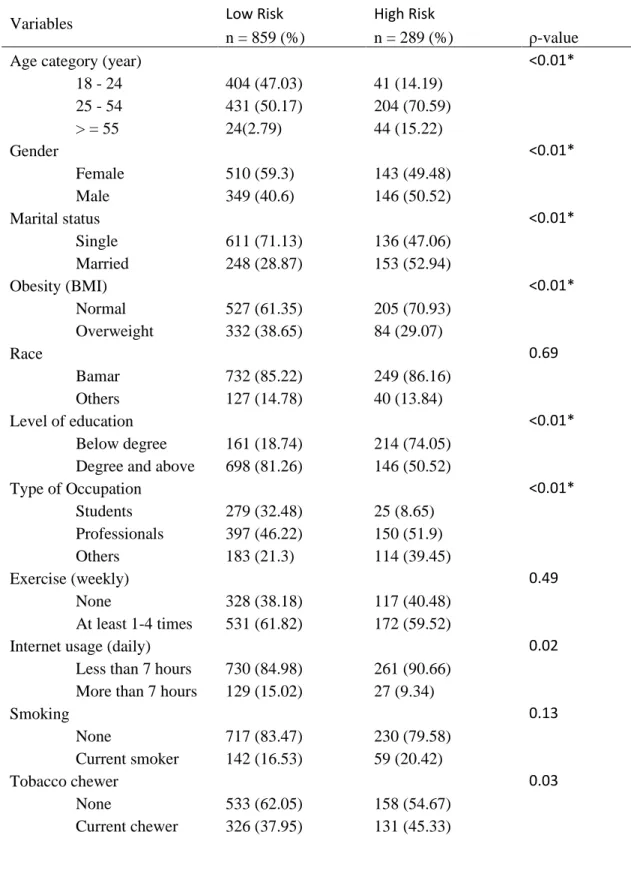
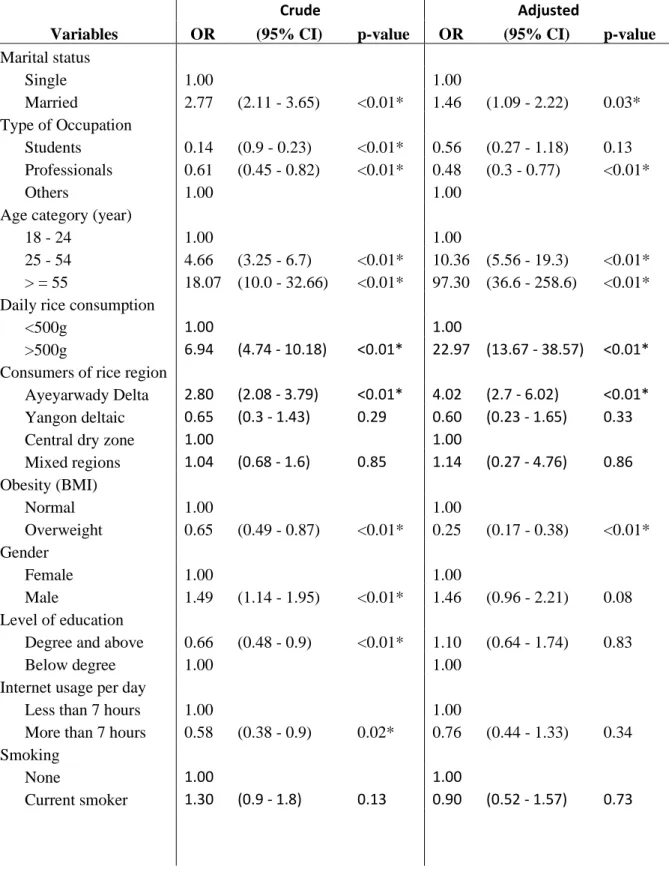
less than or equal to that EFSA lower limit; otherwise, classified as a higher risk group. Using these data, logistic regression analysis was conducted. Findings based on bivariate analysis using the Chi-square test are and multivariable logistic regression (with the corresponding crude and adjusted odds ratio (OR)) are shown in Table 5 & 6, respectively. Analysis based on multivariable logistic regression and multiple linear regression showed almost similar results. After adjusting the confounding variables, married participants had LCR 1.5 times higher than t those who were singles, and adults aged 25 to 54 years had LCR 10 times higher than the risk of younger adults. Participants who consumed >500 g of cooked rice daily had LCR 23 times higher compared to participants who consumed <500 gm daily. Also, those who mainly consumed the rice of Ayeyarwady Delta had LCR 4 times higher than their counterpart who consumed rice from the Central dry zone.
Discussion
Our findings showed that the mean value of iAs contamination in the cooked rice samples was 0.043 ± 0.015 mg/kg. The iAs-attributable average LCR of Myanmar’s adult participants in our study was almost 4 times higher than the U.S EPA acceptable upper limit, in spite of the fact that iAs concentration values of all 36 samples grown in three Myanmar regions were lower than the WHO-FAO Codex standards. This higher risk was partly due to higher rice consumption of cooked rice among the study population. A higher concentration of iAs was detected in the rice samples of the Ayeyarwady Delta. The traditional cooking
18
substantially reduced the iAs amount compared with that of the conventional cooking method.
Regionally, several studies estimated oral exposure of iAs from rice and associated LCR. A study conducted in Northwestern Thailand (Hensawang and Chanpiwat, 2017) reported that mean iAs concentration based on 59 locally grown rice samples was 0.20 ± 0.007 mg/kg and the associated average LCR of the study adults was 4.0 x 10⁻⁴ ± 9.0 x 10⁻⁵.
Another study conducted in Bangladesh using 965 rice samples from 73 sub-districts (Ahmed et al., 2016) reported that the mean iAs concentration was 0.20 mg/kg and the associated LCR levels of males and females (16 – 19 years) were 2.73 x 10⁻³ and 3.22 x 10⁻³,
respectively. Chen and colleagues reported that the mean iAs concentration of 494 rice samples from both North and South provinces of China was 0.092 – 0.099 mg/kg and the associated LCR ranged from 0.76 x 10⁻³ to 1.31 x 10⁻³ (Chen et al., 2016). The iAs
concentration levels reported in all those studies especially from Bangladesh and China were higher than the levels detected in this study, which might be due to regional differences and the sample size issues.
Our study has several strengths. In contrast to the studies mentioned above, we collected population sample data including socio-demographics, body weight, lifestyle, and rice consumption behaviors. The availability of such individual data allowed us to estimate the associated cancer risk more accurately. We also collected the rice samples not only from the Ayeyarwady Delta region (which was already known for arsenic contamination in
19
undergrown water, drinking water, and rice) but also from two other local regions. Therefore, this study could highlight the difference between inorganic arsenic contamination levels of the PSM and Emata rice among these regions. We also examined the change of iAs concentration after rinsing with clean water and using the two common cooking methods. The outcome of this analysis was consistent with the study conducted by Carey and colleagues for the effective removal of iAs from rice through percolating water (Kumarathilaka et al., 2019). However, a study reported that arsenic would not be decreased even using the traditional method if the cooking water is arsenic-contaminated (Sengupta et al., 2006). As we reported in the results section, there was no difference in iAs concentration between the rice cultivated in freshwater and seawater exposed areas within the Ayeyarwady Delta. This additional piece of information might be useful to the researchers and policy makers. This study was the first study that estimated the arsenic-associated LCR of Myanmar adults using data based on iAs concentration in rice samples as well as daily rice consumption behavior.
Some limitations of our study should be noted as well. First, the survey participants underrepresent some population groups such as age under 18, rural residents, minorities, and lower educated class people. Therefore, our study findings might not be generalizable to a larger population. Second, the LCR outcome might be under-estimated because of the lack of data from people living in rural areas and less educated people who consume more cooked rice than their counterparts. Third, our study relies on self-reported rice
20
consumption which is prone to bias. Fourth, our survey did not recruit adolescents because they were not eligible to provide self-informed consent via the Internet survey. The associated LCR of adolescents can be much higher than that of the adults due to iAs exposure during early life years. Actually, Rasheed et al. reported that 2-16 years old adolescents’ LCR was 3 times higher than adults (Rasheed et al., 2017). In 2015, the European Commission has already amended the regulation for the maximum limit of arsenic in infant cereal-based food products as 0.1 mg/kg (EU, 2015). Therefore, further research is needed to estimate the population-level LCR with more representative participants and a variety of rice samples.
Conclusions
The results of our study show that although the iAs contamination in all 36 white rice samples were below the WHO-FAO Codex standards maximum contamination level, Myanmar adults are at increased risk for iAs-associated cancers due to their high daily rice consumption. Also, This study showed iAs concentration differences among raw rice, conventional-cooked rice, and traditional-cooked rice as well as differences among three local rice production regions of Myanmar. This information might be useful not only for consumers but also for the food safety department. Moreover, the analysis results showed that the associated LCR can vary between specific groups of participants because of their age, gender, body weight, daily rice consumption rates, levels of education, choice of rice, and cooking method. According to the global food safety index (GFSI) published by the
21
Economist Intelligence Unit in 2019, Myanmar ranked 77th overall and 78th in the track of
food quality and safety out of 113 countries (EIU, 2019). Therefore, it is highly recommended that not only arsenic concentration in local rice grains and drinking water sources but also other food ingredients need continuous monitoring by strengthening food safety policies, regulations, and standards using multidisciplinary efforts. These measures, if successfully implemented, might contribute to decrease the incidence, disability, and mortality of cancers in Myanmar in the long run.
Acknowledgments
The authors would like to thank St Luke’s International University for funding and laboratory analysis supports to conduct this preliminary study for food safety in Myanmar. Conflict of Interest
22
References
Ahmed, M. K., Shaheen, N., Islam, M. S., Habibullah-Al-Mamun, M., Islam, S., Islam, M. M., Kundu, G. K., Bhattacharjee, L. (2016). A comprehensive assessment of arsenic in commonly consumed foodstuffs to evaluate the potential health risk in Bangladesh. Sci. Total Environ. 544, 125–133.
Bray, F., Colombet, .M, Mery, L., Piñeros, M., Znaor, A., Zanetti, R., Ferlay, J. (2017). Cancer Incidence in Five Continents, Vol. XI (electronic version) Lyon, IARC.
Carey, M., Xiao, J., Farias, J. G., Meharg, A. A. (2015). Rethinking Rice Preparation for Highly Efficient Removal of Inorganic Arsenic Using Percolating Cooking Water, PLoS One. Centers for Disease Control – CDC (2001). National Health and Nutrition Examination Survey
– NHANES Contents 1999 - 2016.
Chen, C. J., Chuang, Y. C., You, S. L., Lin, T. M., Wu, H. Y. (1986). A retrospective study on malignant neoplasms of bladder, lung, and liver in blackfoot disease endemic area in Taiwan. Br J Cancer 53(3):399–405.
Chen, H., Tang, Z., Wang, P., Zhao, F. J. (2018). Geographical variations of cadmium and arsenic concentrations and arsenic speciation in Chinese rice. Environ. Pollut. 238, 482– 490.
Davis, M. A., Signes-Pastor, A. J., Argos, M., Slaughter, M., Pendergrast, C., Punshon, T., Gossai, A., Ahsan, H., Karagas, M. R. (2017). Assessment of human dietary exposure to arsenic through rice. Sci Total Environ.
Economist Intelligence Unit – EIU (2019). Global Food Safety Index. https://foodsecurityindex.eiu.com/
European Food Safety Authority – EFSA (2009). Scientific Opinion on Arsenic in Food. EFSA Journal 2009; 7(10):1351.
EU (2015). Commission Regulation 2015/1006 Amending Regulation (EC) no 1881/2006 as Regards Maximum Levels of Inorganic Arsenic in Foodstuffs.
23
Geen, A. V., Win, K. H., et al. (2014). Confirmation of elevated arsenic levels in groundwater of Myanmar. Science of the Total Environment.
Hensawang, S., and Chanpiwat, P. (2017). Health impact assessment of arsenic and Cadmium intake via rice consuming in Bangkok, Thailand. Environmental Monitoring Assessment, Springer.
HelpAge International Myanmar (2016). University of Public Health and University of Medicine-2. An Assessment of Available Evidence on NCDs and their Risk Factors in Myanmar.
International Agency of Research on Cancer – IARC (2004). Monograph: Arsenic and Arsenic Compounds.
Institute for Health Metrics and Evaluation – IHME (2016). World`s Health Data, Myanmar. http://www.healthdata.org/myanmar.
Kumarathilaka, P., Seneweera, S., Ok, S. Y., Meharg, A. (2019). Arsenic in cooked rice foods: Assessing health risks and mitigation options. Environmental International 127, 584– 591.
Li, H. B., Li, J., Zhao, D., Li, C., et al. (2017). Arsenic Relative Bioavailability in Rice Using a Mouse Arsenic Urinary Excretion Bioassay and Its Application to Assess Human Health Risk.Environ. Sci. Technol. 51, 4689–4696.
Liao, N., Seto, Ed., Eskenazi, B., Wang, M., Li, Y., Hua, J. (2018). A comprehensive review of arsenic exposure and risk from rice and a risk assessment among a cohort of adolescents in Kunming, China. International Journal of Environmental Research and Public Health. Marshall, G., Ferreccio, C., Yuan, Y., Bates, M. N., Steinmaus, C., Selvin, S., Liaw, J., Smith, A.
H. (2007). Fifty-year study of lung and bladder cancer mortality in Chile related to arsenic in drinking water. JNatl Cancer Inst 99(12):920–928.
24
Mantha, M., Yeary, E., Trent, J., Creed, P. A., Kubachka, K., Hanley, T., Shockery, N., Heitkemper, D., Caruso, J., Xue, J., Rice, G., Wymer, L., Creed, J. T. (2017). Estimating inorganic arsenic exposure from U.S. rice and total water intakes.
Mateo, J., Zadeh, S. M., Turral, H. (2017). Water pollution from agriculture: a global review. Food and Agriculture Organization (FAO) of the United Nations.
Melkonian, S., Argos, M., Gamble, M., Chen, Y., Islam, T., et al. (2013). Urinary and dietary analysis of 18,470 Bangladeshis reveals a correlation of rice consumption with arsenic exposure and toxicity.
Mochizuki, H., Phyu, K. P., et at. (2019). Peripheral neuropathy induced by drinking water contaminated with low-dose arsenic in Myanmar. Env. Health and Preventive Medicine. MOHS (2016). Hospital Statistics Report 2014–2016. Health Information Division, Dept. of Public Health, and Dept. of Medical Services. Ministry of Health and Sports (MOHS), Myanmar.
Mostafa, M.G., McDonald. J. C., Cherry, N. M. (2008). Lung cancer and exposure to arsenic in rural Bangladesh. Occup Environ Med 65(11):765–768.
NapoleonCat (2019). Facebook users in Myanmar. https://napoleoncat.com/stats/ facebook-users-in-Myanmar/2019/02
National Cancer Institute – NCI (2001). Usual Dietary Intakes: NHANES Food Frequency Questionnaire (FFQ).
Rasheed, H., Slack, R., Kay, P., Gong, Y. Y. (2017). Refinement of arsenic attributable health risks in rural Pakistan using population specific dietary intake values. Environmental International, 99, 331-342.
Sanchez, T. R., Perzanowski, M., Graziano, J. H. (2016). Inorganic arsenic and respiratory health, from early life exposure to sex-specific effects: a systematic review. Environ. Res. 147, 537–555.
25
Sawada, N., Iwasaki, M., Takachi, R., Sasazuki, S., Yamaji, T., Shimazu, T., Tsugane, S. (2013). Dietary arsenic intake and subsequent risk of cancer: the Japan Public Health Center-based (JPHC) prospective study. Springerlink.
Sengupta, M. K., Hossain, M. A., Mukherjee, A., Ahamed, S., Das, B., Nayak, B., Chakraborti, D. (2006). Arsenic burden of cooked rice: Traditional and modern methods. Food Chem. Toxicol. 44, 1823–1829.
Tsuda, T., Babazono, A., Yamamoto, E., Kurumatani, N., Mino, Y., Ogawa, T., Kishi, Y., Aoyama, H. (1995). Ingested arsenic and internal cancer: a historical cohort study followed for 33 years. Am J Epidemiol 141(3):198–209.
Tsugane, S., and Sobue, T. (2001). Baseline survey of JPHC study– design and participation rate. Japan Public Health Center-based Prospective Study on Cancer and Cardiovascular Diseases. J Epidemiol 11(6 Suppl): S24–S29.
Tun, N. N. (2019). Demographics and Rice Intake Survey (Myanmar), English version: http://bit.ly/2X9LkF4, Myanmar version: http://bit.ly/2Z0tktn.
Ukena, T., Matsumoto, E., Nishimura, T., Harn, J. C., Lee, C. A., Rojanapantip, L., Mayteeyonpiriya, N., Suthilucksanavanish, K., Yamada, Y. (2014). Speciation and determination of inorganic arsenic in rice using liquid chromatography-inductively coupled plasma/ mass spectrometry: collaborative study. Journal of AOAC International. Vol 97(3):946-55.
United States Environmental Protection Agency – EPA (1988). Arsenic, Inorganic; CASRN 7440-38-2.
U.S Food and Drug Administration – FDA (2013). Analytical Results from Inorganic Arsenic in Rice and Rice Products Sampling.
U.S. Food and Drug Administration – FDA (2014). Arsenic in Rice and Rice Products Risk Assessment Report.
Winkel, L., Berg, M., Amini, M., Hug, S. J., Johnson, C. A. (2008). Predicting groundwater arsenic contamination in Southeast Asia from surface parameters. Nature Geoscience.
26
World Health Organization – WHO (2017). Food Safety Fact Sheets. https://www.who.int/ en/news-room/fact-sheets/detail/food-safety
WRUD/UNICEF (2006). Water Resources Utilization Department and UNICEF report. An analysis of arsenic contamination in drinking water sources at Ayeyarwady Division. WHO (2013). Guidelines for Drinking-water Quality: Arsenic in drinking-water.
WHO-FAO Codex Alimentarius Commission-Geneva of the United Nations (2014). International Food Standards.
Zaw, T. (2016). Food Safety in Myanmar, Symposium “Ensuring Food Safety: An Important Challenge Today”, The 30th CMAAO General Assembly.
Zin, P. W., Aung, M. N., Phyu, K. P., Malar, M., Han, T. T., Tun, H. L. (2019). Determination of heavy metals in rice varieties from MyaungMya, Labutta and PyinSalu townships, Ayeyarwady region. Department of Medical Research and the Department of Agricultural Research. 47th Myanmar Health Research Congress.
27
List of Figures
Figure 1. Flow diagram of the study protocol Research
question Background
(problem) Study design
Data Collection (online survey) (Internet survey) Data analysis Sample collection (rice)
Lab analysis (iAs) Exposure & Risk assessment (LCR) Statistical analysis IRB approval (protocol) Results interpretation
28
Figure 2. Location of three rice sample collection regions in Myanmar Central Dry Zone
(Shwebo, Sagaing, Mandalay, Nay PyiTaw)
Yangon deltaic (Yangon, Bago) Ayeyarwady Delta
29
List of Tables
Table 1. Characteristics of the study participants
Variables n ( % ) or mean ( ± sd )
Age category (year)
18 - 24 445 (38.76 %) 25 - 54 635 (55.31 %) > = 55 68 (5.92 %) Gender Female 653 (56.88 %) Male 495 (43.12 %) Marital status Single 752 (65.51 %) Married 396 (34.49 %)
Body weight (BMI)
Underweight (BMI < 18.5) 145 (12.63 %) Normal (18.5 < BMI < 25.0) 587 (51.13 %) Overweight (BMI >= 25.0) 416 (36.24 %) Race Bamar 981 (85.45 %) Level of education
Degree and above 1056 (91.99 %)
No education 12 (1.05 %)
Type of Occupation
Students 304 (26.48 %)
Professionals 547 (47.65 %)
Residential location (Division)
Yangon 406 (35.37 %)
Mandalay 275 (23.95 %)
Nay Pyi Taw 94 (9.19 %)
Lifestyle & healh condition
Exercise (at least 1 - 4 times a week) 703 (61.24 %) Internet usage (more than 7 hours/day) 992 (86.41 %)
Current smoker 201 (17.51 %)
Current tobacco chewer 152 (13.24 %)
Current alcohol drinker 457 (39.81 %)
at least one chronic disease (NCD) 215 (18.73 %) Rice consumption behaviors
30
Average frequency (meals/day) 2.54 (0.61) Average serving size (g/meal) 271.2 (112.8) Average daily cooked rice intake (kg/day) 0.70 (0.35) Eat daily cooked rice 500g and above 701 (61.06 %) Drinking habit of boiled rice water 499 (43.47 %) Paw San Hmwe rice consumer 683 (59.55 %)
Emata rice consumer 275 (23.95 %)
People who eat both 190 (16.55 %)
Rice cooking method
Conventional way (using electronic rice cooker) 910 (79.27 %) Traditional way (discarding boiled rice water) 147 (12.80 %) Consumer proportion of rice from (Region)
All regions 166 (14.46 %)
Ayeyarwady delta 340 (29.62 %)
Central dry zone 583 (50.78 %)
31
Table 2. Inorganic arsenic (iAs) concentration based on the laboratory analysis
White rice sample groups Mean iAs concentration (mg/kg) of 36 white rice samples by 3 different conditions
Raw rice
Conventionally-cooked rice
Traditionally -cooked rice Paw San Hmwe (short grain)
Ayeyarwady delta (6 samples) 0.06 0.06 0.02
Yangon deltaic (6 samples) 0.05 0.04 **
Central dry zone (6 samples) 0.04 0.02 < 0.02* Emata (long grain)
Ayeyarwady delta (6 samples) 0.07, 0.07e 0.05 0.02
Yangon deltaic (6 samples) 0.06 0.05 0.02
Central dry zone (6 samples) 0.05 0.04 **
* Limit of detection (LOD) in our lab analysis is 0.02 mg/kg (i.e., 0.02 ppm) ** The lab test results are not available
32
Table3. Estimated LCR values of the study participants
Variables
LCR
(mean ± sd) P-value* Overall average ( n = 1148) 3.5 x 10⁻⁴ (2.4 x 10⁻⁴)
Age category (year) < 0.05
18 – 24 2.6 x 10⁻⁴ (1.4 x 10⁻⁴) 25 – 54 3.8 x 10⁻⁴ (2.5 x 10⁻⁴) > = 55 6.3 x 10⁻⁴ (3.5 x 10⁻⁴) Gender 0.03 Female 3.4 x 10⁻⁴ (2.3 x 10⁻⁴) Male 3.7 x 10⁻⁴ (2.4 x 10⁻⁴) Marital status < 0.01 Single 4.3 x 10⁻⁴ (2.9 x 10⁻⁴) Married 3.1 x 10⁻⁴ (1.9 x 10⁻⁴)
Body weight (BMI) < 0.01
Normal 3.7 x 10⁻⁴ (2.3 x 10⁻⁴) Underweight 4.0 x 10⁻⁴ (3.3 x 10⁻⁴) Overweight 3.1 x 10⁻⁴ (2.4 x 10⁻⁴) Race 0.37 Bamar 3.5 x 10⁻⁴ (7.7 x 10⁻⁶) Others 3.4 x 10⁻⁴ (1.7 x 10⁻⁵) Level of education < 0.01
Degree and above 3.4 x 10⁻⁴ (2.3 x 10⁻⁴)
Below degree 4.7 x 10⁻⁴ (3.1 x 10⁻⁴) No education 4.5 x 10⁻⁴ (2.1 x 10⁻⁴) Type of occupation < 0.01 Students 2.3 x 10⁻⁴ (1.4 x 10⁻⁴) Professionals 3.6 x 10⁻⁴ (2.4 x 10⁻⁴) Others 3.6 x 10⁻⁴ (2.8 x 10⁻⁴)
Lifestyle & health condition
Exercise (1 - 4 times a week) 3.6 x 10⁻⁴ (2.3 x 10⁻⁴) 0.14
Internet usage (> 7 hours a day) 3.6 x 10⁻⁴ (2.4 x 10⁻⁴) < 0.01
Current smoker 3.6 x 10⁻⁴ (2.7 x 10⁻⁴) 0.72
33
Current alcohol drinker 3.7 x 10⁻⁴ (2.6 x 10⁻⁴) 0.09
≥ 1 chronic disease (NCD) 4.0 x 10⁻⁴ (3.0 x 10⁻⁴) < 0.01
Rice consumption behaviors
Consumed ≥500g daily 4.3 x 10⁻⁴ (2.5 x 10⁻⁴) < 0.01
People who eat Paw San Hmwe 3.5 x 10⁻⁴ (2.5 x 10⁻⁴) 0.05
People who eat Emata 3.7 x 10⁻⁴ (2.3 x 10⁻⁴) 0.05
People who eat both 3.2 x 10⁻⁴ (2.0 x 10⁻⁴) 0.05
Origin of the rice sample (Region) < 0.01
All regions 3.2 x 10⁻⁴ (2.0 x 10⁻⁴)
Ayeyarwady delta 4.5 x 10⁻⁴ (2.7 x 10⁻⁴)
Central dry zone 3.0 x 10⁻⁴ (2.1 x 10⁻⁴)
Yangon deltaic 3.4 x 10⁻⁴ (2.9 x 10⁻⁴) *Based on Student t test or ANOVA
34
Table 4. Analysis of LCR multiple linear regression analysis**
Variables Coef. P-value (95% CI)***
Age category (18 - 24)
25 - 54 1.6 x 10⁻⁴ < 0.01* (1.3 x 10-4, 1.8 x 10⁻⁴)
> = 55 4.1 x 10⁻⁴ < 0.01* (3.6 x 10-4, 4.5 x 10⁻⁴)
Marital status (Single)
Married 5.2 x 10⁻⁵ < 0.01* (-7.7 x 10⁻⁵, -2.8 x 10⁻⁵)
Body weight (Normal)
Underweight 8.6 x 10⁻⁵ < 0.01* (5.5 x 10-5, 1.1 x 10⁻⁴)
Overweight (-) 9.5 x 10⁻⁵ < 0.01* (-1.1 x 10⁻⁴, -7.3 x 10⁻⁵)
Rice consumption (< 500g)
Daily rice >= 500g 2.4 x 10⁻⁴ < 0.01* (2.2 x 10-4, 2.6 x 10⁻⁴)
Origin of the rice (all regions)
Ayeyarwady delta 9.4 x 10⁻⁵ 0.01* (1.9 x 10-5, 1.7 x 10⁻⁵)
Central dry zone (-) 4.2 x 10⁻⁵ 0.26 (-1.2 x 10⁻⁴, 3.2 x 10⁻⁵)
Yangon deltaic 2.7 x 10⁻⁵ 0.5 (- 5.2 x 10⁻⁵, 1.0 x 10⁻⁴)
Rice grain (both rice)
PSM rice 5.5 x 10⁻⁵ 0.12 (-1.5 x 10⁻⁵, 1.2 x 10⁻⁴)
Emata rice 2.5 x 10⁻⁵ 0.48 (-4.6 x 10⁻⁵, 9.6 x 10⁻⁵)
Smoking (Not at all)
Current smoker (-)3.0 x 10⁻⁵ 0.06 (-6.1 x 10⁻⁵, 1.0 x 10⁻⁶)
NCD (Not applicable)
at least one of NCD 2.2 x 10⁻⁵ 0.09 (-3.2 x 10⁻⁶, 4.9 x 10⁻⁵)
Exercise (Not at all)
1 - 4 times a week (-)1.5 x 10⁻⁵ 0.14 (-3.5 x 10⁻⁵, 5.1 x 10⁻⁶)
Internet usage (<7 hrs a day)
>= 7 hours a day 1.1 x 10⁻⁵ 0.45 (-4.0 x 10⁻⁵, 1.8 x 10⁻⁵)
Tobacco chewing (not at all)
Current tobacco chewer (-)1.02 x 10⁻⁶ 0.95 (-3.4 x 10⁻⁵, 3.2 x 10⁻⁵)
Alcohol (not at all)
Current drinker 6.0 x 10⁻⁶ 0.6 (1.3 x 10⁻⁴, 1.8 x 10⁻⁴) * Statistically significant at the level of P-value < 0.05
** R-squared value of the regression model is 0.6 *** 95% Confidence Interval
35
Table 5. Bivariate analysis based on LCR (higher Vs. lower)
Variables Low Risk High Risk
n = 859 (%) n = 289 (%) ρ-value
Age category (year) <0.01*
18 - 24 404 (47.03) 41 (14.19) 25 - 54 431 (50.17) 204 (70.59) > = 55 24(2.79) 44 (15.22) Gender <0.01* Female 510 (59.3) 143 (49.48) Male 349 (40.6) 146 (50.52) Marital status <0.01* Single 611 (71.13) 136 (47.06) Married 248 (28.87) 153 (52.94) Obesity (BMI) <0.01* Normal 527 (61.35) 205 (70.93) Overweight 332 (38.65) 84 (29.07) Race 0.69 Bamar 732 (85.22) 249 (86.16) Others 127 (14.78) 40 (13.84) Level of education <0.01* Below degree 161 (18.74) 214 (74.05) Degree and above 698 (81.26) 146 (50.52)
Type of Occupation <0.01* Students 279 (32.48) 25 (8.65) Professionals 397 (46.22) 150 (51.9) Others 183 (21.3) 114 (39.45) Exercise (weekly) 0.49 None 328 (38.18) 117 (40.48) At least 1-4 times 531 (61.82) 172 (59.52)
Internet usage (daily) 0.02
Less than 7 hours 730 (84.98) 261 (90.66) More than 7 hours 129 (15.02) 27 (9.34)
Smoking 0.13 None 717 (83.47) 230 (79.58) Current smoker 142 (16.53) 59 (20.42) Tobacco chewer 0.03 None 533 (62.05) 158 (54.67) Current chewer 326 (37.95) 131 (45.33)
36 Alcohol drinker 0.03 None 533 (62.05) 158 (54.67) Current drinker 326 (37.95) 131 (45.33) Chronic disease (NCD) 0.03 None 711 982.77) 222 (76.82) At least one 148 (17.23) 67 (23.18)
Daily rice consumption <0.01*
Eat <500g 413 (48.08) 34 (11.76) Eat >500g 446 (51.92) 255 (88.24)
Consumers of rice grain <0.01*
PSM rice 520 (60.54) 163 (56.4) Emata rice 186 (21.65) 89 (30.8)
Both 153 (17.81) 37 (12.8)
Consumers of rice region <0.01*
Ayeyarwady Delta 204 (28.75) 136 (47.06) Yangon deltaic 51 (5.94) 8 (2.77) Central dry zone 471 (44.83) 112 (38.75)
Mixed region 133 (15.48) 33 (11.42)
37
Table 6. Analysis of LCR based on multivariable logistic regression analysis
Variables
Crude Adjusted
OR (95% CI) p-value OR (95% CI) p-value
Marital status Single 1.00 1.00 Married 2.77 (2.11 - 3.65) <0.01* 1.46 (1.09 - 2.22) 0.03* Type of Occupation Students 0.14 (0.9 - 0.23) <0.01* 0.56 (0.27 - 1.18) 0.13 Professionals 0.61 (0.45 - 0.82) <0.01* 0.48 (0.3 - 0.77) <0.01* Others 1.00 1.00
Age category (year)
18 - 24 1.00 1.00
25 - 54 4.66 (3.25 - 6.7) <0.01* 10.36 (5.56 - 19.3) <0.01* > = 55 18.07 (10.0 - 32.66) <0.01* 97.30 (36.6 - 258.6) <0.01* Daily rice consumption
<500g 1.00 1.00
>500g 6.94 (4.74 - 10.18) <0.01* 22.97 (13.67 - 38.57) <0.01* Consumers of rice region
Ayeyarwady Delta 2.80 (2.08 - 3.79) <0.01* 4.02 (2.7 - 6.02) <0.01* Yangon deltaic 0.65 (0.3 - 1.43) 0.29 0.60 (0.23 - 1.65) 0.33
Central dry zone 1.00 1.00
Mixed regions 1.04 (0.68 - 1.6) 0.85 1.14 (0.27 - 4.76) 0.86 Obesity (BMI) Normal 1.00 1.00 Overweight 0.65 (0.49 - 0.87) <0.01* 0.25 (0.17 - 0.38) <0.01* Gender Female 1.00 1.00 Male 1.49 (1.14 - 1.95) <0.01* 1.46 (0.96 - 2.21) 0.08 Level of education
Degree and above 0.66 (0.48 - 0.9) <0.01* 1.10 (0.64 - 1.74) 0.83
Below degree 1.00 1.00
Internet usage per day
Less than 7 hours 1.00 1.00
More than 7 hours 0.58 (0.38 - 0.9) 0.02* 0.76 (0.44 - 1.33) 0.34 Smoking
None 1.00 1.00
38 Tobacco chewer None 1.00 1.00 Current chewer 1.36 (1.04 - 1.77) 0.03* 0.49 (0.27 - 0.89) 0.07 Alcohol drinker None 1.00 1.00 Current drinker 1.36 (0.92 - 1.96) 0.12 1.10 (0.73 - 1.64) 0.65 Chronic disease (NCD) None 1.00 1.00 At least one 1.45 (1.05 - 2.0) 0.03* 1.07 (0.68 - 1.68) 0.76 Consumers of rice grain
PSM rice 1.30 (0.87 - 1.93) 0.2 1.37 (0.35 - 5.35) 0.65 Emata rice 1.98 (1.28 - 3.07) <0.01* 1.40 (0.35 - 5.58) 0.63
Both 1.00 1.00
* Statistically significant at the level of P-value < 0.05
Appendices
Demographics