第 55 卷 第 4 期
2020
年 8
月
JOURNAL OF SOUTHWEST JIAOTONG UNIVERSITY
Vol. 55 No. 4
Aug. 2020
ISSN: 0258-2724 DOI:10.35741/issn.0258-2724.55.4.15
Research articleSocial Sciences
T
HE
S
UBJECTIVE AND
O
BJECTIVE
A
SSESSMENT OF
C
OLOR
S
ELECTION AND
L
IGHT
I
NTAKE WITH
R
EGARD TO
E
MPLOYEE
P
ERFORMANCE
考慮員工表現的主觀和客觀的顏色選擇和光線吸收評估
Iftitah Ruwana1, Pratikto2, Sugiono3, Oyong Novareza3
1.Department of Industrial Engineering National Institute of Technology (ITN Malang), Indonesia,
ita_ruwana@yahoo.com
2.Department of Mechanical Engineering Brawijaya University, Indonesia 3.Departement of Industrial Engineering Brawijaya University, Indonesia
Received: April 24, 2020 ▪ Review: June 4, 2020 ▪ Accepted: July 7, 2020
This article is an open access article distributed under the terms and conditions of the Creative Commons Attribution License (http://creativecommons.org/licenses/by/4.0)
Abstract
Employees’ physical and mental health is significantly influenced by the light intensity and color environment of their workstations. The goal of this research was to determine the influence of workspace color variations and lighting intensity on employees’ physical and mental comfort. Objective assessment by measuring physical condition including heart rate and blood pressure using the design of experiment methods (DOE). The subjective rating using the National Aeronautics and Space Administration Task Load Index (NASA-TLX) method is to perform a working mental burden measurement consisting of six-dimensional indicators including Mental Demand, Physical Demand, Temporal Demand (TD), Own
Performance, Frustration Level, Effort. Measurements were recorded before and after the color and
intensity of the light in a three-meter long, three-meter wide, and three-meter high chamber by adjusting the color of the walls to red, blue, or white and noting changes in the physical environment and the respondent's mental stress level. Objective measurement tests for DOE included measuring degrees of physical comfort using blue and lighting from 300 lux to 350 lux. The highest ranking was systole of
100.9 mmHg, down 5.48%; diastole, down 2.71%; and heart rate, down 2%. The same thing occurred in
measuring the level of mental comfort with NASA TLX: the blue color and light intensity of 300 lux to 350 lux produced the lowest stress value of 55.67, down 18.40%. Results showed the effect of the blue color and the lighting can lower the blood pressure, heart rate, and mental burdens of employees, thus improving employees’ comfort.
Ruwana, I. et al. / Journal of Southwest Jiaotong University/ Vol. 55 No.4 2 摘要 員工的身心健康受到其工作場所的光線強度和色彩環境的極大影響。這項研究的目的是確定 工作空間的顏色變化和照明強度對員工身心健康的影響。通過設計實驗方法(DOE)通過測量包 括心率和血壓在內的身體狀況進行客觀評估。使用美國國家航空航天局任務負荷指數(NASA-TLX)方法進行的主觀評分是對工作精神負荷的測量,該測量包括六個維度的指標,包括心理需 求,身體需求,時間需求(TD),自身績效,挫敗感水平,努力。在三米長,三米寬,三米高的 室內,通過將牆壁的顏色調整為紅色,藍色或白色,並記錄光的變化,記錄測量前後的顏色和強 度。物理環境和受訪者的精神壓力水平。 DOE 的客觀測量測試包括使用藍色和 300 lux 至 350 lux 的照明測量身體舒適度。最高的收縮期為 100.9 mmHg,下降了 5.48%。舒張期,下降 2.71%; 和心率下降 2%。用 NASA TLX 測量心理舒適度時也發生了同樣的事情:藍色和 300 lux 至 350 lux 的光強度產生的最低應力值為 55.67,下降了 18.40%。結果表明,藍色和燈光效果可以降低員 工的血壓,心率和精神負擔,從而提高員工的舒適度 关键词: 顏色多樣性,光強度,心理和身體舒適度,NASA-TLX,DOE
I. I
NTRODUCTIONFactors that can affect employee comfort when performing tasks are both external and internal. Physical comfort is a type of comfort that can be felt directly by the sensations of everyone's body. Emotional comfort gives a sense of security, calm, enjoy that is subjective measurable. Comfort as a person and the holistic state of basic humans must be met because creating comfort in a person may trigger feelings
of well-being [1]. Comfort and being
comfortable result from a detailed
environmental assessment of person [2]. Human beings assess environmental conditions based on stimuli that enter through both the nerves and the six senses and are digested by the brain to be evaluated. This scenario includes not only physical, biological issues but also emotions [3]. Sound, light, color, temperature, and other stimuli are recorded automatically and processed by the brain. The brain must then subjectively measure whether the situation is relaxing [4]. Comfort is a continuum of feelings from the most comfortable to the most uncomfortable that are measured based on each individual's understanding of what he or she considers comfortable. Such an understanding varies from person to person. [5]. Aspects of comfort according to [6] consist of: (a) physical comfort with regard to the bodily sensations experienced by the person; (b) psycho-spiritual comfort with regard to internal self-awareness, which includes self-conception, self-esteem, or the meaning of life; (c) environmental comfort, meaning sensory effects such as climate, color, climate, lighting, and sound [7]. Factors affecting a person's comfort at work include room color and lighting [6]. Color is the visible part of the spectrum found in light. The wavelength of light determines the identity of color [8]. Visible
wavelengths of color range from 380 to 750 nanometres (red, orange, yellow, green, blue, violet) [9]. Blue has a wavelength from 450 to 495 nm, and red has a wavelength from 620 to 750 nanometres. It is thought that red and blue colors induce greater brain reactions from other colors. Red may increase the focus of the brain on details, while blue can induce creativity, depending on each individual's behavior [10]. Both colors vibrate differently and can have a positive or negative effect on the human body; these can be used to alter one's emotions. Based on research, when someone enters a blue room, their blood pressure drops slightly, and their heart and breathing rate decrease. In contrast, in a room dominated by red color, blood pressure rises, and heart and breathing rates increase [11]
One factor that needs to be considered before planning a workspace design is the room color [12]. Color not only affects one's feelings and mood, but also triggers unconscious reactions in the brain [2], [8], [13]. Red and blue can cause different brain reactions; red can increase the brain's focus on details, while blue can trigger the power of creativity [11]. Effective lighting allows people to see things clearly, easily and without unnecessary effort [14]. Adequate, well-organized lighting can help to create a relaxed and friendly atmosphere to maintain energy at work [15]. It is known that almost all tasks at work involve the function of the eye. These tasks often require a certain level of lighting to ensure that the object being worked on can be clearly observed. The quality of lighting can improve this efficiency according to the type of work. Sanders and McCormick concluded from a study on 15 corporations that all businesses surveyed reported a 4-35% increase in work. This suggested that a lack of lighting intensity could cause eye disorders and eyestrain [16].
Conversely, higher illumination intensity also caused glare, reflections, excessive shadows, visibility and eyestrain [14].
Measurements by the DOE method can know the objective assessments which include the physical measurements of Systole, diastole, and heart rate. The subjective measurement using the NASA-TLX method can determine if the workable work has a low working mental burden (under load), optimal (optimal load), or
excessive (overload). The NASA TLX
dimensional indicators used include Mental Demand (MD), Physical Demands (PD), Temporal Demand (TD), Own Performance (OP), Frustration Level (FR), Effort (EF). [14]. Based on previous research, it is necessary to develop research that combines comfort with objective and subjective assessments. What distinguishes the aim of this research from that of prior research is the determination of the influence of workspace colour variations and lighting intensity on the level of physical comfort and the mental burden of employees using the DOE and NASA TLX methods.
II. M
ETHODS/M
ATERIALSColour is a specific spectrum contained in light which has wavelengths of 380 nm to 750 nm. Colour gives different vibrations and has good and bad effects on the human body. It can also be used to change one's feelings[10]. The impact of color is a distinct and influential stimulation that affects human life physically,
psychologically, physiologically, and
sociologically [18]. Based on research, when someone enters a room painted blue, his blood pressure drops slightly, and his heart rate and
respiratory rate interact weakly. If the
respondents are in the dominant red room, the blood pressure and heart rate increase. Thus, colour not only has an effect on a person's feelings and mood, but it can also make the brain react [19]. Excessive light intensity can cause scratches, reflections, excessive shadows, and impaired visibility [20].
This analysis used the experiment design of a chamber measuring 3 m x 3 m x 3 m in a
laboratory. The temperatures ranged from 25oC
to 27oC. Color perception was created by a
combination of red, blue, and white. The red color is part of the hot color and has a wavelength between 620 nm and 750 nm. Part of the cool color is the color blue that a wavelength of 450 to 495 nanometre while white color is a neutral color. The light used for direct lighting uses light bulbs nanometre. The
space luminous intensity value is 160 lux to 350 lux.
In the room chamber the colour design content uses a sheet that is mounted on the entire wall of the workspace. Lighting that is used direct lighting uses light bulbs. The value of the light intensity in the room is 160 lux to 350 lux. The colour configuration material in the room chamber uses a layer that is mounted on the entire workspace wall.
Figure 1 shows the condition of the colour configuration design in the room chamber, which is used as the implementation of activities.
Figure 1. Workplace Design and Configuration
The design of the room in the room chamber can be seen in Figure 1 showing the first room was designed by changing the entire color of the wall to red and using direct lighting by measuring the light intensity in the room with a red effect of 160 lux to 190 lux. Design a room design with a white color effect of light sensitivity of 190 lux to 240 lux. Design a room with the blue color effect of the light sensitivity of 300 lux to 350 lux. The well-arranged light intensity can help create a comfortable and pleasant work environment by maintaining the physical and mental conditions that arise at work.
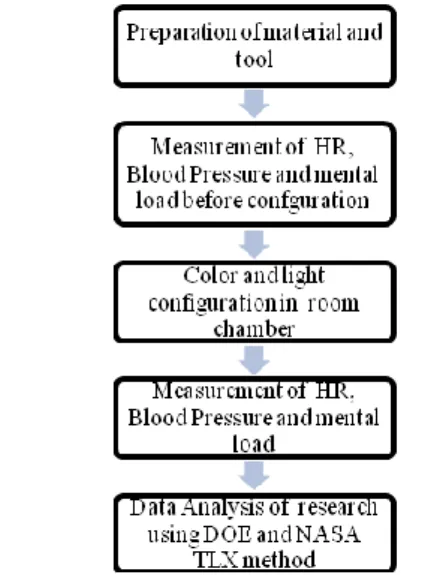
The stages of the study are the: preparation of materials and tools, implementation and measurement, data analysis to determine the effect of color, and lighting on physical comfort and mental workload of employees, as shown in Figure 2.
Figure 2. Flow Diagram of colour and light effect measurement on the employee’s condition
Figure 2 shows the research flow diagram which includes the steps in conducting the
Ruwana, I. et al. / Journal of Southwest Jiaotong University/ Vol. 55 No.4 4
experiment: (1) Preparing the research materials and instruments; (2) Measuring the heart rate (HR), blood pressure (BP), and mental workload of each employee before the configuration was performed so as to understand each person’s level of physical comfort (3) Designing the
room for configuration; (4) Objective
measurements includes physical; heart rate, systole, diastole, and subjective measurements including weighting measurements of the mental workload indicator, and the ranking perceived by a person during the performance of their work. Measurements were performed before the color and lighting configurations were made and after configuration, and (5) Analyzing valuation data using DEO and NASA TLX methods (HR and BP measurements).
In step 3, configure the color and lighting. The Wall of the room is designed using three colors that are red color has a wavelength value 620 Nm to 750 Nm with light intensity 160 lux to 190 lux. The blue color has a long value of 450 Nm to 495 Nm with light intensity 300 lux to 350 lux. White color has a light value of 190 lux to 240 lux.
With Step 5, measurements of employees’ mental workloads involved the use of a two-part questionnaire in which participants were asked about weighting and rating. The weighting portion queried participants about the levels of dominance they assigned to six mental pressure indicators which are thought to influence mental workload and functioning. The subjectively-assigned rating was based on a scale of 0 (low) to 100 (high) to assess the observer’s mental load when performing research.
III. R
ESULTS ANDD
ISCUSSIONBased on the results of the experiment by conducting an objective assessment using DOE methods and subjective assessments with the
NASA-TLX method, obtaining objective
assessment results includes measurements of heart rate, systole, and diastole. Subjective assessments get the results of the employee's mental burden assessment.
A. Heart Rate Measurements
Figure 3 shows the heart rate measurements before and after the setting of the red, blue, and white color configurations. The red color configuration increased the heart rate of most respondents, while blue and white typically decreased them.
Figure 3. Heart Rate Measurement Graph Rate B. Diastolic Blood Pressure
Measurements
Figure 4 shows a graph of diastolic BP before and after the red, blue, and white color configurations in the workspace with lighting. For most respondents, red corresponded to an increase in diastolic BP while blue and white brought a decrease.
Figure 4. Blood Pressure Diastole Measurement Graph C. Systolic Blood Pressure Measurements
Figure 5 shows the systolic BP chart before and after the red, blue, and white color configurations in the workspace with lighting. As with diastolic measurements, presentation of the red configuration resulted in an increase for most participants, whereas presentation of the blue and white resulted in a decrease.
Figure 5. Blood Pressure Systole Measurement Graph D. Average Heart Rate and Blood
Pressure Measurements
Figure 6. Average Heart Rate and Blood Pressure Measurement Graph
Figure 6 shows changes in HR
measurements: before exposure to the blue color configuration, the average HR was 86.5 bpm; after exposure it decreased by 2.00% to 84.8 bpm. Diastolic measurements decreased by 4.57% from 72.9 mmHg to 69.6 mmHg, while systolic readings decreased by 4.95% from 107.7 mmHg to 102.4 mmHg.
In the presence of the red configuration, heart rates increased, on average, 2.84% from 84.9 bpm to 87.3 bpm. Diastolic values increased 2.71% from 69.0 mmHg to 70.9 mmHg, while systolic readings increased 5.48% from 100.9 mmHg to 106.4 mmHg.
When white was shown, the average heart rate slightly decreased from 84.3 bpm to 84.1 bpm, down 0.18%. The average diastole reading decreased 5.25%, from 72.4 mmHg before exposure to the configuration to 68.6 mmHg after its presentation. Systole readings also decreased by 7.20% (from 108.4 mmHg to 100.6 mmHg).
E. Mental Workload Measurements
The aim of assessing employees’ mental workloads was to determine whether each person perceived they had a low (under load), optimal (ideal load), or excessive (over load) workload. Dimensions included Mental Demand, relating to how much mental and perceptual activity is needed to see, remember, and search. Specifically, this category is focused on whether the work is difficult, simple, or complex. The Physical Demand dimension has to do with the types of physical activities required (e.g., pushing, pulling, and controlling the rotation). Temporal Demand is the amount of pressure associated with the perceived time during the work element. Whether the job is slow or relaxing or quick and exhausting. It can also be used to evaluate whether the workload is slow and relaxed or fast and tiring. The Own Performance dimension is for assessing how satisfied someone is with their work and whether they feel successful. The dimension of Frustration Level is a measurement of how insecure, hopeless, offended, or disturbed someone feels, or, conversely, how innocuous, contented, happy, and satisfied they are. Finally, the Effort dimension rates the levels of psychology and physical how hard required to complete the work.
The image in Figure 7 shows the percentage
of mental workload before and after
configuration; the lowest percentage was PD (8.89%), while the highest was TD (24.44%). For presentation of the red configuration, the lowest mental workload percentage was PD (10.67%), while the highest was EF (22.87%). With blue, the lowest percentage was PD (10.67%) and the highest was EF (22.67%). White color mental burden of the lowest percentage work is PD 3.33%, the highest TD 26.27%. The dimensional percentage of the mental burden of Physical Demands working in
white color indicates the lowest percentage value of the weight while the value of the percentage of the temporal demand in white indicates the highest level.
Figure 7. The percentage of dimensions before and after colour
F. Raw Rating Workload Assessment
The workload assessment is based on employees’ rankings of the six dimensions noted earlier, to produce subjective measurements of the various types of stress and satisfaction felt by each person. Given a scale of 0 to 100 (low to high), they are asked to rank various indicators relating to their productivity and outcomes.
The results of the raw rating assessment of
the workload shown in Figure 8, shows the
average value before the mental configuration. The lowest physical demand score is 40, while the highest mental demand score is 79.75. Red has a mental workload score of 36, and a high-performance score of 63. Blue’s lowest mental workload score of 33.33 and the highest performance score of 65. The color with t a physical demand score of 28.35 and the highest performance score of 63.75 is white. In the red color, the mental workload of the mental demand dimension decreases by 54.86%, blue decreases by 58.21%, and white by 24.76%.
Figure 8. Raw Rating Dimension of Mental Workload Assessment
Ruwana, I. et al. / Journal of Southwest Jiaotong University/ Vol. 55 No.4 6
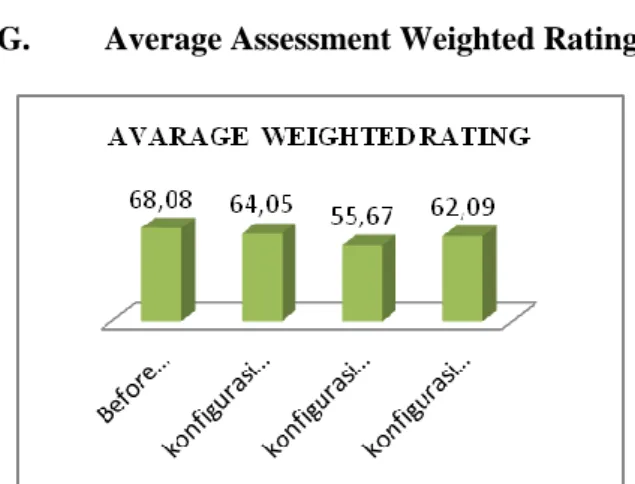
G. Average Assessment Weighted Rating
Figure 9. Average assessment chart of Weighted Rating
The average value of mental load score employees works before the Configursi 67, red color 64.07, blue color 54.67, and white color 62.09. The average value of the employee's mental load score occurs after a decrease in the blue color effect configuration down 18.23%, white color 8.80%, and red color 5.92%. Based on the results of an objective and subjective assessment when a person in a red-walled room can increase heart rate and increase blood pressure. When a person is in a room in a blue wall, his blood pressure will lower the heart rate and blood pressure [11].
IV. C
ONCLUSIONThe result of this study concludes that the effects of color and lighting variation after experiencing a configuration do have an impact on the physical comfort and mental burden of employees. The red color configuration can improve physical conditions, in employees, which include heart rate by 2.84% and diastolic blood pressure by 2.71% and systole by 5.48%. The blue configuration can reduce the heart rate by 2%, diastole by 4.57% and systole by 4.95%. The heart rate for the color white dropped by 0.18%, diastole 5.25%, and systole 7.20%. The employee mental burden comfort arising from the effects of color can reduce employee mental workload. The blue color can reduce 18% of the highest mental workload score of employees compared to the red and white effect. Employee comfort based on aspects of color options and light intake can decrease and improve the physical condition and mental burden of their work.
A
CKNOWLEDGMENTOur gratitude to the Ministry of Finance, Lembaga Pengelolaan Dana Pendidikan for
supporting this research under grant Beasiswa Unggulan Dosen Indonesia
R
EFERENCES[1]
BODUCH, M., FINCHER, W.
(2009) Standards of human comfort.
Austin: Texas: the University of Texas at
Austin, School of Architecture, Texas
[2]
COLOMBO, B., LADDAGA, S. and
ANTONIETTI, A. (2015) Psychology and
design. The Influence of the environment’s
representation over emotion and cognition.
An ET Study on Ikea design. Procedia
Manufacturing, 3 (Ahfe), pp. 2259–2266.
[3]
BERGER, B. G. and MOTL R. W.
(2000) Exercise and mood : A selective
review and synthesis of research employing
the profile of mood states. Journal of
Applied Sport Psychology, 12(1), pp. 69–92.
[4]
BINTI, N. et al. Light and space :
(2012) Users Perception towards Energy
Efficient Buildings. Procedia - Social
Behaviour Sciences, 36, pp. 51–60.
[5]
CARRUTHERS H. R. et al. (2010)
Mood colour choice helps to predict
response to hypnotherapy in patients with
irritable bowel syndrome. BMC Medical
Research
Methodology,
10(75).
DOI:
10.1186/1472-6882-10-75
[6]
BIAN, Y. and LUO, T. (2017)
Investigation of visual comfort metrics from
subjective responses in China: A study in
offices
with
daylight.
Building
and
Environment, 123, pp. 661–671.
[7]
BIAN, Y. and MA, Y. (2018)
Subjective survey and simulation analysis of
time-based visual comfort in daylit spaces.
Building and Environment, 131, pp. 63–73.
[8]
PILARCZYK, J., KUNIECKI, M.
and WO, K. (2020) Blue blood, red blood.
How does the color of an emotional scene
affect visual attention and pupil size? Vision
Research,
171,
pp.
36–45.
DOI:
10.1016/j.visres.2020.04.008
[9]
XIONG, Y., DENG, F., XU, S. and
GAO, S. (2017) Performance analysis of
multi-primary color display based on
OLEDs / PLEDs. Optics Communications,
398, pp. 49–55.
[10]
GAMITO, M. and MOREIRA, F.
(2015) Color ergonomic function in urban
chromatic plans. Procedia Manufacturing, 3
(Ahfe), pp. 5905–5911.
[11]
AB, N., MOHD, R. and SAID, N. S.
(2012) Environmental colour impact upon
human behaviour : A Review. Procedia -
Social Behaviour Sciences, 35, pp. 54–62.
[12]
BHATTACHARYYA, D. et al.
(2014) Selection of character / background
colour combinations for onscreen searching
tasks : An eye movement , subjective and
performance approach. Displays, 35, pp.
101–109.
[13]
LI, Z. et al. (2016) Building a
framework for ergonomic research on
laparoscopic
instrument
handles.
International Journal of Surgery, 30, pp.
74–82.
[14]
IACOMUSSI, P. et al. (2015) Visual
Comfort with LED Lighting. Energy
Procedia, 78, pp. 729–734.
[15]
GENTILE, N., LAIKE, T. and
DUBOIS, M. (2014) Lighting control
systems in peripheral offices rooms at high
latitude : measurements of electricity
savings and users preferences. Energy
Procedia, 57, pp. 1987–1996.
[16]
DIANAT, I., VAHEDI, A. and
DEHNAVI, S. (2016) Association between
objective and subjective assessments of
environmental
ergonomic
factors
in
manufacturing plants. International Journal
of Industrial Ergonomics, 54, pp. e39–e42.
[17]
CAO, A. R. D. E., CHINTAMANI,
K.K. and PANDYA, A.K. (2009) NASA
TLX : Software for assessing subjective
mental
workload.
Behavior
Research
Methods 41(1), pp. 113–117,.
[18]
MIKELLIDES, B. (2017) Colour
psychology: The emotional effects of colour
perception. In: BEST, J. (ed.) Colour Design.
2nd ed. Cambridge: Woodhead Publishing
Limited, pp.
193-214. DOI:
10.1016/B978-0-08-101270-3.00008-4
[19]
TANTANATEWIN,
W.
and
INKAROJRIT, V. (2016) Effects of color
and lighting on retail impression and
identity,
Journal
of
Environmental
Psychology, 46, pp. 197–205,.
[20]
DE KORTE, E. M. et al. Personal
environmental control : Effects of
pre-setconditions for heating and lighting on
personal settings, task performance and
comfort
experience.
Building
and
Environment, 86, pp. 166–176.
参考文:
[1] BODUCH
, M. , FINCHER , W.
(2009)
人類舒適度標準。奧斯汀:德克薩
斯州:德克薩斯大學奧斯汀分校建築學
院
[2] B. COLOMBO,S。LADDAGA 和 A.
ANTONIETTI
,(2015),《心理學與
設計》。環境表徵對情感和認知的影響
。關於宜家設計的 ET 研究。工藝製造,
3 (Ahfe),第 2259-2266 頁。
[3] BERGER,B. G. 和 MOTL R. W.
(2000)運動與情緒:利用情緒狀態的概
況對研究進行選擇性回顧和綜合。 《應
用運動心理學雜誌》,12(1),第 69–92
頁。
[4] BINTI,N。等。 《光與空間》:(
2012
) 用 戶 對 節 能 建 築 的 看 法 。
Procedia-社會行為科學,36,第 51-60 頁.
[5] CARRUTHERS H. R. 等。 (2010)情
緒顏色的選擇有助於預測腸易激綜合症
患者對催眠療法的反應。 BMC 醫學研究
方法論,10(75)。DOI:
10.1186/1472-6882-10-75
[6] BIAN, Y.
和 LUO, T.(2017)中國主
觀反應對視覺舒適度指標的調查:對有
日光辦公室的研究。建築與環境,123,
第 661-671 頁。
[7] BIAN,Y. 和 MA,Y.(2018)日光空
間中基於時間的視覺舒適度的主觀調查
和模擬分析。建築與環境, 131,第
63-73
頁。
[8] PILARCZYK,J.,KUNIECKI,M. 和
WO,K.(2020)藍色血液,紅色血液感
Ruwana, I. et al. / Journal of Southwest Jiaotong University/ Vol. 55 No.4 8