Failure to con fi rm a sodium – glucose cotransporter 2 inhibitor-induced
hematopoietic effect in non-diabetic rats with renal anemia
Daisuke Yamazaki1,2, Yoshio Konishi2, Takashi Morikawa2, Hideki Kobara3, Tsutomu Masaki3, Hirofumhi Hitomi4, Kenji Osafune5 , Daisuke Nakano1, Wararat Kittikulsuth1, Akira Nishiyama1,*
1Department of Pharmacology, Faculty of Medicine, Kagawa University, Kagawa, Japan,2Division of Nephrology and Hypertension, Osaka City General Hospital, Osaka, Japan,
3Department of Gastroenterology and Neurology, Faculty of Medicine, Kagawa University, Kagawa, Japan,4Department of iPS Stem Cell Regenerative Medicine, Kansai Medical University, Osaka, Japan, and5Department of Cell Growth and Differentiation, Center for iPS Cell Research and Application, Kyoto University, Kyoto, Japan
Keywords
Erythropoietin, Renal anemia, Sodium–glucose cotransporter 2 inhibitor
*Correspondence Akira Nishiyama Tel.: +81-87-891-2125 Fax: +81-81-891-2126 E-mail address:
[email protected] J Diabetes Investig2020 doi: 10.1111/jdi.13205
ABSTRACT
Aims/Introduction:Clinical studies have shown that treatment with inhibitors of sodium–glucose cotransporter 2 (SGLT2) significantly increases the hematocrit in patients with type 2 diabetes. To investigate whether SGLT2 inhibitors directly promote erythropoi- etin production independently on blood glucose reduction, the hematopoietic effect of the specific SGLT2 inhibitor, luseogliflozin, was examined in non-diabetic rats with renal anemia.
Materials and Methods:Renal anemia was induced by treatment with adenine (200 or 600 mg/kg/day, orally for 10 days) in non-diabetic Wistar–Kyoto or Wistar rats, respec- tively. Luseogliflozin (10 mg/kg bodyweight) or vehicle (0.5% carboxymethyl cellulose) was then administered for 6 weeks. The hematocrit and the hemoglobin (Hb), blood urea nitrogen, plasma creatinine, and plasma erythropoietin levels were monitored.
Results:Treatment with adenine decreased the hematocrit and the Hb level, which were associated with increases in the blood urea nitrogen and plasma creatinine levels. In Wistar–Kyoto rats treated with 200 mg/kg/day adenine, administration of luseogliflozin induced glycosuria, but did not change the blood urea nitrogen, plasma creatinine levels, hematocrit, Hb or plasma erythropoietin levels. Similarly, luseogliflozin treatment failed to change the hematocrit or the Hb levels in Wistar rats with renal anemia induced by 600 mg/kg/day of adenine. Plasma erythropoietin concentrations were also not different between luseogliflozin- and vehicle-treated rats. Similarly, in human erythropoietin-produc- ing cells derived from pluripotent stem cells, luseogliflozin treatment did not change the erythropoietin level in the medium.
Conclusions:These data suggest that SGLT2 inhibitor fails to exert hematopoietic effects in non-diabetic conditions.
INTRODUCTION
Several animal studies have found renoprotective effects of sodium–glucose cotransporter 2 (SGLT2) inhibitors in diabetic kidney disease (DKD)1,2. Furthermore, large clinical trials, such as Empagliflozin Cardiovascular Outcome Event Trial in Type 2
diabetes Mellitus Patients Outcome (EMPA-REG OUTCOME) study, The CANagliflozin cardioVascular Assessment Study (CANVAS) program and the Canagliflozin on Renal and Car- diovascular Outcomes in Participants With Diabetic Nephropa- thy (CREDENCE) study have showed that treatment with an SGLT2 inhibitor slowed the progression of DKD in patients with type 2 diabetes3–5. Reductions in blood glucose levels, bodyweight and blood pressure can partially explain the
Received 22 September 2019; revised 23 December 2019; accepted 26 December 2019
ª2019 The Authors. Journal of Diabetes Investigation published by Asian Association for the Study of Diabetes (AASD) and John Wiley & Sons Australia, Ltd J Diabetes Investig Vol.No. 2020 1
This is an open access article under the terms of the Creative Commons Attribution-NonCommercial License, which permits use, distribution and reproduction in any medium, provided the original work is properly cited and is not used for commercial purposes.
O R I G I N A L A R T I C L E
renoprotective mechanism of SGLT2 inhibitors; however, the full mechanistic details remain under debate6.
Sano et al.7,8 hypothesized that the renoprotective effect of SGLT2 inhibitors is associated with their hematopoietic effects. Indeed, a meta-analysis of 14 randomized controlled trials showed that treatment with SGLT2 inhibitors signifi- cantly elevated the hematocrit and the hemoglobin (Hb) levels in patients with type 2 diabetes9. Inagaki et al.10 showed that treatment with canagliflozin for 52 weeks signifi- cantly increased the hematocrit by 2.1–2.3% from baseline in type 2 diabetes patients who had normal kidney function.
Additionally, Yale et al.11 showed that canagliflozin adminis- tration for 26 weeks increased the hematocrit by 4.8–6.0%
from baseline in chronic kidney disease (CKD) patients with type 2 diabetes. These clinical data suggest that renal dysfunc- tion potentiates an SGLT2 inhibitor-induced elevation of the hematocrit in patients with type 2 diabetes.
Lamberset al.12 showed that treatment with dapagliflozin for 2 weeks significantly increased the hematocrit, and this change was accompanied by an increase in the plasma erythropoietin level. The reticulocyte count was also increased, followed by increases in the hematocrit of 2.2% at 12 weeks of treatment.
These results suggest that an SGLT2 inhibitor-induced enhance- ment of erythropoietin production contributes to increasing the hematocrit in patients with type 2 diabetes. However, it is still not clear whether SGLT2 inhibitors directly stimulate erythro- poietin production or not.
To address this clinical question directly, we aimed to examine the effects of an SGLT2 inhibitor on the hematocrit and on the Hb, and plasma erythropoietin levels in non-diabetic rats with renal anemia. Our studies were carried out in non-diabetic ani- mals, because changes in the plasma glucose levels are known to influence kidney erythropoietin production13. The hematopoietic effects of the SGLT2 inhibitor, luseogliflozin, were examined in non-diabetic adenine-treated Wistar–Kyoto and Wistar rats, which are models for renal anemia with tubulointerstitialfibrosis, respectively14. The effect of an SGLT2 inhibitor on erythropoietin production was also examined in human induced pluripotent stem cell (hiPSC)-derived erythropoietin-producing cells, which were recently established in our laboratory15.
METHODS Animals
All experimental procedures were approved by the local institu- tional committee at Kagawa University and Osaka City General Hospital. Five-week-old male Wistar–Kyoto and Wistar rats were purchased from Japan SLC Inc. (Shizuoka, Japan).
Drugs
Adenine and carboxymethyl cellulose were purchased from Sigma-Aldrich Inc. (St. Louis, MO, USA) and Wako Pure Chemical Industries Ltd. (Osaka, Japan), respectively. Luseo- gliflozin was provided by Taisho Pharmaceuticals Co., Ltd.
(Tokyo, Japan).
Experimental protocols
Protocol 1: Wistar–Kyoto rats with renal anemia
Our preliminary experiments showed that the administration of adenine at a dose of 200 mg/kg for 10 days significantly decreased the hematocrit and the Hb levels in Wistar–Kyoto rats, producing a state representative of renal anemia (data not shown). Accordingly, vehicle (0.5% carboxymethyl cellulose) or adenine (200 mg/kg/day) was administered for 10 days by oral gavage (n= 4 or 16, respectively). Thereafter, the vehicle-trea- ted rats continued treatment with the vehicle for 6 more weeks, as a control. The adenine-treated animals were subse- quently administered with vehicle (n= 8) or luseogliflozin (10 mg/kg/day, per oral, n=8) for 6 weeks. All rats were euthanized by administering an overdose of sodium pentobar- bital (250 mg/kg, intraperitoneal injection) at the end of the observation period.
Protocol 2: Wistar rats with renal anemia
We followed further studies in Wistar rats treated with 600 mg/kg/day of adenine, a model representing severe renal anemia comparable to Wistar–Kyoto rats with renal anemia to examine the effect of an SGLT2 inhibitor on hematopoiesis in different species. Vehicle (0.5% carboxymethyl cellulose) or adenine (600 mg/kg/day, per oral) was administered for 10 days in Wistar rats (n= 4 or 12, respectively)14. Thereafter, the vehicle-treated rats continued treatment with the vehicle for 6 more weeks, as a control. The adenine-treated rats were subsequently administered with vehicle (n=6) or luseogliflozin (10 mg/kg/day, per oral, n=6) for 6 weeks. All rats were euthanized by administering an overdose of sodium pentobar- bital (250 mg/kg, intraperitoneal injection) at the end of the observation period.
Sample collection and blood pressure measurement
Blood samples were collected from the tail vein at 0, 2 and 6 weeks after vehicle or luseogliflozin treatment. Urine samples were collected for 24 h using metabolic cages. After the rats had been euthanized, the left kidney tissues were harvested, then fixed in 10% neutral-buffered formalin and embedded in paraffin for histological studies.
Systolic blood pressure was measured in conscious rats by tail-cuff plethysmography (model BP-98A; Soft-ron Co., Tokyo, Japan). The mean value of the lowest three readings was recorded16.
Biochemical and hematological parameters
The hematocrit and the blood urea nitrogen (BUN), plasma creatinine (Cre), Hb, and plasma glucose levels were all mea- sured by using an automated analyzer (Abbott Point of Care, Chicago, IL, USA). Plasma erythropoietin levels were measured by an enzyme-linked immunosorbent assay kit (BioLegend, San Diego, CA, USA). Glucose levels in the urine were measured by using an automated analyzer (Hitachi High-Technology, Tokyo, Japan).
Histological analysis
Tissue samples were cut into 2-µm thick sections and stained with azan reagent, as described previously17. The area of posi- tive azan staining was calculated using ImageJ (National Insti- tutes of Health, Bethesda, MD, USA), and the affected area was divided by the total area of the microscopic field18. A total of 20 consecutive microscopicfields were examined.
Cell culture
HiPSC line 253G4 was used, as previously described19. The dif- ferentiation of hiPSC-derived erythropoietin-producing cells was carried out based on the method used in our previous work15. Briefly, hiPSCs were dissociated, then seeded with stage 1 medium. On day 7, the medium was changed to stage 2 medium. In the present study, hiPSC-derived erythro- poietin-producing cells were treated with vehicle (2-hydroxyl- propyl-b-cyclodextrin; n= 5), 100 nmol/L luseogliflozin (n=4), 500 nmol/L luseogliflozin (n =4) or 50µmol/L of FG-4592 (n=3; Cayman, Ann Arbor, MI, USA). We previ- ously showed that treatment with 100 nmol/L luseogliflozin sufficiently blocks SGLT2in vitro20. Previous work also showed that treatment with 50µmol/L FG-4592, a selective hypoxia-in- ducible factor prolyl hydroxylase inhibitor, consistently increased the erythropoietin levels in the medium15. Therefore, we utilized FG-4592 as a positive control. After 40 h of incuba- tion, the culture medium was collected to measure human ery- thropoietin levels by the enzyme-linked immunosorbent assay method in accordance with the manufacturer’s protocol (Ery- thropoietin ELISA; ALPCO, Boston, MA, USA).
Previous studies have shown that hiPSC-derived erythropoi- etin-producing cells did not grow under glucose conditions
<25 mmol/L15. Another study was carried out to examine the effect of luseogliflozin under different glucose concentrations (50 mmol/L). HiPSC-derived erythropoietin-producing cells
were grown for 5 days, and were incubated in stage 2 medium containing knockout Dulbecco’s modified Eagle’s medium with 25 or 50 mmol/L glucose. After 40 h of treatment with luseo- gliflozin (100 nmol/L) was administered, the culture medium was collected to measure erythropoietin levels.
Statistical analysis
Values are presented as the mean– standard error of the mean. A one-way analysis of variance followed by Turkey’s multiple comparison test was used for cross-sectional one-factor data from multiple groups (i.e., urinary glucose excretion, urine volume, water intake, water balance gap and the degree of renal interstitial fibrosis evaluated by azan staining). Longitudinal data (i.e., blood pressure, heart rate, blood glucose, hematocrit, Hb level, plasma erythropoietin level, BUN level, plasma Cre level and bodyweight) were analyzed by a two-way analysis of variance followed by the Bonferroni post-hoc test to determine differences between groups. Differences with values ofP <0.05 were considered statistically significant.
RESULTS
Effect of an SGLT2 inhibitor in Wistar–Kyoto rats with renal anemia (protocol 1)
Wistar–Kyoto rats treated with 200 mg/kg/day of adenine fol- lowed by the administration of luseogliflozin for 6 weeks had a significantly higher level of urinary glucose excretion (476– 89 mg/day), as compared with vehicle-treated rats (2–1 mg/dL). However, the plasma postprandial glucose levels (161– 1 mg/dL) in the luseogliflozin-treated rats were not dif- ferent from those of the vehicle-treated rats (157–3 mg/dL).
Treatment with adenine significantly reduced the bodyweight of rats as compared with vehicle treatment, but luseogliflozin treatment did not affect the bodyweight during the observation period (Table 1). Adenine-treated Wistar–Kyoto rats showed a
Table 1| Hemodynamic effect of luseogliflozin in adenine (200 mg/kg/day)-treated Wistar–Kyoto rats
Control Adenine (200 mg/kg) + vehicle Adenine (200 mg/kg) + luseogliflozin
Bodyweight at 0 week (g) 272–3 179–3* 173–5
Bodyweight at 2 weeks (g) 347–13 283–8* 273–16
Bodyweight at 6 weeks (g) 367–12 309–7* 306–12
Urine volume at 2 weeks (mL/day) 29.4–7.2 72.6–2.1* 69.7–2.5
Water intake at 2 weeks (mL/day) 44.3–6.5 85.8–2.5* 86.8–1.7
Food intake at 2 weeks (g/day) 23.3–0.1 12.2–0.8* 21.8–1.2†
Blood pressure at 1 week (mmHg) 118–4 127–2 131–5
BUN level at 0 week (mg/dL) 22–1 67–4* 72–5
BUN level at 6 weeks (mg/dL) 22–1 56–2* 50–2
Plasma Cre level at 0 week (mg/dL) 0.30–0.01 0.95–0.05* 1.03–0.06
Plasma Cre level at 6 weeks (mg/dL) 0.40–0.01 0.74–0.02* 0.74–0.02
Values are the mean–standard error of the mean.†*P<0.05, adenine+vehicle versus control.†P<0.05, adenine+luseogliflozin versus adenine+ vehicle. Bodyweight at 0, 2 and 6 weeks after luseogliflozin treatment in adenine (200 mg/kg/day)-treated rats, respectively. Urine volume, water intake, food intake and blood pressure after luseogliflozin treatment in adenine (200 mg/kg/day)-treated rats. Blood urea nitrogen (BUN) and plasma creatinine (Cre) levels at 0 and 6 weeks after luseogliflozin treatment in adenine (200 mg/kg/day)-treated rats, respectively.‡
ª2019 The Authors. Journal of Diabetes Investigation published by AASD and John Wiley & Sons Australia, Ltd J Diabetes Investig Vol.No. 2020 3
O R I G I N A L A R T I C L E
http://wileyonlinelibrary.com/journal/jdi SGLT2 inhibitor in non-diabetic renal anemia
higher urine volume, accompanied by a higher water intake, compared with vehicle-treated rats (Table 1). However, subse- quent luseogliflozin administration did not affect the urine vol- ume or water intake. Food intake in luseogliflozin-treated rats was greater compared with that of adenine-treated Wistar– Kyoto rats (Table 1). As compared with control rats, the blood pressure in adenine-treated Wistar–Kyoto rats trended higher;
however, this difference was not statistically significant. Treat- ment with luseogliflozin did not affect the blood pressure (Table 1).
At 2 weeks after treatment, the hematocrit (31– 1%) and Hb level (10.7– 0.1 g/dL) in Wistar–Kyoto rats treated with adenine were remarkably lower as compared with control rats (hematocrit 49– 2% and Hb 16.5–0.5 g/dL; Figure 1a,b).
However, in the adenine-treated Wistar–Kyoto rats, subsequent luseogliflozin treatment did not induce any measurable change
in the hematocrit (38– 1%) or the Hb level (12.9–0.4 g/dL), as compared with vehicle treatment (hematocrit 38– 0.4% and Hb 13.0– 0.1 g/dL; Figure 1a,b). Treatment with adenine resulted in a significantly lower plasma erythropoietin level (8.19– 0.96 pg/mL), as compared with control treatment (48.8– 5.4 pg/mL; Figure 1c). However, in adenine-treated Wistar–Kyoto rats, those additionally treated with luseogliflozin did not have a higher plasma erythropoietin level (5.95– 0.56 pg/mL) than those treated with vehicle (6.73– 0.60 pg/mL; Figure 1c).
We also investigated whether luseogliflozin causes hemocon- centration by analyzing the water balance gap (calculated as the difference between water intake and urine volume). The water balance gap was higher in Wistar–Kyoto rats treated with adenine than in control rats at 2 weeks after treatment (vehicle-treated rats 36.0–3.9 mL/day vs control rats 15.3–2.1 mL/day). However, among the adenine-treated Wis- tar–Kyoto rats, those additionally treated with luseogliflozin did not show a difference in the water balance gap (37.1– 1.8 mL/day), as compared with those further treated with vehicle.
Adenine-treated Wistar Kyoto rats had higher BUN (69–3 mg/dL) and plasma Cre levels (0.99–0.04 mg/dL), as compared with control rats (BUN 22– 1 mg/dL, Cre 0.30–0.01 mg/dL; Table 1). After 6 weeks of subsequent vehi- cle administration, the BUN and plasma Cre levels were slightly lower in these adenine-treated Wistar–Kyoto rats (BUN 56–2 mg/dL and Cre 0.74– 0.02 mg/dL). Luseogliflozin administration for 6 weeks did not change the BUN (50–2 mg/dL) or plasma Cre (0.74–0.02 mg/dL) levels (Table 1). Similarly, luseogliflozin-treated rats did not show any difference in the renal interstitial area of positive azan staining compared with vehicle-treated rats (Figure 2).
Effect of an SGLT2 inhibitor in Wistar rats with renal anemia (protocol 2)
To examine the effect of an SGLT2 inhibitor on hematopoiesis in different species, Wistar rats treated with 600 mg/kg/day of adenine were used14. Consistent with the data produced by protocol 1, the administration of luseogliflozin for 2 weeks in Wistar rats treated with 600 mg/kg/day of adenine caused sig- nificantly more urinary glucose excretion (175–18 mg/day), but no differences in the plasma postprandial glucose level (122– 5 mg/dL), as compared with vehicle administration (uri- nary glucose excretion 30– 1 mg/day, plasma postprandial glu- cose level 122–2 mg/dL).
Treatment with adenine resulted in significantly lower body- weight, as compared with control rats, but subsequent luseogli- flozin treatment did not alter the bodyweight during the observation period (Table 2). Adenine-treated Wistar rats showed a higher urine volume that was accompanied by a higher level of water intake compared with control rats (Table 2). However, luseogliflozin treatment did not affect the urine volume or water. Treatment with luseogliflozin did not 20
40 60
20 40 60
0 2 6
0 2 6
0 2 6
Adenine (200 mg/kg) + luseogliflozin Adenine (200 mg/kg) + vehicle Control
Adenine (200 mg/kg) + luseogliflozin Adenine (200 mg/kg) + vehicle Control
Adenine (200 mg/kg) + luseogliflozin Adenine (200 mg/kg) + vehicle Control
* *
*
*
*
* Hematocrit (%) (a)
(b)
(c)
Hemoglobin level (g/dL)
8 14 20
Weeks
Weeks Weeks
Plasma erythropoietin level (pg/mL)
Figure 1| Effect of luseogliflozin on the hematocrit and hemoglobin, and plasma erythropoietin levels in non-diabetic Wistar–Kyoto rats with renal anemia. Wistar–Kyoto rats were treated with adenine (200 mg/
kg/day) for 10 days to induce mild renal anemia. (a–b) the hematocrits (a) and hemoglobin levels (b) at 0, 2 and 6 weeks after luseogliflozin treatment. (c) The plasma erythropoietin levels before and after luseogliflozin treatment in adenine (200 mg/kg/day)-treated Wistar– Kyoto rats. *P<0.05, adenine + vehicle vs control.
increase food intake in adenine-treated Wistar rats (Table 2).
There was no significant difference in blood pressure among the groups (Table 2).
Adenine-treated Wistar rats had a significantly lower hematocrit (38–1%) and significantly lower Hb levels (12.9– 0.2 g/dL), as compared with control rats (hematocrit
Control
Luseogliflozin
Luseogliflozin 8
* NS
4
0
Control
Azan staining positive area (%) Vehicle
Vehicle Adenine 200 mg/kg
Figure 2| Effect of luseogliflozin on tubulointerstitial injury in non-diabetic Wistar–Kyoto rats with renal anemia. Interstitial fibrosis was evaluated by a semiquantitative analysis of azan staining. Scale bar, 100µm. *P<0.05, adenine + vehicle versus control.
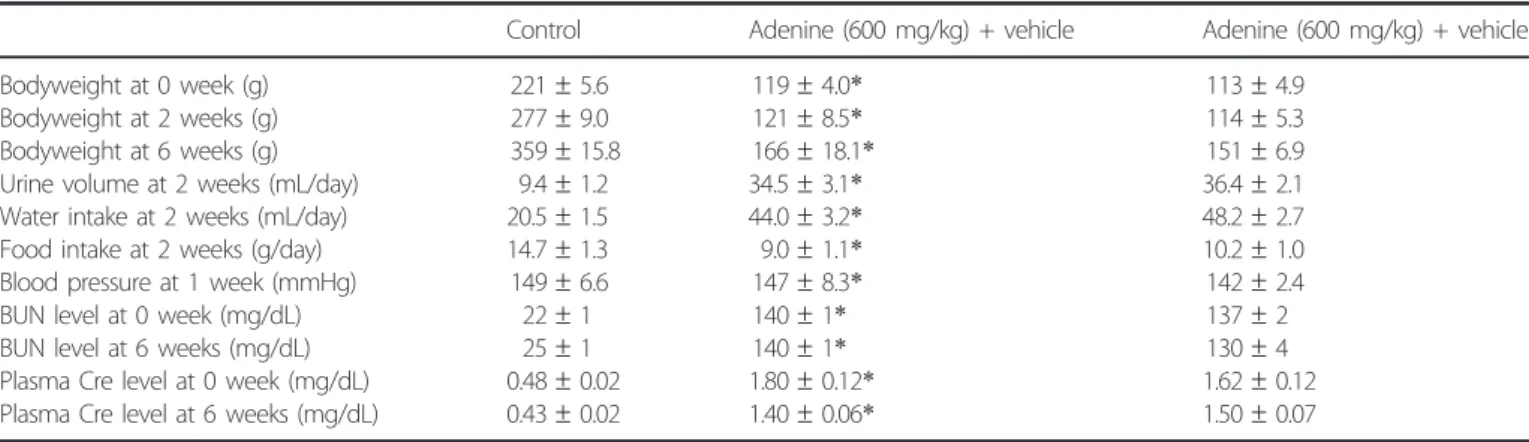
Table 2| Hemodynamic effect of luseogliflozin in adenine (600 mg/kg/day)-treated Wistar rats
Control Adenine (600 mg/kg) + vehicle Adenine (600 mg/kg) + vehicle
Bodyweight at 0 week (g) 221–5.6 119–4.0* 113–4.9
Bodyweight at 2 weeks (g) 277–9.0 121–8.5* 114–5.3
Bodyweight at 6 weeks (g) 359–15.8 166–18.1* 151–6.9
Urine volume at 2 weeks (mL/day) 9.4–1.2 34.5–3.1* 36.4–2.1
Water intake at 2 weeks (mL/day) 20.5–1.5 44.0–3.2* 48.2–2.7
Food intake at 2 weeks (g/day) 14.7–1.3 9.0–1.1* 10.2–1.0
Blood pressure at 1 week (mmHg) 149–6.6 147–8.3* 142–2.4
BUN level at 0 week (mg/dL) 22–1 140–1* 137–2
BUN level at 6 weeks (mg/dL) 25–1 140–1* 130–4
Plasma Cre level at 0 week (mg/dL) 0.48–0.02 1.80–0.12* 1.62–0.12
Plasma Cre level at 6 weeks (mg/dL) 0.43–0.02 1.40–0.06* 1.50–0.07
Values are the mean–standard error of the mean.†*P<0.05, adenine+vehicle versus control. Bodyweight at 0, 2 and 6 weeks after luseogliflozin treatment in adenine (600 mg/kg/day)-treated rats, respectively. Urine volume, water intake, food intake and blood pressure after luseogliflozin treat- ment in adenine (600 mg/kg/day)-treated rats. Blood urea nitrogen (BUN) and plasma creatinine (Cre) levels at 0 and 6 weeks after luseogliflozin treatment in adenine (600 mg/kg/day)-treated rats, respectively.
ª2019 The Authors. Journal of Diabetes Investigation published by AASD and John Wiley & Sons Australia, Ltd J Diabetes Investig Vol.No. 2020 5
O R I G I N A L A R T I C L E
http://wileyonlinelibrary.com/journal/jdi SGLT2 inhibitor in non-diabetic renal anemia
47–1%, Hb 15.9– 0.3 g/dL; Figure 3a,b). The administration of luseogliflozin for 6 weeks did not induce any change in the hemat- ocrit (40–1%) or the Hb levels (13.6–0.4 g/dL), as compared with vehicle treatment (hematocrit 38–2%, Hb 12.8–0.6 g/dL;
Figures 3a,b).
Adenine-treated Wistar rats had a lower plasma erythropoi- etin level (15.3–2.6 pg/mL), as compared with control rats (52.8–6.5 pg/mL; Figure 3c). The additional administration of luseogliflozin for 6 weeks did not alter the plasma erythropoi- etin level (9.27– 0.80 pg/mL), as compared with vehicle treat- ment (8.91–1.75 pg/mL; Figure 3c). Similarly, luseogliflozin- treated rats did not show any difference in the water balance gap, as compared with vehicle-treated rats (luseogliflozin-treated rats 11.8–4.6 vs vehicle-treated rats 9.5–4.9 mL/day).
Adenine-treated Wistar rats had higher BUN (139–2 mg/
dL) and Cre levels (1.70–0.09 mg/dL), as compared with con- trol rats (BUN 22–1 mg/dL, Cre 0.48–0.02 mg/dL; Table 2).
The additional administration of luseogliflozin for 6 weeks did not alter the BUN (130–4 mg/dL) or plasma Cre (1.50– 0.07 mg/dL) level, as compared with vehicle treatment (BUN 140– 1 mg/dL, Cre 1.40–0.06 mg/dL; Table 2). Fur- thermore, adenine-induced renal interstitial fibrosis, as evalu- ated by the azan-positive area, was not affected by luseogliflozin treatment (Figure 4).
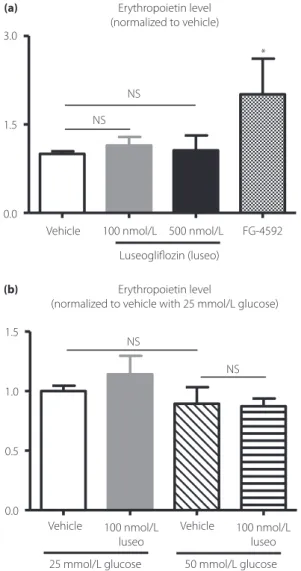
Effects of an SGLT2 inhibitor on erythropoietin production in erythropoietin-producing cells
Consistent with thefindings of previous studies15, treatment of hiPSC-derived erythropoietin-producing cells with 50µmol/L FG-4592 significantly increased erythropoietin levels in the medium (108–28 mIU/mL), as compared with vehicle treat- ment of these cells (54–3 mIU/mL). However, luseogliflozin (100 or 500 nmol/L) did not increase the erythropoietin levels in the medium (100 nmol/L luseogliflozin, 61– 8 mIU/mL;
500 nmol/L luseogliflozin, 57–14 mIU/mL; Figure 5a, the data are shown as values that are normalized to the erythropoi- etin level that was associated with vehicle treatment).
Studies were also carried out to verify whether the difference in glucose concentration affects the ability of luseogliflozin to produce erythropoietin. However, erythropoietin levels in the medium were not significantly different between 25 and 50 mmol/L glucose. Additionally, treatment with lusegliflozin did not change the erythropoietin levels during 25 or 50 mmol/L glucose treatment (Figure 5b).
DISCUSSION
Clinical studies have shown that the hematocrit and the Hb levels were significantly elevated in patients with type 2 diabetes who were treated with SGLT2 inhibitors9,10,12,21–23. Further- more, the complication of CKD promotes an elevation of the hematocrit in diabetes patients treated with an SGLT2 inhibi- tor11. Based on these clinical observations, several investigators hypothesized that SGLT2 inhibitors directly induce a hematopoietic effect through the stimulation of erythropoietin production in the kidney7,8,24. In the present study, we carried out studies to examine the hematopoietic effect of the SGLT2 inhibitor, luseogliflozin, in non-diabetic rats with adenine-in- duced CKD modeling renal anemia. Previous studies have shown that luseogliflozin at doses of 0.3–3 mg/kg dose-depen- dently increased urinary glucose excretion in non-diabetic and diabetic rats25. Furthermore, administration of 10 mg/kg/day luseogliflozin exerted renoprotective effect in rats with type 2 diabetes26. As the present study also showed that treatment with luseogliflozin at 10 mg/kg/day significantly increased uri- nary glucose excretion in non-diabetic adenine-induced CKD rats, it seems likely that luseogliflozin at 10 mg/kg/day effec- tively inhibits SGLT2 in these animals. However, the blood glu- cose, hematocrit and Hb, and plasma erythropoietin levels were not changed by luseogliflozin treatment. Furtherin vitrostudies in hiPSC-derived erythropoietin-producing cells showed no change in erythropoietin release into the medium after the 20
40 60
20 40 60
0 2 6
0 2 6
0 2 6
Adenine (600 mg/kg) + luseogliflozin Adenine (600 mg/kg) + vehicle Control
Adenine (600 mg/kg) + luseogliflozin Adenine (600 mg/kg) + vehicle Control
Adenine (600 mg/kg) + luseogliflozin Adenine (600 mg/kg) + vehicle Control
*
*
*
*
*
* *
Hematocrit (%) (a)
(b)
(c)
Hemoglobin level (g/dL)
8 14 20
Weeks
Weeks Weeks
Plasma erythropoietin level (pg/mL)
Figure 3| Effect of luseogliflozin on the hematocrit and hemoglobin, and plasma erythropoietin levels in non-diabetic Wistar rats with renal anemia. Wistar rats were treated with adenine (600 mg/kg/day) for 10 days to induce renal anemia. The (a) hematocrits and (b)
hemoglobin levels at 0, 2 and 6 weeks after luseogliflozin treatment. (c) The plasma erythropoietin levels before and after luseogliflozin treatment in adenine (600 mg/kg/day)-treated Wistar rats. *P<0.05, adenine + vehicle versus control.
addition of luseogliflozin. Collectively, these data fail to support the hypothesis7,8,24, based on previous clinical studies9,10,12,21–23, that SGLT2 inhibitors directly stimulate erythropoietin produc- tion.
Although clinical observations have suggested that SGLT2 inhibitors have a hematopoietic effect in patients with type 2 diabetes, no studies have examined such an effect in non-dia- betic patients; experiments addressing this issue are particularly important to exclude the possibility that kidney erythropoietin production is merely enhanced by the SGLT2 inhibitor-induced reductions in plasma glucose levels in patients with diabetes.
Importantly, recent clinical studies have shown that erythropoi- etin deficiency is induced during the early phase of DKD, but is not induced in non-diabetic CKD of similar severity13. Here, the effect of an SGLT2 inhibitor was examined in non-diabetic rats treated with adenine, a model representing renal anemia.
The present data show that treatment with an SGLT2 inhibitor did not change the hematocrit or the Hb and plasma erythro- poietin levels in non-diabetic rats with adenine-induced renal anemia. These data are consistent with those of previous studies in rodents that SGLT2 inhibition did not change the hematocrit or the Hb levels27–29. Given the lack of change in the
hematocrit and the Hb levels in these experiments27–29, the dis- crepant data regarding the hematopoietic effect of SGLT2 inhi- bition between humans and rodents might be due to a species difference. Further clinical studies including non-diabetic patients with CKD, such as EMPA-KIDNEY and DAPA-CKD, will clarify the issue of whether SGLT2 inhibitors increase hematocrit and Hb levels in non-diabetic CKD patients (EMPA-KIDNEY: https://www.boehringer-ingelheim.com/
EMPA-KIDNEY, DAPA-CKD: https://www.astrazeneca.c om/media-centre/press-releases/2016/astrazeneca-announces- two-new-phase-IIIb-trials-for-Forxiga-in-chronic-kidney-disease- and-chronic-heart-failure-120920161.html#).
Clinical studies have also shown that the SGLT2 inhibitor-in- duced reduction in plasma volume contributes to the increased hematocrit30. Indeed, treatment with SGLT2 inhibitors induces weight loss31,32, which is associated with increases in urine vol- ume and urinary sodium excretion33,34. In the present study, we observed no difference in the urine volume, bodyweight or water balance gap between vehicle- and luseogliflozin-treated rats with adenine-induced renal anemia. It is important to note that luseogliflozin should be pharmacologically effective in these CKD model animals, because their urinary glucose excretion Control
Luseogliflozin Azan staining positive
area (%) Vehicle
* N.S.
30
15
0
Luseogliflozin Control Vehicle
Adenine 600 mg/kg
Figure 4| Effect of luseogliflozin on tubulointerstitial injury in non-diabetic Wistar rats with renal anemia. Interstitial fibrosis was evaluated by a semiquantitative analysis of azan staining. Scale bar, 100µm. *P<0.05, adenine + vehicle versus control.
ª2019 The Authors. Journal of Diabetes Investigation published by AASD and John Wiley & Sons Australia, Ltd J Diabetes Investig Vol.No. 2020 7
O R I G I N A L A R T I C L E
http://wileyonlinelibrary.com/journal/jdi SGLT2 inhibitor in non-diabetic renal anemia
was significantly increased. The present data also show that treatment with an SGLT2 inhibitor does not induce a diuretic effect or hemoconcentration in rats with adenine-induced CKD. In agreement with previous studies14, adenine-treated CKD model rats showed markedly higher basal urinary volume and water intake compared with control rats, and this might affect the SGLT2 inhibitor effects on urine volume, bodyweight and water balance. Recent studies have shown that ipragliflozin did not change the total body water content in non-diabetic and diabetic rats when free access to food and water was allowed29. These data suggest that the SGLT2 inhibitor does
not change total body water balance in non-diabetic rodents under conditions of ad libitum food and water intake.
Lamberset al.12reported a significant elevation of the plasma erythropoietin level after SGLT2 inhibitor treatment in patients with type 2 diabetes. Interestingly, the SGLT2 inhibitor-induced enhancement in the plasma erythropoietin level was transient, and the level of plasma erythropoietin gradually returned to normal. In contrast, the observed increase in the hematocrit continued over time and did not return to its basal value12. These different time-dependent changes between the hematocrit and plasma erythropoietin levels indicate that SGLT2 inhibitors functionally improve erythropoietin production in the kidneys, as hypothesized by other investigators7,8,24. However, there have not yet been any other clinical reports showing that the plasma erythropoietin level is directly increased by treatment with an SGLT2 inhibitor. Furthermore, the present study failed to observe a significant increase in the plasma erythropoietin level after treatment with an SGLT2 inhibitor in non-diabetic rats with renal anemia. Further studies should be carried out in dia- betic animals; however, there is no available animal model of DKD that shows renal anemia with a low erythropoietin level35,36.
It is difficult to directly analyze erythropoietin production in the kidneys in vivo by using currently available methods, such as immunohistochemistry. Therefore, we carried out in vitro experiments to investigate whether an SGLT2 inhibitor directly stimulates erythropoietin production in erythropoietin-produc- ing cells differentiated from hiPSCs15. The present data showed that treatment with an SGLT2 inhibitor did not increase the amount of erythropoietin release into the medium in hiPSC- derived erythropoietin-producing cells. However, because hiPSC-derived erythropoietin-producing cells were generated through hepatic lineage15, future studies should examine the effect of SGLT2 inhibitors in erythropoietin-producing cells from the kidneys. Our data also showed that luseogliflozin did not stimulate erythropoietin production under a high glucose concentration (50 mmol/L) in hiPSC-derived erythropoietin- producing cells. Thus, these data also do not support the clini- cal study-based hypothesis that SGLT2 inhibitors might directly stimulate erythropoietin production in the kidney7,8,24. How- ever, a weak point of the present study was that our in vitro studies with hiPSC-derived erythropoietin-producing cells did not allow an accurate comparison between low- and high-glu- cose levels, because they are not able to exist under conditions where the glucose levels are<25 mmol/L. Further investigation should be carried out using improved hiPSC-derived erythro- poietin-producing cells that can grow under low-glucose condi- tions.
In conclusion, the data from the present study in non-dia- betic CKD model rats with adenine-induced renal anemia failed to support the hypothesis proposed by other investigators7,8,24, based on their clinical studies in patients with diabetes9,10,12,21–
23, that SGLT2 inhibitors directly stimulate erythropoietin pro- duction. Further clinical studies including non-diabetic patients Erythropoietin level
(normalized to vehicle)
Erythropoietin level
(normalized to vehicle with 25 mmol/L glucose) NS
NS
NS NS
* 3.0
1.5
Vehicle 100 nmol/L 500 nmol/L Luseogliflozin (luseo)
FG-4592
Vehicle 100 nmol/L luseo
100 nmol/L luseo 25 mmol/L glucose 50 mmol/L glucose
Vehicle 0.0
1.5
1.0
0.5
0.0 (a)
(b)
Figure 5| Effect of luseogliflozin (luseo) on erythropoietin production in human induced pluripotent stem cell-derived erythropoietin- producing cells. (a) Erythropoietin levels in the culture media after treatment with vehicle, luseogliflozin (100 and 500 nmol/L), or FG-4592 (50µmol/L) in human induced pluripotent stem cell-derived
erythropoietin-producing cells. (b) Effects of luseogliflozin (100 nmol/L) on erythropoietin levels in the culture medium under 25 mmol/L or 50 mmol/L glucose concentrations in human induced pluripotent stem cell-derived erythropoietin-producing cells. *P<0.05, FG-4592 versus control.
with CKD, such as EMPA-KIDNEY and DAPA-CKD, will clarify the issue of whether SGLT2 inhibitors increase hemat- ocrit and Hb levels in non-diabetic CKD patients. The exami- nation of the hematocrit and plasma erythropoietin levels by this clinical trial could reveal whether the previously observed SGLT2 inhibitor-induced increase in the hematocrit is indepen- dent of its blood sugar-lowering effect.
ACKNOWLEDGMENTS
We thank Katie Oakley, PhD, from Edanz Group (www.eda nzediting.com/ac) for editing a draft of this manuscript. This collaborative study was partly supported by Taisho Pharmaceu- ticals Co., Ltd.(to AN). The funders had no role in the study design, data collection and analysis, decision to publish or preparation of the manuscript. This study was also supported in part by the Salt Sciences Foundation (to AN).
DISCLOSURE
AN has received honoraria for educational meetings carried out on behalf of Taisho Co., Ltd. The other authors declare no con- flict of interest.
REFERENCES
1. Gallo LA, Ward MS, Fotheringham AK,et al. Once daily administration of the SGLT2 inhibitor, empagliflozin, attenuates markers of renal fibrosis without improving albuminuria in diabetic db/db mice.Sci Rep2016; 6: 26428.
2. Gembardt F, Bartaun C, Jarzebska N,et al. The SGLT2 inhibitor empagliflozin ameliorates early features of diabetic nephropathy in BTBR ob/ob type 2 diabetic mice with and without hypertension.Am J Physiol Renal Physiol2014; 307:
F317–325.
3. Wanner C, Inzucchi SE, Lachin JM,et al. Empagliflozin and progression of kidney disease in type 2 diabetes.N Engl J Med2016; 375: 323–334.
4. Neal B, Perkovic V, Matthews DR,et al. Rationale, design and baseline characteristics of the CANagliflozin cardioVascular Assessment Study-Renal (CANVAS-R): A randomized, placebo-controlled trial.Diabetes Obes Metab2017; 19: 387–
393.
5. Perkovic V, Jardine MJ, Neal B,et al. Canagliflozin and Renal Outcomes in Type 2 Diabetes and Nephropathy.N Engl J Med2019; 380: 2295–2306.
6. Gilbert RE. Sodium-glucose linked transporter-2 inhibitors:
potential for renoprotection beyond blood glucose lowering?Kidney Int2014; 86: 693–700
7. Sano M, Takei M, Shiraishi Y,et al. Increased hematocrit during sodium-glucose cotransporter 2 inhibitor therapy indicates recovery of tubulointerstitial function in diabetic kidneys.J Clin Med Res2016; 8: 844–847.
8. Sano M, Goto S. Possible mechanism of hematocrit elevation by sodium glucose cotransporter 2 inhibitors and associated beneficial renal and cardiovascular effects.
Circulation2019; 139: 1985–1987.
9. Baker WL, Smyth LR, Riche DM,et al. Effects of sodium- glucose co-transporter 2 inhibitors on blood pressure: a systematic review and meta-analysis.J Am Soc Hypertens 2014; 8(4): 262–275.e9.
10. Inagaki N, Kondo K, Yoshinari T,et al. Efficacy and safety of canagliflozin in Japanese patients with type 2 diabetes: a randomized, double-blind, placebo-controlled, 12-week study.Diabetes Obes Metab2013; 15: 1136–1145.
11. Yale JF, Bakris G, Cariou B,et al. Efficacy and safety of canagliflozin in subjects with type 2 diabetes and chronic kidney disease.Diabetes Obes Metab2013; 15: 463–473.
12. Lambers Heerspink HJ, de Zeeuw D, Wie L,et al.
Dapagliflozin a glucose-regulating drug with diuretic properties in subjects with type 2 diabetes.Diabetes Obes Metab2013; 15: 853–862.
13. Bosman DR, Winkler AS, Marsden JT,et al. Anemia with erythropoietin deficiency occurs early in diabetic nephropathy.Diabetes Care2001; 24: 495–499.
14. Rahman A, Yamazaki D, Sufiun A,et al. A novel approach to adenine-induced chronic kidney disease associated anemia in rodents.PLoS ONE2018; 13: e0192531.
15. Hitomi H, Kasahara T, Katagiri N,et al. Human pluripotent stem cell-derived erythropoietin-producing cells
ameliorate renal anemia in mice.Sci Transl Med2017; 9:
eaaj2300.
16. Rafiq K, Nishiyama A, Konishi Y,et al. Regression of glomerular and tubulointerstitial injuries by dietary salt reduction with combination therapy of angiotensin II receptor blocker and calcium channel blocker in Dahl salt- sensitive rats.PLoS ONE2014; 9: e107853.
17. Nishioka S, Nakano D, Kitada K,et al. The cyclin-dependent kinase inhibitor p21 is essential for the beneficial effects of renal ischemic preconditioning on renal ischemia/
reperfusion injury in mice.Kidney Int2014; 85: 871–879.
18. Liu Y. Cellular and molecular mechanisms of renal fibrosis.
Nat Rev Nephrol2011; 7: 684–696.
19. Nakagawa M, Taniguchi Y, Senda S,et al. A novel efficient feeder-free culture system for the derivation of human induced pluripotent stem cells.Sci Rep2014; 4: 3594.
20. Zhang Y, Nakano D, Guan Y,et al. A sodium-glucose cotransporter 2 inhibitor attenuates renal capillary injury and fibrosis by a vascular endothelial growth factor-dependent pathway after renal injury in mice.Kidney Int2018; 94: 524–
535.
21. Nauck M, del Prato S, Meier JJ,et al. Dapagliflozin versus glipizide as add-on therapy in patients with type 2 diabetes who have inadequate glycemic control with metformin.
Dtsch Med Wochenschr2013; 138(Suppl 1): S6–15.
22. Rosenstock J, Aggarwal N, Polidori D,et al. Dose-ranging effects of canagliflozin, a sodium-glucose cotransporter 2 inhibitor, as add-on to metformin in subjects with type 2 diabetes.Diabetes Care2012; 35: 1232–1238.
23. Wilding JP, Woo V, Soler NG,et al. Long-term efficacy of dapagliflozin in patients with type 2 diabetes mellitus
ª2019 The Authors. Journal of Diabetes Investigation published by AASD and John Wiley & Sons Australia, Ltd J Diabetes Investig Vol.No. 2020 9
O R I G I N A L A R T I C L E
http://wileyonlinelibrary.com/journal/jdi SGLT2 inhibitor in non-diabetic renal anemia
receiving high doses of insulin: a randomized trial.Ann Intern Med2012; 156: 405–415.
24. Mima A. Renal protection by sodium-glucose cotransporter 2 inhibitors and its underlying mechanisms in diabetic kidney disease.J Diabet Complicat2018; 32: 720–725.
25. Yamamoto K, Uchida S, Kitano K,et al. TS-071 is a novel, potent and selective renal sodium-glucose cotransporter 2 (SGLT2) inhibitor with anti-hyperglycaemic activity.Br J Pharmacol2011; 164: 181–191.
26. Kojima N, Williams JM, Takahashi T,et al. Effects of a new SGLT2 inhibitor, luseogliflozin, on diabetic nephropathy in T2DN rats.J Pharmacol Exp Ther2013; 345: 464–472.
27. Vallon V, Rose M, Gerasimova M,et al. Knockout of Na- glucose transporter SGLT2 attenuates hyperglycemia and glomerular hyperfiltration but not kidney growth or injury in diabetes mellitus.Am J Physiol Renal Physiol2013; 304:
F156–167.
28. Vallon V, Gerasimova M, Rose MA,et al. SGLT2 inhibitor empagliflozin reduces renal growth and albuminuria in proportion to hyperglycemia and prevents glomerular hyperfiltration in diabetic Akita mice.Am J Physiol Renal Physiol2014; 306: F194–204.
29. Masuda T, Watanabe Y, Fukuda K,et al. Unmasking a sustained negative effect of SGLT2 inhibition on body fluid volume in the rat.Am J Physiol Renal Physiol2018; 315:
F653–F664.
30. Bailey CJ, Gross JL, Pieters A,et al. Effect of dapagliflozin in patients with type 2 diabetes who have inadequate glycaemic control with metformin: a randomised, double- blind, placebo-controlled trial.Lancet2010; 375: 2223–2233.
31. Kohan DE, Fioretto P, Tang W,et al. Long-term study of patients with type 2 diabetes and moderate renal impairment shows that dapagliflozin reduces weight and blood pressure but does not improve glycemic control.
Kidney Int2014; 85: 962–971.
32. Cherney DZI, Cooper ME, Tikkanen I,et al. Pooled analysis of Phase III trials indicate contrasting influences of renal function on blood pressure, body weight, and HbA1c reductions with empagliflozin.Kidney Int2018; 93: 231–244.
33. Tanaka H, Takano K, Iijima H,et al. Factors affecting canagliflozin-induced transient urine volume increase in patients with type 2 diabetes mellitus.Adv Ther2017; 34:
436–451.
34. Lin B, Koibuchi N, Hasegawa Y,et al. Glycemic control with empagliflozin, a novel selective SGLT2 inhibitor, ameliorates cardiovascular injury and cognitive dysfunction in obese and type 2 diabetic mice.Cardiovasc Diabetol2014; 13: 148.
35. Azushima K, Gurley SB, Coffman TM. Modelling diabetic nephropathy in mice.Nat Rev Nephrol2018; 14: 48–56.
36. Kitada M, Ogura Y, Koya D. Rodent models of diabetic nephropathy: their utility and limitations.Int J Nephrol Renovasc Dis2016; 9: 279–290.