Metropolitan Area Based on Ecosystem Service
著者 Haoying Han, Qiwei Ma, Yonghua Li journal or
publication title
International Review for Spatial Planning and Sustainable Development
volume 5
number 2
page range 4‑16
year 2017‑04‑15
URL http://hdl.handle.net/2297/47852
doi: 10.14246/irspsd.5.2_4
4
DOI: http://dx.doi.org/10.14246/irspsd.5.2_4
Copyright@SPSD Press from 2010, SPSD Press, Kanazawa
Urban Growth Boundaries of the Hangzhou Metropolitan Area Based on Ecosystem Service
Haoying Han
1, Qiwei Ma
1, Yonghua Li
1*
1 Department of Regional and Urban Planning, Zhejiang University
* Corresponding Author, Email: [email protected] Received: Oct 05, 2016; Accepted: Jan 30, 2017
Key words: Urban growth boundaries; ecosystem service; Green Infrastructure Assessment; scenario analysis; Hangzhou
Abstract: The identification of urban growth boundaries (UGBs) as components of an ecologically liveable city is rather significant in urban space management.
However, the evaluation of ecosystem service in establishing UGBs as reactions to protect open spaces and ecological sensitive area are largely ignored. Furthermore, the lack of scenario analysis for urban growth patterns has made it difficult to adjust planning existed. Accordingly, in this paper, we take Hangzhou metropolitan areas (HMA) as the study area, using Landsat TM image data, and established the UGBs for the HMA based on ecosystem service by the Green Infrastructure Assessment (GIA) model with scenario analysis. The results suggested that: 1) The risk of urban development in the northern and eastern areas of the central city is relatively low, while the southern, eastern and south-western areas need intensive protection; 2) In the model of ecological management, the erosion of ecological space has increased gradually and the regional ecological patterns in the fourth scenarios have faced great challenges; 3) UGBs for the HMA were identified as the view of development and ecological space complementarily.
1. INTRODUCTION
The most severe challenges in the current process of urban development are the big gaps between land supply and demand and the deterioration of ecological environment, both of which are mainly caused by rapid urban sprawl that occurs globally, especially in developing countries. Since the reform and opening-up in China from 1978, a series of system reforms are effectively stimulating the economic growth and urbanization, including the socialist market economy (1992), land use system (1988) and tax sharing system (1993), which has made a profound influence on urban growth (Chen
& Zhao, 2016). In this process, urban growth is gradually becoming out of
control in the way of sprawl and construction expansion (Wei, 2011).As we
know, urban growth containment strategies that are supported by the smart
growth approaches including urban growth boundaries (UGBs) are the best-
known planning instruments and effective tools to contain, control, direct or
control, direct or phase urban growth coping with the rapid sprawl of cities
(Liu, 2005). Actually, UGBs is widely implemented in western countries especially in the USA while in China reversely.
As for the method of UGBs delimitation, few studies focus on the evaluations of their functions in protecting open spaces as reactions to the challenge of declining ecological environment. That is to say, the evaluation of ecosystem service in delimiting UGBs as reactions to protect open spaces and ecological sensitive area are largely ignored (Verburg et al., 2002;
Tayyebi, Pijanowski, & Pekin, 2011; Arsanjani, Kainz, & Mousivand, 2011;
Long et al., 2013; Zhang, Hua, & Wang, 2016). On the other hand, in most literatures and discussions are emphasized on the failure to promote compact development due to the inability to take complexity, uncertainty, and ongoing changes into account (Long et al., 2015). Furthermore, the lack of scenario analysis for urban growth patterns has made it difficult to adjust planning existed.
Therefore, in the present paper, the Green Infrastructure Assessment (GIA) model that considers ecosystem service for regional ecological security pattern is developed to simulate future urban growth and then establish the UGBs for the Hangzhou Metropolitan Area (HMA).The “Study area and data” section introduces generalizations of Hangzhou and the data we using in this study. The “Approaches” and “Results and analysis”
sections show how to use the GIA model to establish the UGBs for the HMA. The “Conclusion and discussion” section presents and concludes our findings.
2. STUDY AREA AND DATA
Hangzhou is located in the northern of Zhejiang province as one of central cities in the Yangtze River delta, and the other cities like Shanghai, Nanjing. Hangzhou is also famous as a historical and tourist city with world cultural heritages of West Lake and Beijing-Hangzhou Grand Canal. What’s more, Hangzhou is not only the economic, financial and cultural central city in Zhejiang province, but also is the host city of G20summit in2016.In terms of ecological environment, there have complex landforms and different kinds of habitat patches that urban ecosystem service has a very high heterogeneity with various landscape elements of forest, wetland, river and farmland (Li, 2011).
However, with the background of reform and opening-up in China, Hangzhou was experiencing a rapid urbanization because of the GDP and urban population growth within 2000 to 2015.In the one hand, the GDP in 2000 was 1382.56 billion CNY while the GDP in 2015 had quickly increased to 9206.16 billion CNY, which is about seven times than former.
At the same time, the fast expansion of construction lands in the way of
urban sprawl accompanying by high economic development has lead to a
series of intractable problems, of which farmland shrinking and ecological
environment fragmentation are the most remarkable issues that will further
to make severe pressures on regional ecological security pattern in
Hangzhou. Thus, it’s rather necessary for Hangzhou to put urban growth
management into effect for the purpose of protecting open spaces and some
environmental sensitive area from ecological declining. Meanwhile, by the
way of establishing UGBs that has not been widely implemented in China
though, we can direct or control urban spatial structure sustainably. In this
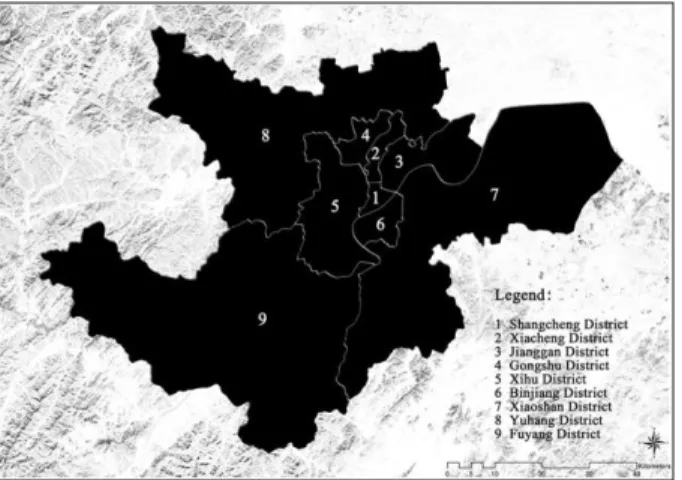
study, we take Hangzhou metropolitan areas (HMA) as the study area. HMA
is an area of 4899km
2, including Shangcheng districts, Xiacheng districts,
Jianggan districts, Gongshu districts, Xihu districts, Binjiang districts, Xiaoshan districts, Yuhang districts and Fuyang districts (Figure 1).
The date we using in this study mainly contain three aspects:
1) Remote sensing image like the type of Landsat TM image date covering the area of HMA is largely needed. The image date with the resolution of 30*30m can be freely downloaded from Geospatial Date Cloud (GDC), which is built by Chinese Academy of Sciences. And the track number of the image data collected on Aug 16th, 2015 is (119, 39).
However, to improve the identification precision of data, those original images should be pre-treated correctly. The procedures are atmospheric correction, geometric correction, image cutting and others needed.
2) Digital elevations model (DEM) data in the HMA will be used to describe the features of topography, such as the land slope or Relief degree landform surface (RDLS). In addition, administrative boundaries data from digital or paper map should be coincide with study area of HMA according to the digital or paper map. Lastly, some related social-economic statistical data for construction lands, industry or urban population since 2000also are incorporated essentially. Those statistical data can be easily accessed from the website of Hangzhou Statistical Information (http://www.hzstats.gov.cn/) build by Hangzhou government.
3) Planning made by local government or superior government, such as Hangzhou master planning (2001-2020) or Hangzhou land use planning (2006-2020) for construction lands, urban spatial structure, open space and reverse planning are also necessary. Those planning will be collectively served as to adjust with UGBs, which will be established by the model of Green Infrastructure Assessment.
Figure 1. Study area
3. APPROACHES
3.1 Interpretation of land use
Obviously, the accurate interpretation of land use for the HMA is the
fundamental step for ecological service evaluation. According to the study
purpose and scale size of the HMA, we take the land use classification
standard, which is published publicly by Ministry of Land and Resources in
PRC as authoritative reference. The implications of land use are as
following. The Urban-rural construction land is comprised of urban-town
construction lands, agricultural settlements, industry lands, railway, highway
and airport. Secondly, rivers, lakes and wetlands are attributed to the water.
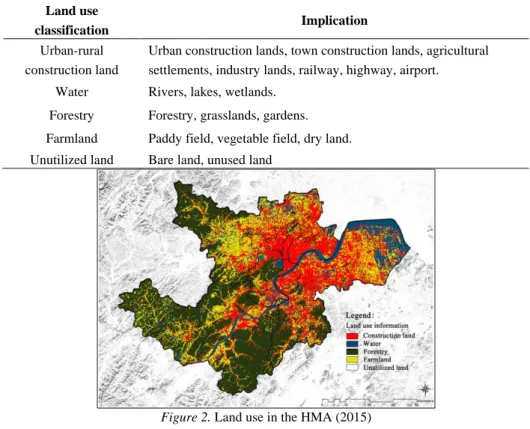
Forestry, grasslands and gardens are regarded as the forestry. Paddy field, vegetable field and dry land are considered as the farmland. And the unutilized land includes bare land and unused land. Finally, the land use classification of this study has been defined as five types: urban-rural construction land, water, forestry, farmland and unutilized land (Table 1).
Based on this, the corrected image data was interpreted by the method of maximum likelihood with the platform of RS. Certainly, the initial interpretation results couldn’t be used to do next step immediately. By calculating separating degree and comparing image data that over the same period with the present situation, we considered that the interpretation errors were mainly caused by confusion of construction land with wetland and cloud covering. Finally, the Kappa coefficient of land use interpretation was reduced to 92.60%, so as to satisfy the accurate requirement basically after doing effective artificial corrections (Figure 2).
Table 1. Land use classification and its implication Land use
classification Implication
Urban-rural construction land
Urban construction lands, town construction lands, agricultural settlements, industry lands, railway, highway, airport.
Water Rivers, lakes, wetlands.
Forestry Forestry, grasslands, gardens.
Farmland Paddy field, vegetable field, dry land.
Unutilized land Bare land, unused land
Figure 2. Land use in the HMA (2015)
3.2 Green Infrastructure Assessment
3.2.1 Identification of GI core area
As an important part of urban social-ecosystem, green infrastructure (GI) is approximate to the green networks system but not entirely.GI resources are organically formed by natural or restored ecological space and those ecological spaces always have a significant characteristic of nature. GI also will provide a variety of ecological service for citizens continually (Benedict
& McMahon, 2012). In this study, we think that GI resources are composed
of two parts (Fu & Wu, 2009). The first part is the vector level, including
terrestrial and aquatic patch, which is defined as GI core area (Table 2).The
second part is the grid level, which is defined as land resources.
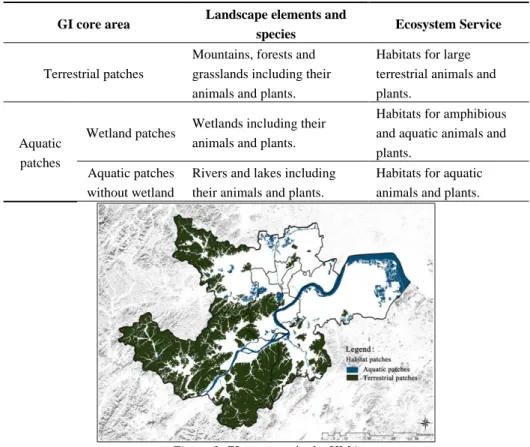
In terms of GI core area, the landscape elements of terrestrial patches that will pointedly provide habitats for some large terrestrial animals and plants are mountains, forests and grasslands. Secondly, the landscape elements of aquatic patches that will pointedly provide habitats for amphibious and aquatic animals and plants are wetlands, rivers and lakes. In addition, as for the size threshold of GI core area, we suggest that the threshold of aquatic patches should be more than 100ha, and the threshold of terrestrial patches should be more than 80ha. Because it will be able to make a significant influence on ecosystem diversity conservation substantially according to the Maryland’s Green Print Plan (Weber et al., 2004).Moreover, to identify GI core area accurately, it is essential to combine some same or similar GI core areas with a certain of heterogeneity that also can be feasible on the platform of ArcGIS. Based on this, the spatial distribution of GI core area in the HMA has been shown on Figure 3.
Table 2.Classification of GI core area
GI core area Landscape elements and
species Ecosystem Service
Terrestrial patches
Mountains, forests and grasslands including their animals and plants.
Habitats for large terrestrial animals and plants.
Aquatic patches
Wetland patches Wetlands including their animals and plants.
Habitats for amphibious and aquatic animals and plants.
Aquatic patches without wetland
Rivers and lakes including their animals and plants.
Habitats for aquatic animals and plants.
Figure 3. GI core area in the HMA
3.2.2 Ecosystem service evaluation of GI resources
Since the paper that is about the global ecosystem service value written
by the scientists of Maryland University was published on the journal of
Nature, the evaluation of ecological service value has become a hot issue in
the study of resource environmental economics and ecological economics. It
is the conditions and utilities of ecological environment are beneficial for
human settlements under ecosystem and its processing that we name as
ecological service (Ouyang & Wang, 2000). Urban ecosystems provide vital
services for urban dwellers (McDonald & Marcotullio, 2011). It is
increasingly recognized that ecosystem services need to be incorporated into
urban planning (Colding, 2011). Although, the concept of GI has emerged as
a way to secure the provisioning of ecosystem services in human-dominated landscapes (Colding, 2011). At the same time, GI resources may differ in many aspects of morphology, terrain and location. In this paper, we consider that GI delivers measurable ecosystem services and benefits that are fundamental to the concept of the ecosystem conservation, which will be evaluated with certain of priority by the model of Green Infrastructure Assessment (GIA).
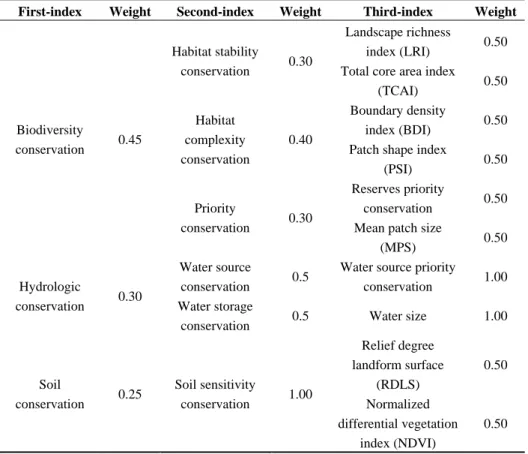
Based on abundant empirical evidence and existing literature (Li, 2011), we had tried building the index framework for GIA as following. Firstly, biodiversity, hydrologic and soil conservation are so important for ecosystem service evaluation that has been considerate as first-index for GI resources at vector level. Based on this, the second-index and the third-index are formed successively (Table 3). Secondly, we select the characteristics and location of land resources as first-index for GI resources at grid level.
The second indexes contain land use, land slope, Normalized differential vegetation index (NDVI), distance of reserves and distance of GI core area (Table 4). What’s more, the determination of weight mainly depended on the judgment of relevant experts and the method of Analytic hierarchy process (AHP).
Table 3. Ecosystem service evaluation indexes of GI resources at vector level
First-index Weight Second-index Weight Third-index Weight
Biodiversity
conservation 0.45
Habitat stability
conservation 0.30
Landscape richness
index (LRI) 0.50 Total core area index
(TCAI) 0.50
Habitat complexity conservation
0.40
Boundary density
index (BDI) 0.50 Patch shape index
(PSI) 0.50
Priority
conservation 0.30
Reserves priority
conservation 0.50 Mean patch size
(MPS) 0.50
Hydrologic
conservation 0.30
Water source
conservation 0.5 Water source priority
conservation 1.00 Water storage
conservation 0.5 Water size 1.00
Soil
conservation 0.25 Soil sensitivity
conservation 1.00
Relief degree landform surface
(RDLS)
0.50
Normalized differential vegetation
index (NDVI)
0.50
Table 4. Ecosystem service evaluation indexes system of GI resource at grid level
First-index Weight Second-index Weight
Characteristics of land
resources 0.70
Land use 0.50
Land slope 0.20
Normalized differential vegetation
index (NDVI) 0.30
Location of land resources 0.30 Distance of reserves (unit: m) 0.50 Distance of GI core area 0.50
4. RESULTS AND ANALYSIS 4.1 Analysis of GIA results
According to the Table 2 and Table 3, we got the results of ecosystem service evaluation in the HMA, including GI core area at vector level and land resources at grid level (Fig.4). Then we overlapped GI core area at vector level with land resources at grid level to achieve the final result of ecosystem service evaluation in the HMA (Figure 5).
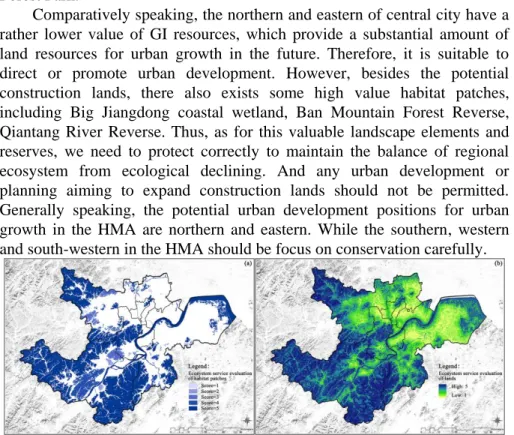
From the view of geographical location, the southern, western and south-western of central city in the HMA have a very high value of GI resources and abundant species corridors, including a large number of landscape elements, such as mountains, wetlands, gardens. Therefore, it is unsuitable for urban development in the way of urban sprawl or enclave leading to a rather high risk. For example, the ecological space of south- western Fuyang is located in the southern of central city and the southern of Yuhang town, which includes a large area of mountains and forest supplemented by arable land, tea plantations, orchards and a small number of wetlands. The reverses here contain West Lake National Scenic Area, Zhijiang National Tourist Resort, Gudang and Laohe Mountain Ancient Tombs Areas, Zhongtai and Xianlin Forest Reverse, Longwu Forest Reverse, Huang Gongwang Provincial Forest Park and Yinming Mountain Provincial Forest Park.
Comparatively speaking, the northern and eastern of central city have a rather lower value of GI resources, which provide a substantial amount of land resources for urban growth in the future. Therefore, it is suitable to direct or promote urban development. However, besides the potential construction lands, there also exists some high value habitat patches, including Big Jiangdong coastal wetland, Ban Mountain Forest Reverse, Qiantang River Reverse. Thus, as for this valuable landscape elements and reserves, we need to protect correctly to maintain the balance of regional ecosystem from ecological declining. And any urban development or planning aiming to expand construction lands should not be permitted.
Generally speaking, the potential urban development positions for urban growth in the HMA are northern and eastern. While the southern, western and south-western in the HMA should be focus on conservation carefully.
Figure 4. Ecosystem service evaluation of GI core area at vector level (a) and land resources at grid level (b) in the HMA
Figure 5. Ecosystem service evaluation in the HMA
4.2 Analysis of ecological management scenarios
Scenario analysis is an important tool for urban planning decision- making or urban growth policies formulating. In scenario model, we always should take some important impact factors that will make influences on planning results into the analysis processing compared with urban problems existed, and then make a try to simulate the future scenarios under difference of urban spatial structure. Using this method, we can evaluate the planning implemented or not, then to put forward a new strategy, planning or action plan for urban growth. Consequently, scenario planning may be a good choice to cope with urban growth when facing uncertainties or unpredicted planning conditions.
In this study, we take the study of urban development boundaries in the HMA, which have been delimited by local planning authorizes as urban development reference (Zhang, Hua, & Wang, 2016). So we defined the 50% and 20%of the study area as construction lands limit for urban growth in future. We set 20% construction lands of study area is that to ensure the regional ecosystem security pattern in the HMA avoiding environmental problems caused by violent urban growth. While we set 50% construction lands of study area is to coordinate with local government’s planning goals including economic development. And the ecological management scenario between 20% and 50% is 30% and 40% with every 10%interval. Based on the result of ecosystem service evaluation in the HMA, we finally got the ecological management scenarios respectively, including their ecological conservation propriety of GI resources, area size and spatial distributions of potential construction lands (Table 5, Figure 6). In all, we consider that there is a negative correlation between ecological conservation priority and conservation area size, while there is a positive correlation between ecological conservation priority and construction lands area size. Secondly, in the model of ecological management, the erosion of ecological space has increased gradually from first-control to fourth-control scenarios while the regional ecological patterns in the forth scenarios has faced great challenges.
Table 5. Analysis of ecological management scenarios Ecological
control scenarios
Ecological conservation
priority
Control area size
Conservation area size Construction lands area size
First-Control 1~2 Total area size is Total area size is
3919.20km2, accounting for the study area of 80%.
979.80km2, accounting for the study area of 20%.
Second-
Control 2~3
Total area size is 3429.30km2, accounting for the study area of 70%.
Total area size is 1459.70km2, accounting for the study area of 30%.
Third-Control 3~4
Total area size is 2939.40km2, accounting for the study area of 60%.
Total area size is 1959.60km2, accounting for the study area of 40%.
Fourth-
Control 4~5
Total area size is 2449.50km2, accounting for the study area of 50%.
Total area size is 2449.50km2, accounting for the study area of 50%.
Figure 6. Spatial distribution of ecological management scenarios
5. ESTABLISHMENT OF UGBS 5.1 Urban growth scenario in 2040
According to the Figure 6 and analysis of ecological control scenarios that how will affect regional ecosystem security pattern, we finally decided to choose the third-control as the urban growth scenarios to establish UGBs of the HMA in 2040.The urban growth form delimited in the raster format can be converted into a vector format comprised of some polygons. And those polygons with low compactness and a small area should be eliminated (<1ha), as they are not feasible for urban development. The remaining polygons then can be regard as urban growth area for UGBs of the HMA.
And the spatial distribution of urban growth has shown on the Figure 7 (a).
To a certain extent, the third-control urban growth pattern not only can maintain the regional ecosystem service from the point of ecological rigid view, but also coordinate with the economic development goals set by local government to the maximum extent.
According to the Figure 7, (a), the urban growth form consists of some
polygons, of which the biggest polygons are on the both sides of Qiantang
River. One is on the north of Qiantang River, including Shangcheng
districts, Jianggan districts, Gongshu districts, Yuhang district and some area of Xihu district. Another one is on the south of Qiantang River, including Xiaoshan districts and Binjiang district. These urban growth scenarios can be achieved to the pattern of compact city with a continuous development. And the form of urban growth is more likely to the UGBs in the USA. Besides the two polygons, the leaving polygons are mainly on the western of central city, and the vast majority of polygons are in Fuyang district except Zhijiang National Tourist Resort. These urban growth scenarios can be achieved to the pattern of decentralized city with a group development, which is quite suitable for mountain-city. In other words, it is inevitable decision-making due to the high sensitive environment in the west part of HMA. In terms of the land supply in the future, total area of urban growth scenario is about 1959.60km
2,accounting for the study area of 40%, which is about two-and-a- half times as the present.
Figure 7. Urban growth scenario in 2040
5.2 UGBs as the development space to direct urban growth
Obviously, the UGBs in most metropolitan area in China are not only one or two polygons but may comprise numerous polygons, and UGBs of the HMA also contain town construction lands and agricultural settlements besides urban construction lands, which is quite different from UGBs in the USA. In order to make clear that the urban spatial and economical connection between cities, new cities and towns, we decided to overlapped the urban growth scenario in 2040 with the administrative boundaries of urban area to establish the UGBs of the HMA. By this way, the spatial distributions of UGBs have been shown on the Figure 7, (b).
Although the urban spatial structure has been planned in the Hangzhou Master Planning (2001-2020) clearly, including one central city (old urban districts of Hangzhou), three new city (Linping, Xiasha and Jiangnan new city) and six towns (Linpu, Yipeng, Guali, Yuhang, Liangzhu and Tangqi town).In addition, Fuyang district has also been taken into consideration.
According to the UGBs set by GIA model, we suggest that the urban spatial
structure should be updated to respond to the new situations of Hangzhou,
such as G20 and electric business industry. Especially in Fuyang, it is
necessary not only to promote the Fuyang city as new city level, but
Xindeng town and Changkou town should be added up to the new urban
spatial structure system as town level to compete in functional division of
Hangzhou. Consequently, the urban spatial structure of the HMA will become a new pattern with one central city, four new cities and eight towns.
In terms of the land supply of UGBs, we calculated the development area provided of every district set by UGBs and the current construction lands area simultaneously (Table 6). The UGBs in Fuyang district will be counted alone, as it was not belong to HMA urban district before 2015.Comparatively, the land supply of town level is the most abundant with increment speed of 98.76%, while the central city is rather limited with increment speed of 15.36%. Thus, it is advised that town and new city should be encouraged to accommodate more urban industry and population escaping from the central city by local government. Notably, because of the sensitive environment, the land supplements of Fuyang districts are constrained, even are less than central city.
Table 6. UGB areas of central city, new cities and towns in the HMA (unit: km2)
Name A: Current
construction lands
B: Development area set
by UGBs A-B (A-B) / A
(%)
Central city 252.80 291.64 38.84 15.36
New cities 263.32 358.12 94.80 36.00
Towns 254.77 506.39 251.62 98.76
Fuyang 136.71 150.51 13.80 10.09
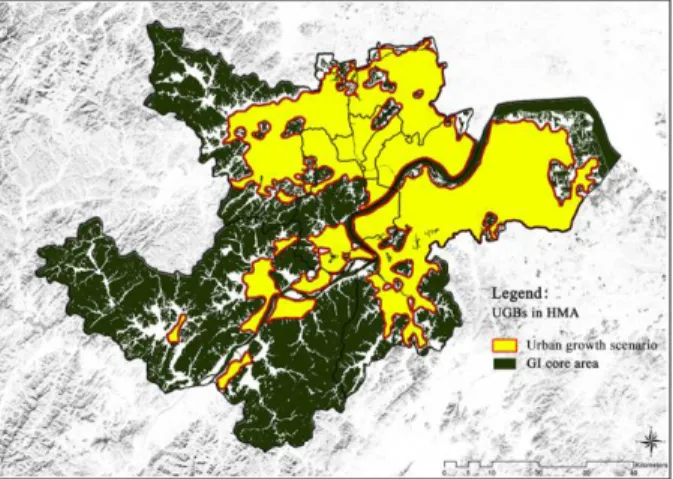
5.3 UGBs as the ecological space to conjugate urban growth
From another perspective, UGBs can also be considered as the ecological space getting rid of the construction lands to control or conjugate urban growth. The area of ecological space in the HMA is about 2939.40km
2, accounting for the study area of 60%.Therefore, we can also defined UGBs as ecological space named as Ecological Belts (EB). The EB consists of two parts: one is the restricted construction area; another is forbidden zone (GI core area).
In this study, we can take the Northern Linpin EB (NL-EB) and Southern Linpu EB (SL-EB) as examples:
1) Northern Linpin EB is located in the north of central city and the south and west of Linpin city, including Yuhang district and Jianggan district. The landscape composition of it is farmland, forest, canal waters and wetland. In addition, NL-EB contains Chongxian, Tangxi and Jianqiao town- village, including Chao Mountain Provincial Scenic Area, Mid-ancient Tombs and Liangzhu Culture Site, Ding Mountain Lake, East Pond Wetland Protection Area, Gaoting Hill, Hwanghak Mountain Scenic Area, Pengbu Transportation Corridors and Linpin Hill Ecological Conservation.
2) For another one, Southern Linpu is located in the south of central city
and Jiangnan City, including Linpu town, Xiaoshan district and Fuyang
district. The landscape composition of it is mountains, forest, farmland and
Xiang lake and Bama Lake. In addition, SL-EB contains Heshang, Louta and
Longmeng town-village, including Qinghua Mountain Reverse, Mujian
Mountain Reverse, Shiniu Mountain Reverse, Xianghu Tourist Resort,
Longmen Forest Provincial Reverse.
Figure 8. UGBs for the HMA
6. CONCLUSION AND DISCUSSION
The identification of UGBs as components of an ecologically liveable city is important in urban space management. However, the evaluation of ecosystem service in delimiting UGBs as reactions to protect open spaces and ecological sensitive area are largely ignored. Furthermore, the lack of scenario analysis for urban growth patterns has made it difficult to adjust planning existed. This paper take HMA as the study area, using Landsat TM image data, and delimited UGBs based on ecosystem service by the model of GIA with scenario analysis. According to the result of GIA, we conclude that the risk of urban development in the northern and eastern areas of the central city in the HMA is relatively low, while the southern, eastern and south-western areas need intensive protection. In addition, in the model of ecological management, the erosion of ecological space has increased gradually and the regional ecological patterns in the forth scenarios have faced great challenges.
A case study in the HMA demonstrates that the UGBs could be established by GIA model. And we respectively defined UGB as the development space to direct urban growth and the ecological space to conjugate urban growth. In contrast to the conventional UGBs delimitation methods employed by planner with background in architecture, the GIA model makes a more stress on the ecosystem service, which is significant in urban growth management. Through maintaining regional ecological security pattern further to control the urban growth with sprawl or enclave reversely. At the same time, this paper proves that using a GIA model can provide the Chinese theoretical and technical support for establishing and improving UGBs in Chinese cities or metropolitan areas.
However, for the future studies, much remains to be explored deeply. For
example, the ecosystem service evaluation indexes of GI resources need to
be further corrected for different regions in HMA. Secondly, the hubs of GI
core area just contain habitat patches as the view of ecology, and some
humanistic elements such as historic conservation area or scenic area are not
included. What’s more, the ecological control scenarios set in this paper is
not enough, so applying GIA model to simulate different growth scenarios
based on other urban development strategies is necessary. Through the
analysis and comparison of different scenarios, a preferable scenario can be
selected as the recommended UGBs and the corresponding policy package
for decision-making by local government.
ACKNOWLEDGEMENTS
We are grateful for the financial support of the Nation Natural Science Foundation of China (No. 51578483 and No.51278526).
REFERENCES
Arsanjani, J. J., Kainz, W., & Mousivand, A. J. (2011). "Tracking Dynamic Land-Use Change Using Spatially Explicit Markov Chain Based on Cellular Automata: The Case of Tehran".
International Journal of Image and Data Fusion, 2(4), 329-345.
Benedict, M. A., & McMahon, E. T. (2012). Green Infrastructure: Linking Landscapes and Communities. Washington D.C.: Island Press.
Chen, X., & Zhao, M. (2016). "Mechanisms for Economic Growth and Urbanization, and Transformation Strategies under the New Normal: Theoretical Analysis and Empirical Inference". City Planning Review, 16(1), 9-18.
Colding, J. (2011). The Role of Ecosystem Services in Contemporary Urban Planning.
Oxford: Oxford University Press.
Fu, X.-E., & Wu, R.-W. (2009). "Introduction to Green Infrastructure Assessment (Gia)-a Case Study of Maryland, USA". Chinese Landscape Architecture, (9), 41-45.
Li, Y. (2011). "Method of Determining Urban Growth Boundary from the View of Ecology:
A Case Study of Hangzhou". City Planning Review, (12), 83-90.
Liu, H.-L. (2005). "From Sprawl toward Smart Growth: Remarks on Urban Growth Boundary Concept of USA and Its Significance". Urban Problems, (3), 67-72.
Long, Y., Han, H., Lai, S.-K., & Mao, Q. (2013). "Urban Growth Boundaries of the Beijing Metropolitan Area: Comparison of Simulation and Artwork". Cities, 31, 337-348.
Long, Y., Han, H., Tu, Y., & Shu, X. (2015). "Evaluating the Effectiveness of Urban Growth Boundaries Using Human Mobility and Activity Records". Cities, 46, 76-84.
McDonald, R., & Marcotullio, P. (2011). Global Effects of Urbanization on Ecosystem Services. Oxford: Oxford University Press.
Ouyang, R., & Wang, Z. (2000). "Ecosystem Services and Their Economic Valuation".
Chinese Journal of Applied Ecology, 10(5), 635-640.
Tayyebi, A., Pijanowski, B. C., & Pekin, B. (2011). "Two Rule-Based Urban Growth Boundary Models Applied to the Tehran Metropolitan Area, Iran". Applied geography, 31(3), 908-918.
Verburg, P., Soepboer, W., Limpiada, R., Espaldon, M., Sharifa, M., & Veldkamp, A. (2002).
"Land Use Change Modelling at the Regional Scale: The Clue-S Model". Environmental Management, 30(3), 391-405.
Weber, T., Wolf, J., Blank, P., Aviram, R., & Lister, J. (2004). "Restoration Targeting in Maryland's Green Infrastructure". Retrieved from Landscape and Watershed Analysis Division, Maryland Department of Natural Resources, Annapolis, MD.
Wei, Y. (2011). "Building Local Spatial Growth-Management System in China through Regulatory Detailed Planning". City Planning Review, (2), 13-14.
Zhang, Q., Hua, F., & Wang, S. (2016). "A Study on the Delimitation and Implementation of Urban Development Boundary in Hangzhou". Urban Planning Forum, (1), 28-36.