Urban Accessibility based Planning Support for Low Carbon Transport Development in Kathmandu
著者 Shrestha Rehana, Zuidgeest Mark, Flacke Johannes, Bakker Stefan
journal or
publication title
International Review for Spatial Planning and Sustainable Development
volume 1
number 2
page range 25‑46
year 2013‑01‑01
URL http://hdl.handle.net/2297/34406
25
International review for spatial planning and sustainable development, Vol.1.2(2013), 25-45 ISSN: 2187-3666 (online)
http://hdl.handle.net/2297/32453?locale=en
Copyright@SPSD Press from 2010, SPSD Press, Kanazawa
Paving the Pathway for Low Carbon Development
Urban Accessibility based Planning Support for Low Carbon Transport Development in Kathmandu
Rehana Shrestha
1*, Mark Zuidgeest
1, Johannes Flacke
1and Stefan Bakker
11 Faculty of Geo-Information Science and Earth Observation of the University of Twente, The Netherlands
*Corresponding author: email: [email protected]
Key words: low carbon development, low carbon development in transport, planning support system, urban accessibility, Kathmandu Metropolitan City
Abstract: The concept of ‘low carbon development’ (LCD) emerged from the concerns of developing countries on development policy and climate change rather than climate change alone. As the transport sector in most developing countries is unsustainable, ‘low carbon development in transport’ (LCDT) plans should address approaches to reduce emissions from transport, while maintaining or improving transport, as a catalyser of development. LCDT, as such, may pave a pathway towards LCD. Due to the complexity and uncertainty involved in long-term planning tasks, scenario-based planning support systems (PSS) have been regarded as useful tools for exploring future impacts of any kind of plans and policies. Thus, this paper aims at developing an urban accessibility based PSS for evaluating different scenarios of LCDT plans regarding their potential towards low carbon transport development in Kathmandu Metropolitan City (KMC).
This modelling framework combines an accessibility analysis and Activity- Structure-Intensity-Fuel (ASIF) framework in a GIS-based modelling platform. Based on interviews with government officials and documents of the Kathmandu Sustainable Urban Transport (KSUT) project, three plans were identified as qualifying for LCDT plans and were evaluated under high and low population growth scenarios. The evaluation shows that there could be an increase in accessibility along with emissions reduction gains for the current public transport (PT) improvement plan as well as for a plan of expanding the number of trolley buses in the PT vehicle fleet, under assumptions of a low population growth scenario. The trolley bus renewal plan can also lead to emissions reduction, but at the expense of accessibility. However, emissions would still be high against the base year for all the plans in the high population growth scenario. Performing a sensitivity analysis, it was concluded that penetration of trolley bus in the vehicle fleet has a great potential towards LCD. The results show that a shift from private to public transport is necessary in all the LCDT plans to realize a LCD in transport.
1. INTRODUCTION
1.1 Low Carbon Development and Low Carbon Transport as a climate change mitigation strategy
Under the United Nation Framework Convention on Climate Change (UNFCCC) and the Kyoto Protocol, developed countries are required to support mitigation actions and adaptation to climate change in developing countries. Though climate change needs to be addressed by both developing and developed countries, it is being overlooked mostly in developing countries due to their urgent need to give preferences to development activities (Halsnæs & Verhagen, 2007). Therefore, the notions of ‘low carbon development (LCD) and low carbon development strategy (LCDS)’
have appeared as new concepts in the arena of climate change since 2009.
Finally they were adopted into the Copenhagen Accord and Cancun Agreements as ‘low-emission development strategy’ (Tilburg et al., 2011).
The 2011 Durban Climate Conference, COP17, has restated the importance and potential of LCDS to take national climate change policy and development policy together in a co-ordinated manner (UNFCCC, 2011).
Many authors, organizations and countries have their own interpretation regarding the definition and the concept on LCD. However, Yuan et al.
(2011) have to some extent summarized the various concepts on LCD into a common understanding; three components for LCD are: reducing CO
2emissions, intensive use of low-carbon energy and ensuring economic growth. Tilburg et al. (2011) define ‘low carbon’ as reducing emissions trajectory below business as usual (BAU), and further argue that LCD explicitly reconciles the mitigation and development priorities of the country. LCD can be pursued in any sector including industry, agriculture, households and transport.
According to the International Energy Agency (IEA), the transport sector accounted for 26% of world’s energy use and 23% of energy-related GHG emissions in 2004 (IPCC, 2007). Moreover, in transport, emissions are rising at the highest rate of all sectors. This has been accounted to rapid economic growth, urbanization and motorization that are happening at an alarming rate in most developing countries. As reported by ADB (2011), rising incomes, urban expansion and dispersion of activities have increased the demand for and dependence on motorized transportation with rates doubling every 5 to 7 years for Asian countries. Though motorization is perceived as a headway towards development, manifested problems as described by Dimitriou (1992), such as air pollution, congestion, accidents, GHG emissions and increased marginalization of urban poor ultimately lead to inhibition of sustainable development (Dimitriou & Gakenheimer, 2011).
Thus, following concerns about this dilemma, the concept of sustainable low carbon transport has emerged, which explicitly addresses sustainability priorities, while mitigating GHG emissions (Sakamoto et al., 2010).
The avoid-shift-improve (ASI) strategy of (Dalkmann & Brannigan,
2007) can be taken as a potential strategy for developing cities towards low
carbon transport. The ASI strategy has created a new paradigm in the field
of transport, which helps nations to deal with unsustainable transport and
GHG emissions. Thus, this study has regarded low carbon development in
transport (LCDT) plans as a response that can avoid or reduce travel, can
encourage shift to more sustainable and environmentally friendly modes or
that can improve the energy and carbon efficiency of modes, while maintaining development and economic growth.
Dalkmann & Brannigan (2007) have further categorized different policy instruments under each strategy (avoid, shift, improve) into five groups namely planning, regulatory, economic, information and technological. In addition, Dhakal (2006) discusses the ‘rebound effect’, the positive impact of a policy measure alone is often partly offset by its negative impact, e.g.
increase in total travel as a result of lower fuel costs from more efficient vehicles. Therefore, to realise substantial reduction in CO
2emissions, it has been argued that the effectiveness of a package of policy instruments will be greater as compared to a single instrument.
1.2 Development and accessibility
In the past, transport plans were usually geared towards increasing mobility (Geurs & Ritsema van Eck, 2001). But concerns over sustainability, i.e. a balance of economic, social and environmental goals, have led to adoption of the concept of accessibility as a performance indicator for sustainable development (Ha, 2011). Further referring to Amartya Sen’s capability approach (Sen, 2002), this study has considered accessibility as an enabler for enhancing the capabilities of people to reach a wide number of opportunities such as employment, education, and thus help to stimulate economic development. Several studies have used the concept of ‘accessibility to employment’ for assessing and valuing the benefits of proposed land use and transport plans and policies on economic development of people since employment is the source of income (Bertolini et al., 2005; Cervero & Kockelman, 1997). Following the contribution of Sen’s capability approach (Sen, 2002), there is an increasing body of literature that advocates the need to broaden the perspective of looking over the development of a country as improvement in all dimensions of human needs such as health, education instead of growth per capita income only (Mazumdar, 2003; Saito, 2003). Hoffman (2006) has further emphasized access to education and equitable access to education as basic foundation for developing other capabilities for human development.
Thus, following a wider horizon of development, this research has considered physical accessibility to education as an enabler for the young generation to develop capabilities and hence contribute in the further economic development of the country.
1.3 Planning Support Systems
The formulation of spatial plans and policies has always been a complex process. Planning support systems (PSS) can be valuable geo-technological tools enabling planners to handle the complexity of planning processes by evaluating alternatives within future scenarios integrating social, economic and environmental aspects (Geertman & Stillwell, 2009; Hickman &
Banister, 2007; Pettit, 2005). Albeit, there is consensus on the use of PSS in the appraisal of transport policies and plans for exploring their impact in the long run, a research gap still exists on its use in evaluating the impact of LCDT plans on urban accessibility and hence their contribution in strengthening LCD.
Thus, this research attempts to fill in the aforementioned gap by
addressing these two questions: how are urban accessibility and LCDT
related and how to develop a PSS to derive and evaluate accessibility of existing LCDT plans under certain growth scenarios for the case of Kathmandu Metropolitan City (KMC).
2. STUDY AREA
2.1 Kathmandu Metropolitan City at a glance
Kathmandu Metropolitan City (KMC), covering about 50.6 km
2, is the largest metropolitan area and capital city of Nepal, in South Asia. Among five cities comprising the Kathmandu Valley (figure 1), KMC is the largest urban agglomerate in the country and is home to approximately 20% of the total urban population. According to Central Bureau of Statistics (CBS) the total population of KMC was 671,846 in 2001 (KMC, 2013) whereas it has risen to 975,453 in 2011 (CBS, 2012). Apart from being the capital city, KMC is the headquarter of the Central Development Region, which constitutes three zones, namely, Bagmati, Narayani and Janakpur. The city itself is located in Bagmati Zone and consists of 35 wards.
2.2 Transport challenges in KMC
Urban growth or urbanization is usually associated with environmental problems. Based on interviews with stakeholders from the government sector, academic institutions and private sector working in the field of transport, the following factors, which have a negative impact on one or more dimensions of sustainable transport in KMC, have been listed.
With urbanization, the city is facing an increasing population trend along with substantial growth in vehicle numbers, especially two-wheelers (2W),
Figure 1.Kathmandu Valley with five municipalities
exceeding the carrying capacity of existing road infrastructure. Thus, rapid urbanization with increasing travel demand, limited road capacity, and modal shift towards private modes are all contributing to the problems of traffic congestion, delays and increasing travel time per trip, as well as decrease in road safety in the city. Moreover, motorization of the city has always been coupled with the use of poorly maintained vehicles and adulterated, low quality fuels, burdening the environment of the city.
Public transport (PT) in the city has become despicable and holds the stigma of an unreliable, inefficient and uncomfortable system. After the demise of the government owned mass transportation systems such as
‘trolley bus’ and ‘sajha yatayat’ in 2008, it is currently being fully owned and operated by more than 150 individual PT entrepreneurs. As a result a large numbers of small occupancy vehicles are always waiting in queues for their turn to start operation, after which they are tempted to maximise fare revenue by loading the passengers from locations other than the designated stops, overruling traffic rules etc. Consequently, unscheduled and unreliable public transport, overloading with large number of passengers and an uncomfortable environment inside the vehicles, haphazard loading and unloading of passengers, issues of road safety have delivered the PT system of the city a bad reputation. Hence, it has remained as a vehicle used by captive users, who do not have alternatives, whereas those who are capable are shifting to private modes, especially two-wheelers, which are easy to use and relatively affordable.
Both slow moving lower occupancy vehicles such as ‘tempos’ and higher occupancy high-speed vehicles are using the same route, which has been identified as another reason of traffic congestion in addition to increasing numbers of private vehicles, since it has lowered the speed of high-speed vehicles. The present route planning of public vehicles originating and ending in the core city, poor traffic management, absence of strict laws and orders on vehicle fitness and poor driving behaviour are further contributing to the ad hoc transport system.
Furthermore, the current transport system and policies in the city are focussing on mobility of vehicles rather than ease of all people to reach destinations and without a proper pedestrian environment, non-motorized transport is being neglected. Besides, motorized transport is not easily accessible to physically impaired people, women and senior citizens and it has been argued that the lower income groups are spending one third to half of their income on transport. Any kind of planning task requires the coordination from ministerial to departmental levels for its effective implementation. Without good governance, effective implementation of plans and policies are at stake for the city.
2.3 Conceptualizing LCD and LCDT in KMC
Interviews with stakeholders on the concept of LCD and LCDT for the
city revealed that the share of Nepal in total global greenhouse gas
emissions is only 0.025 percent (Panthi et al., 2010), with per capita
emissions also being among the lowest in the world. Therefore, the
immediate need of the country is adaptation rather than mitigation of GHG
and as such mitigation concerns are often considered as an economic
burden. However, there has been realization that mitigation efforts through
LCD strategies (LCDS) in line with national priorities and capacities do not
necessarily constitute economic burden, while the nation as a whole can benefit through various co-benefits such as lower energy consumption, reduction in air-pollution, and secondary co-benefits such as relief in traffic congestion and health of people, and improvement in levels of accessibility of the people. Though the development of LCDS is in an initial stage, different sectors have been identified already where potential benefits of GHG emission reduction plans can be obtained, most significantly in the transport sector.
Currently, the transport sector of the city is dependent on imported fossil fuel energy which is increasing with increasing motorization, especially the private vehicles. This has not only burdened the country’s economy but also contributed to negative impacts on the environment through local air pollution, health of people as well as accessibility of people through increases in congestion levels due to rapid motorization. Thus, an important pathway of LCD for the city in the transport sector is reduction of its dependency on fossil fuel. This can be done by making the PT system more time efficient, reliable and accessible to all the people as well as making the system energy efficient using alternative fuels. The country also has the potential to introduce a hydropower plant for generating electricity with zero emissions. However, there should be an integrated approach to make this energy source sustainable.
The increase in daily trips and travel demand of people, especially with private vehicles, has been viewed as another reason for unsustainable transport in most of the developing cities. But most of the daily trips in KMC are limited to jobs and education. In such case, strategies and polices of the city could be directed more on how people travel instead of how many trips people undertake. Moreover, transport plans on expansion and widening of roads without proper transport management on increasing personal mobility, is likely to accelerate emissions. So, encouraging mass transit systems and making the PT system of the city reliable, time and cost efficient on the one hand can help in energy and fuel saving, while on the other hand they can encourage people to shift from their private modes. Two schools of thoughts were advocated to deal with the problems of unsustainable transport system in the city. Mass transit systems such as monorail and light rail using electricity as a source of energy are thought to be feasible for solving the current problems of the city, but there is a need of large investment throughout its lifecycle. With no strong policies of the government, sustainability and therefore economic benefits from such system is on the verge. With this argument, the second school of thought of optimizing the current infrastructure system was widely agreed upon, for instance, renewing the trolley bus system with articulated busses and priority lanes, proper route planning and improved traffic management, promoting non-motorized modes, cordon pricing for private vehicles in restricted areas, and improving the current ring road as expressways etc.
Thus, following on the stakeholders’ interviews, from the three strategies for LCDT, ‘shift’ and ‘improve’ have been addressed as being the most feasible strategies to relieve the associated transport problem of the city.
Along with shift to environment friendly modes, improvement on technology and energy efficiency of vehicles is also needed. Though there are policies on vehicle fitness tests, EURO I standards, scrapping of old vehicles, and energy mix, the effective implementation of these is lacking.
Moreover, a low cost alternative and clean energy such as electricity need to
be promoted, e.g. by financial incentives for such vehicles.
3. LOW CARBON TRANSPORT PLANS FOR KMC
The Kathmandu Sustainable Urban Transport Project (KSUT), supported by the Asian Development Bank under the Sustainable Transport Initiative is an on-going project aimed at improving the quality of urban life in Kathmandu Valley (MoPPW & ADB, 2010) through different measures. For the short term, the measures identified were:- improving public transport, implementing traffic management plans for the central area of the city, promoting non-motorized modes in the historic area of the city and improving air quality within the city at large. Thus, building on the interviews, the KSUT project and following ASI strategy, the next section analyses the LCT plans for the city.
3.1 Improving the public transport system and encouraging modal shift
A combination of policy instruments (planning, regulatory, economic, information and technological) are deemed most effective in improving the ridership of public transport as compared to implementing those policy instruments in isolation. From the KSUT report (ADB & MoPPW, 2010) plans for enhancing the PT system of the city addressing one or more of the mentioned policy instruments are included in this study:
Delineating of primary and secondary routes according to vehicle type: This planning instrument is anticipated to improve the efficiency of PT by optimizing transport capacity according to the demand. This delineation of routes, which in its current situation are being used by both high speed and slow moving vehicles, is expected to overcome the mismatch between vehicle types and use of road space, increase the speed and reduce in congestion. The primary routes are assigned to large buses, with an estimated capacity of 100 passengers including standing passengers. The secondary routes are assigned to minibuses with capacity of 60 including standing passengers. Even though transfers between primary routes and secondary routes pose disadvantages to the user, such inconvenience could be minimized by providing user-friendly terminals and scheduled PT.
Moreover, the fare system could be rationalised by establishing a different multi-mode ticket system, e.g. using smart card technology for implementing a sophisticated and complex fare structure for users' benefits.
Dedicated bus lanes with integrated system: The successful cases of BRT could be taken as examples where the performance of the public transport system could be further enhanced by planning dedicated bus lanes or assigning routes as bus only lanes along with technological instruments for implementing integrated system of fare collection and proper scheduling of buses.
Restriction of private modes to the central part of the city: In
addition to increasing attractiveness of PT (as a ‘pull policy’), regulatory
instruments can restrict the use of certain motorized vehicles, types of
vehicles used and the standards they should adhere to. Thus, regulatory
instruments such as restricting vehicles to the central part of the city and
congestion charging help in managing transport demand of central part of
the city and encourage people to shift from private modes to public transport
on the other (‘push policy’).
Incentives and tax reduction policies for public transport: Financial incentives for PT users, as an economic instrument, may strengthen patronage of public transport. Tax reduction policies of government on import of public vehicles attract private investors and may promote public private partnerships in development of sustainable low carbon transport.
3.2 Renewal of the trolley bus system
The government owned trolley bus system got shut down completely in 2008. No clear reasons have been forwarded, but according to views of experts, political circumstances, poor organisation as well as weak patronage of the system were the main reasons of the demise of the system.
Further reasons for inability to attract passengers were assumed to be low speed of the vehicles and limited and inconvenient routes.
The KSUT project proposes the renewal of the trolley bus system in some of the existing routes as well as expanding it into new routes with improved technology and performance of the system. Hence addressing a shift strategy, a planning instrument such as identifying potential routes, plays a significant role along with technological instrument for improving the efficiency of newly proposed vehicles. Furthermore, economic instruments, such as providing financial incentives including tax reduction in combination with regulatory instruments such as restricting motorized modes other than trolley bus in priority lane, congestion charging etc could be more effective in promoting low emission vehicles.
4. ACCESSIBILITY BASED PSS, A TOOL FOR EVALUATING KMC IN LOW CARBON PERSPECTIVE
To derive scenarios of urban accessibility based on the LCDT plans discussed in the previous section as well as to demonstrate the application of PSS for generating and evaluating those scenarios, the following sections describe the data required, pre-processing of the data, modelling framework and its operationalization platform.
4.1 Data Compilation
The data used in this study were collected from primary and secondary sources. For the primary data, interviews on the concept of LCDT and LCD for KMC, existing transport challenges and transport plans for the city were undertaken with relevant people from the government, the private sector and academia. The secondary data were collected from different government departments, private offices and consultancies in the form of spatial and non-spatial data. Data to be preserved in vector format included the city ward boundary, road network, public vehicles routes and stops, locations of schools and colleges. Processing of road network data and public vehicle routes to render usable topology was done in ArcGIS, bus stops were digitized manually where necessary, referring to the KSUT report (ADB &
MoPPW, 2010). As the ward level census data consisted of population
according to gender, the population of higher schools and colleges were
extracted using the percentage of population between ages 15-29. For this
study, access to schools and colleges was considered as a proxy for broadening the capabilities of the young generation to seek socio-economic opportunities and hence contribute to the future development of the city.
Thus, spatial locations of only higher schools and colleges were extracted, resulting into 151 destination points.
The public vehicles considered were minibus, microbus, electric tempo and gas tempo whereas the two-wheeler (2W) was taken as representative of the private mode. In the existing situation, the mode share considered were 52.8% for the public transport and 40.7% for the two wheelers (ADB &
MoPPW, 2010; Bajracharya, 2010). The network data was prepared to represent intermodal network consisting of two or more modes. The following formula was adopted for developing an intermodal network dataset
Total travel time by public vehicle= walk time to stop+ waiting time for vehicle + travel time in vehicle + walk time to destination
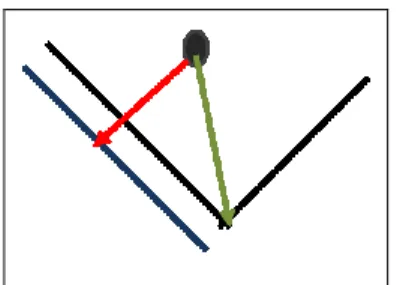
Figure 2.Intermodal connectors for vehicle route and road
In figure 2, the blue line represents the vehicle route coded with an average speed, whereas the black line represents the road network coded with walking speed. The solid circle represents a bus stop and the red line represents the connector between the bus stop and the vehicle route, which was coded with waiting time. The green line represents the connector between stop and road network. As such, people are allowed to get on the bus and get off to their required point only through stops.
4.2 Modelling framework for developing the Planning Support System
Figure 3 presents the modelling framework for developing the PSS for assessing the impact of all the three LCDT plans on urban accessibility, and hence their contributions towards low carbon transport development in the city. This framework integrates the accessibility analysis with a carbon emission model. The output obtained from the accessibility analysis in terms of potential population and distance travelled by mode under consideration to reach the facilities is used as input into the emission model for estimating carbon emissions.
From the various relevant scenario parameters of population growth, rise
in income and changing rate of motorization, population growth was used
for constructing growth scenarios for KMC until 2020. The output of the
various growth scenarios in terms of this parameter is handled as an input
that affects different components of the model and hence changes the
number of potential population and the carbon emissions during that service
provision. The potential population in this study was defined as those who
are provided service with the mode under consideration. Finally, using the
indicators of potential population and the resulting emissions during the
service provision, a quantitative assessment of LCDT plans was undertaken.
For measuring the accessibility, this study has applied a simple contour measure as a location-based activity measure (Geurs & Ritsema van Eck, 2001). The data for KMC lacked information on travel demand, such as origins and destinations of people, individual choice on modes and travel behaviour of people in the city, which would be required for operationalizing the other type of measures. Furthermore, the objective of this study was to demonstrate application of PSS in dealing with accessibility impact of LCDT plans; thus easiness in conceptualization, operationalization and interpretability with undemanding data made the contour measure most suitable for this study. In this approach, computing the number of persons that fell inside the various isochrones was considered as the potential users of the modes, while the interpretation of accessibility for this study was directed as- the higher the number of people serviced by LCDT plans, the higher is the accessibility.
For measuring carbon emission from transport, the Activity-Structure- Intensity-Fuel (ASIF) framework proposed by Schipper et al. (2009) was used which has been presented below.
G= A * Si * Ii * F i,j
where, G= Carbon emission from transport A= total transport activity
S=modal structure
I=modal energy intensity F=carbon content of fuels
Due to the lack of intensive transport activity and behavioural data, the population that can access high schools and colleges within the pre-set travel time isochrones were seen as the potential users of the mode. Thus, calculating the distance travelled to those locations by different mode and the serviced potential population as the output from the accessibility analysis, total transport activity in passenger-km (p-km) was calculated as well. Based on the mode share, passenger-km were estimated for each mode, which was then assigned to vehicles km travelled (VKT) according to the known occupancy factor of that mode. With VKT and the fuel intensity (l/km) of the mode, total fuel consumed was calculated which was further converted into CO
2emission (tons) according to emission factors (g CO
2/l)
5. OPERATIONALIZATION OF THE MODELLING FRAMEWORK IN A GIS-BASED PLATFORM
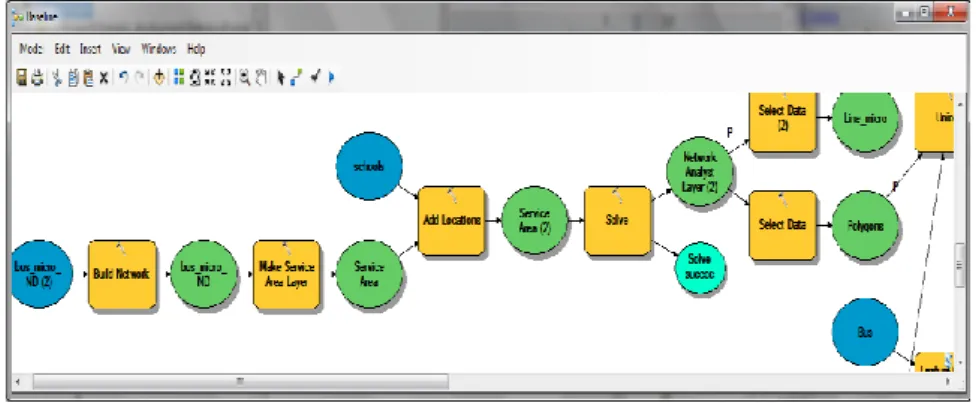
The contour measure of location-based accessibility was operationalized in the model builder platform as shown in figure 4 using ArcGIS network analyst. The current transport system as well as the future transport system was represented with distinct sets of network data. These network data when used as an input would result into a number of potential users of each transport mode and the distance travelled by the mode, which serve as an input for the emission model as activity in p-km.
Figure 3.Modelling framework for developing PSS
Figure 4.Applying contour measure of accessibility for each mode in ArcGIS model builder
The ASIF framework was also operationalized in the open modelling platform of Scenario 360 in CommunityViz (Placeways, 2013). For each type of mode under consideration a user interface was created, which facilitates the user to change the slider bar to make assumption for mode share, average occupancy, fuel intensity and emission factor as shown in figure 5.
Figure 5.User interface for making assumptions
The indicator charts for number of potential population served and the emissions produced as shown in figure 6 allows on the fly visualization of these changes. Further, alerts were added to this PSS, shown in red in the indicator chart, to show the effectiveness of the plans against the baseline.
Figure 6. Indicator chart for the number of potential population (left), emission produced during that service provision (right)
6. APPLICATION OF PSS FOR THE CASE OF KMC
6.1 Definition of growth scenarios
To investigate the effects of the chosen LCDT plans and policies on the
accessibility of people to opportunities and related carbon emissions
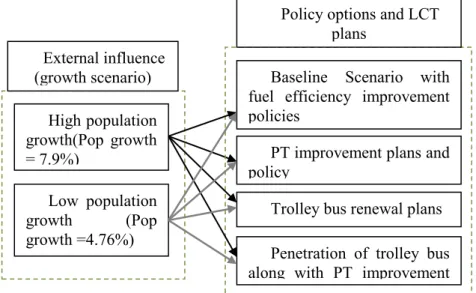
produced during that service, different growth scenarios were constructed, each assuming varying population growth rates. Since the definition of accessibility in this research was operationalized as how many more people would be served by the new plans and systems, uncertainties on future growth of population would yield different results. The study has therefore considered two growth rates of 4.76% (CBS, 2012) and 7.9% (Pradhan, 2004) representing a low growth scenario and high growth scenario respectively. These growth rates respectively represent the growth rate of Kathmandu district for the year 2011 and with projected population for 2001. Thus, with the combination of low and high population growth scenario and selected policies/plans, eight scenarios were constructed (Figure 7).
6.2 Interpretation of baseline scenario and alternative LCDT plans for KMC
The chosen LCDT plans are: Increased public transport patronage, trolley bus renewal plans and penetration of trolley bus along with PT improvement plans. The following sections describe the interpretations of baseline scenario and these LCDT plans.
6.2.1 Baseline scenario with fuel efficiency improvement policies For the baseline scenario until 2020, assuming GDP growth of 5%, it is estimated that the growth in traffic will be 8.75% per annum from 2010- 2015 for public transport, car and motorcycles; from 2016-2020 it will then be 8.5%, 7.5% and 5.0% per annum respectively (ADB & MoPPW, 2010).
This shows that the growth of two-wheelers will decrease compared to public transport and car after 2015 onwards.
Even though the number of two-wheelers in total number of vehicles would be less as compared to cars as private vehicle in 2020, assuming that their popularity would still continue to remain among youths and without any initiation in enhancing public transport patronage, strong enforcement of laws and order and strong policies, current travel demand share of 52.8%
by public transport and 40.7% for two wheelers will still continue in the
Figure 7. Combination of growth scenarios and alternative LCDT plans
High population growth(Pop growth
= 7.9%)
Baseline Scenario with fuel efficiency improvement policies
PT improvement plans and policy
Trolley bus renewal plans Penetration of trolley bus along with PT improvement plans
External influence (growth scenario)
Low population growth (Pop growth =4.76%)
Policy options and LCT
plans
future. The present mode share among public transport:- small occupancy vehicles (micro bus and tempo) with 47% and 13% respectively and high occupancy vehicles (minibuses, buses) with 31% was also assumed to be same for the baseline scenario.
The fuel efficiency estimated by Dhakal (2006) for 2004 and MoPPW &
ADB (2010) for 2010 has shown little variation. However, due to the improvement of vehicle technology worldwide and increase in capacity of people to afford more efficient vehicles subjected to rising income along with enforcement of some of the policies on fuel efficiency, improvement of 20% was assumed in fuel efficiency for baseline scenario in 2020.
6.2.2 Increased public transport patronage
The main elements of this alternative are the delineation of primary and secondary routes, and dedicated lanes for primary routes. With such improvement, average waiting time is expected to be 3 min in each stop (MoPPW & ADB, 2010) as compared to average 10 min in the existing condition (peak hour assumption). In contrast to average speed of 20 kilometres per hour (kph) in the current situation for all types of vehicles, the average speed of vehicles is expected to be 25 kph given as a conservative estimate in the KSUT report whereas due to the dedicated bus lanes and proper traffic management, the speed of the large buses in the primary routes is assumed to increase to 40 kph (Dhakal, 2003). In order to make public transport more attractive, by managing demand and supply, the average occupancy of vehicles is assumed to decrease by 15% to create comfortable environment inside the vehicle. Hence, with these assumptions, the mode share for public transport in 2020 is estimated to be increased by 20% following the KSUT report (ADB & MoPPW, 2010). This increase will be compensated by simultaneous decrease in mode shares of 2W. Due to delineation of route, there will be need of interchange of vehicles from primary to secondary. However, such interchanges will be made convenient by providing user-friendly terminals, scheduled arrival and departure of vehicle as well as convenient interchange spots.
6.2.3 Renewal of trolley bus system
For the renewal of the trolley bus system alternative, a few primary routes of previous plans have been identified as potential routes for trolley bus by the KSUT project. Thus, in these routes, the trolley bus system is assumed to be in operation with dedicated lanes. The plan further addresses import of new trolley buses that are technologically more efficient than the older ones resulting in an average speed of 40 kph.
Since trolley buses are operated with electricity, they are regarded as
clean vehicles and the CO
2emissions of the system are calculated based on
the grid emission factor. Assuming that the electricity will be made available
from the hydropower plant as a potential source of energy, the system could
be run with zero emission. However, this needs strong coordination between
concerned authorities. As such, with the coordination of Nepal Electricity
Authority, the trolley bus system will be operated with electricity making
this system sustainable. With strong regulatory and economic instruments of
financial incentive and taxes, this system will be able to attract passengers.
6.2.4 Penetration of trolley bus system along with PT improvement plans
This alternative considers penetration of trolley bus system along with PT improvement plans, i.e. a combination of the two previously discussed options. Based on the number of trolley buses, it is estimated that it will be able to meet 20% of travel demand in 2020 as a conservative estimate from the KSUT report. Thus, 20% of modal split of large buses on primary routes will be shared by trolley bus. The remaining assumptions on average occupancy, fuel efficiency, emission factors will be as those of PT improvement plans.
7. RESULTS AND DISCUSSIONS
7.1 Accessibility impact of alternative LCDT plans
With 151 locations of high schools and colleges distributed in the city and overlapping of routes for all PT, most of the areas of the city are accessible within 30 minutes of travel time by PT in the baseline scenario (figure 8), while in the same baseline scenario improvement on the accessibility by 2W is shown to be less and is mostly concentrated on the south eastern part and periphery of the city (figure 8). The implementation of LCDT plans (PT improvement plan and penetration of trolley buses along with PT improvement plan) would not hamper the accessibility of people (figure 9). Instead some of the areas in periphery of the city would benefit from this plan. Due to reduced congestion, the average speed of 2W would also be improved resulting in an increase in the accessibility of south eastern part of the city. In the case of the alternative scenario with trolley bus renewal plan, large buses on a few of the primary routes would be replaced by trolley buses as these are zero emission vehicles having similar performance in terms of speed as that of the large conventional busses. The result of this alternative scenario (figure 10) shows some decrease in service area mostly in the south eastern part of the city for PT, whereas for 2W, given the increase in speed against the baseline, there would be an increase in service area.
Though the results show variation in the accessibility due to the LCDT
plans, the larger part of the city is reachable from at least one of the
facilities by using either of the modes - public or private. This is due to the
large number of facilities dispersed around the city. The network model
prepared for this analysis considered traffic with constant average speed for
every road segment, while no congestion factor was applied, which might
possibly overestimate the speeds in city centre whereas underestimates it in
other areas of the city. In reality the frequency of public vehicles in the city
is irregular; so the average waiting time of 10 minutes was assumed for the
baseline whereas 3 min was assumed for the new system referring to the
KSUT project. With these assumptions and in the absence of a calibration
and validation of the model for the case study area, there is high probability
of deviation of the accessibility result from reality. Despite these limitations,
having the analysis done in relative terms, i.e. comparing each scenario with
the baseline scenario, the results are argued to be valid.
Figure 9. Service area by public transport + walk and 2W within 30 min from facilities (higher schools & colleges) for alternative scenarios with PT improvement
plan and penetration of trolley bus along with PT improvement in 2020 Figure 8. Service area by public transport + walk and 2W within 30 min from facilities (higher schools & colleges) for baseline scenario in 2020
In both the high and low population growth scenarios, both alternatives with PT improvement plans and penetration of trolley bus system along with PT improvement plans could increase accessibility against the baseline shown in figure 11. But there would be a decrease in accessibility due to the alternative with trolley bus renewal plan, which would be due to absence of a few primary routes. Having some congestion relief, the average speed of 2W would be increased resulting in an increase in the level of accessibility.
Figure 11. Percentage change against baseline (2020) for number of people served by LCDT plans for each mode.
7.2 Emissions for growth scenarios and alternative LCDT plans
The baseline scenario with only improvement in fuel efficiency clearly shows a non-desirable future as depicted in figure12. Under the high population growth scenario there would be an increase in total emission with all the alternative LCDT plans implemented against the base year. Even
Figure 10. Service area by public transport + walk and 2W within 30 min from facilities (higher schools & colleges) for alternative scenarios with
trolley bus renewal plan in 2020
though there would be an increase in accessibility in the high population growth scenario, the assumptions on modal shift would not be sufficient to reduce the emissions in absolute terms, unlike in the low population growth scenario.
Figure 12. Percentage change in total emission against the base year for alternative scenario of LCT plans under high and low population growth scenario in 2020
More accessibility means more people would be able to take part in activities, which increases travel demand. The increase in modal share of private vehicles, the need for people to interchange between routes due to delineation of primary and secondary routes, as well as the construction of additional few primary and secondary routes, would all contribute to the increase in emissions against the baseline in alternative scenario with the PT improvement plans shown in figure 13. But under the same circumstances, penetration of trolley bus system on primary routes as a zero emission vehicles and meeting 20% of ridership of large buses would halve the emissions. On the other hand the reduction in emissions against the baseline in the alternative scenario with the trolley bus renewal plan would be at the expense of lower accessibility. Since an increase in modal share for public transport was assumed to be compensated by subsequent decrease in two wheelers, there will be a reduction in emissions and the total emissions reduction gain can be seen in all the alternative scenarios with LCDT plans shown in figure 13, the highest during trolley bus renewal.
Figure 13. Percentage change of emissions against baseline in alternative scenarios with LCDT plans under both high and low population growth scenarios in 2020
7.3 Sensitivity analysis
The sensitivity analysis was performed varying the critical parameters in the model which were average speed and mode share. One of the effects of the LCDT plans would be on improvement in average speed of vehicles resulting into change in the accessibility of people. Thus, the analysis was done by lowering speed on primary routes from 40kph to 25kph in PT improvement plans since primary routes form large part of public vehicle routes. As shown in figure 14 within this limit in change in speed the LCDT plans would still result in higher accessibility against the baseline and there would still be reduction gain as depicted in figure 15.
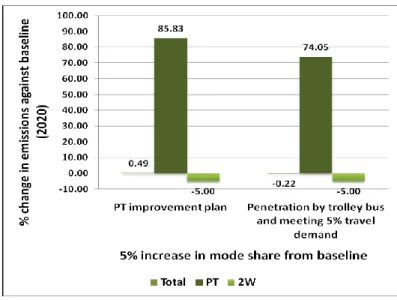
There are many factors that influence the choice of mode by individuals such as cost, travel time, security, convenience, comfort etc. Bajracharya (2010) shows that people in Kathmandu give first preference to reliability and punctuality secondly to comfort and least to the fare. So, if the new system is able to increase its attractiveness in terms of reliability, comfort, convenience at lower or the same cost as of the old system then there could be some modal shift. Ultimately, it depends on people’s attitude and the degree of modal shift remains uncertain. Therefore, a sensitivity analysis was performed to see the performance of alternative scenarios with those LCDT plans under varying mode share. As shown in figure 16 with a 5%
increase in the mode share of PT due to subsequent shift from the 2W, it would lead to an emission reduction gain against the baseline for the alternative scenario of penetration of trolley bus along with PT improvement plans even when there is only 5% share in ridership by trolley bus. But in the alternative scenario with PT improvement plans, only 5% shift from private would not be able to lead to emission reduction gains since PT would contribute to the emissions along with 2W.
Figure 14. Percentage change in number of people served in 2020 against baseline with
consideration of different speed for alternative scenario with PT improvement
plans
Figure 15.Percentage change in emission in 2020 against the baseline with consideration
of different speed for alternative scenario with PT improvement plans
Figure 16. Percentage change in emissions in total and for each mode against the baseline with 5% increase in mode share for alternative scenarios of two LCT plans
8. CONCLUSION
Concerns pertaining to the need of developing countries to address both development policy and climate change have captured the attention of both policy makers and academicians. The concept of low carbon development (LCD) follows a development-first approach and aims to enhance development while minimizing carbon emissions.
The transport plans considered in the study include modal shift and energy efficiency. Defining accessibility as an enabler for widening human capability to reach to number of opportunities, we argue that to realise LCD for the city, LCDT plans should improve accessibility while at the same time minimize CO
2emissions. Nevertheless, increase in accessibility means providing more opportunities to people to participate, which increase the travel demand and hence increase emissions. The result from scenario analysis of LCDT plans in figure 13 shows a decrease in CO
2emissions against the baseline for all the three alternative plans considered in the study due to the subsequent decrease in mode share of 2W, with the trolley bus renewal alternative showing the highest amount of reduction in CO
2emissions. However, the decrease in emissions with the trolley bus renewal plans will be at the expense of accessibility.
Thus, making low carbon modes appealing and user friendly through spatial organization and route reorganization would not be sufficient for minimizing emissions. Therefore, behavioural change and shift from private to public modes is necessary to realize substantial emissions reduction gain as depicted with the result of scenario analysis on LCDT plans and sensitivity analysis (figure 13 and figure 16 respectively). Ultimately, the final choice on mode depends on people’s preferences, attitudes and behaviour. So, for realizing substantial shift, the package of policies that address ‘push and pull’ could be more effective for the case of KMC
The use of models in developing different energy consumption and CO
2emissions scenario is increasing widely (Cai et al., 2007; Dhakal, 2003).
However, the methodological development for evaluating the impact of
LCDT plans and their contribution towards LCD of the city is scanty.
Moreover, the development of PSS integrating accessibility analysis and emission modelling, as a concrete tool in evaluating the LCDT plans for their impact on LCD of the city, is virtually not available. Addressing this research gap, this study has been able to develop such tool and demonstrated its application for KMC. Nonetheless, some limitations exist because of data constraints. The approach has been limited with demand side data on origin and destination of people in the city, mode choice of people, value given by people to land use and transport component, which will help to operationalize other measures of accessibility. Thus, for further research future PSS should incorporate a stated preference survey design to know people’s attitudes on the current and future transport system.
REFERENCES
ADB, and MoPPW. (2010). Kathmandu Sustainable Urban Transport Project: RRP Linked
Documents, Retrieved 11 Aug, 2011, from
http://www.adb.org/Documents/RRPs/?id=44058-01-3
Asian Development Bank (ADB). (2011). ADB and the Transport Sector Retrieved 24 Aug, 2011, from http://www.adb.org/transport/
Bajracharya, A.R. (2010). "Commuter's travel mode and its impact on urban transportation system, A Case Study", Urban Development.
Bertolini, L. et al. (2005). "Sustainable accessibility: a conceptual framework to integrate transport and land use plan-making. Two test-applications in the Netherlands and a reflection on the way forward", Transport Policy, 12(3), 207-220.
Cai, W. et al. (2007). "Scenario analysis on CO2 emissions reduction potential in China's electricity sector", Energy Policy, 35(12), 6445-6456.
CBS. (2012). Final result of population and housing census 2011, Retrieved 6 December, 2012, from http://census.gov.np/
Cervero, R. and Kockelman, K. (1997). "Travel demand and the 3Ds: density, diversity, and design", Transportation Research Part D: Transport and Environment, 2(3), 199-219.
Dalkmann, H. and Brannigan, C. (2007). Transport and climate change, module 5e, sustainable transport, a sourcebook for policy-makers in developing cities, GTZ global Retrieved 29 June, 2011, from http://www.gtz.de/de/dokumente/en-transport-and-climate- change-2007.pdf
Dhakal, S. (2003). "Implications of transportation policies on energy and environment in Kathmandu Valley, Nepal", Energy Policy, 31(14), 1493-1507. doi: 10.1016/s0301- 4215(02)00205-7
Dhakal, S. (2006). Urban Transport and the Environment in Kathmandu Valley, Nepal:
Integrating global carbon concerns into local air pollution management First. Retrieved 11 Aug, 2011, from http://www.energycommunity.org/documents/iges_start_final_reprot.pdf Dimitriou, H.T. (1992). Urban transport planning: A developmental approach. Routledge,
Taylor & Francis, Inc, London.
Dimitriou, H.T. and Gakenheimer, R. (Eds.). (2011). Urban Transport in the Developing World, A Handbook of Policy and Practice, Edward Elgar Publishing Limited.
Geertman, S. and Stillwell, J. (2009). "Planning support systems: content, issues and trends", Planning Support Systems Best Practice and New Methods, 1-26.
Geurs, K.T. and Ritsema van Eck, J. (2001). Accessibility measures: review and applications.
Evaluation of accessibility impacts of land-use transportation scenarios, and related social and economic impact.
Ha, P.T.H. (2011). Assessing accessibility for the Randstad metropolitan area in the Netherlands: learning lessons for Asian megacities. Master of Science (MSc) Thesis, Geo- Information Science and Earth Observation, Enschede.
Halsnæs, K. and Verhagen, J. (2007). "Development based climate change adaptation and mitigation—conceptual issues and lessons learned in studies in developing countries", Mitigation and Adaptation Strategies for Global Change, 12(5), 665-684. doi:
10.1007/s11027-007-9093-6
Hickman, R. and Banister, D. (2007). "Looking over the horizon: Transport and reduced CO2 emissions in the UK by 2030", Transport Policy, 14(5), 377-387. doi:
10.1016/j.tranpol.2007.04.005
Hoffman, A. (2006). The Capability Approach and educational policies and strategies:
Effective life skills education for sustainable development, AFD, Paris.
IPCC. (2007). "Climage Change 2007: Working Group III: Mitigation of Climate Change", IPCC Fourth Assessment Report: Climage Change 2007 Retrieved 11 Aug, 2011, from http://www.ipcc.ch/publications_and_data/ar4/wg3/en/ch5s5-2.html#5-2-1
KMC. (2013). Ward Profile Retrieved 8th December 2012, from http://www.kathmandu.gov.np/Page_Ward+Profile_15
Mazumdar, K. (2003). "A new approach to human development index", Review of Social Economy, 61(4), 535-549.
MoPPW and ADB. (2010). Kathmandu Sustainable Urban Transport Project, Final Report.
Kathmandu.
Panthi, J., et al. (2010). Renewable energy technology for reducing greenhouse gas emission.
Retrieved from http://jeebanpanthi.files.wordpress.com/2010/06/article.pdf
Pettit, C.J. (2005). "Use of a collaborative GIS-based planning-support system to assist in formulating a sustainable-development scenario for Hervey Bay, Australia", Environment and Planning B: Planning and Design, 32(4), 523-545.
Placeways. (2013). CommunityViz Retrieved 20 February, 2013, from http://placeways.com/communityviz/
Pradhan, P.K. (2004). "Population Growth, Migration and Urbanisation. Environmental Consequences in Kathmandu Valley, Nepal", Environmental change and its implications for population migration, 177-199.
Saito, M. (2003). "Amartya Sen's capability approach to education: A critical exploration", Journal of Philosophy of Education, 37(1), 17-33.
Sakamoto, K., et al. (2010). "A Paradigm Shift Towards Sustainable Low-Carbon Transport—Financing the Vision ASAP", Institute for Transportation & Development Policy. New York, United States.
Schipper, L., et al. (2009). "Transport and Carbon Dioxide Emissions: Forecasts, Options Analysis, and Evaluation", Asian Development Bank.
Sen, A. (2002). What can Johannesburg achieve. Paper presented at the World Summit on Sustainable Development (WSSD), Mimeo.
Tilburg, X.V., et al. (2011). Paving the way for low-carbon development strategies.
UNFCCC. (2011). Durban Climate Change Conference Retrieved 11 Feb, 2012, from http://unfccc.int/meetings/durban_nov_2011/meeting/6245/php/view/documents.php Yuan, H., et al. (2011). "What is Low-Carbon Development? A Conceptual Analysis", Energy
Procedia, 5, 1706-1712. doi: 10.1016/j.egypro.2011.03.290