Development and Application of Discrimination Method of Substandard and Falsified Medical Products using Quality Test and
Non‑destructive Spectroscopy
著者 垣尾 智子
著者別表示 Kakio Tomoko journal or
publication title
博士論文本文Full 学位授与番号 13301甲第4604号
学位名 博士(創薬科学)
学位授与年月日 2017‑09‑26
URL http://doi.org/10.24517/00049711
doi: 10.4269/ajtmh.16-0971
Creative Commons : 表示 ‑ 非営利 ‑ 改変禁止 http://creativecommons.org/licenses/by‑nc‑nd/3.0/deed.ja
博 士 論 文
Development and Application of Discrimination Method of Substandard and Falsified Medical Products using Quality Test
and Non-destructive Spectroscopy
品質試験および非破壊分光法を用いた品質不良薬・偽造薬の検出方法の開発と応用
金沢大学大学院医薬保健学総合研究科 創薬科学専攻 国際保健薬学研究室
学籍番号 1429012014
氏名 垣尾智子
主任指導教員名 坪井 宏仁
1
CONTENTS
Preface
... 8Chapter I Classification and Visualization of Physical and Chemical Properties of Falsified Medicines with Handheld Raman Spectroscopy and X-ray Computed Tomography 1.1 INTRODUCTION……….…..12
1.1.1 Definition of substandard and falsified medical products…………12
1.1.2 Non-destructive spectroscopic method ………13
1.1.3 Handheld instrument to detect SFs………14
1.1.4 Profiling of falsified products………....14
1.1.5 Physical structure by X-ray CT……….15
1.1.6 Combination method of handheld Raman and X-ray CT………….15
1.2 EXPERIMENTAL……….…..16
1.2.1 Handheld Raman Spectroscopy………..17
1.2.2 X-ray CT and Image acquisition……….…...18
1.3 RESULTS……….………...19
2
1.4 DISCUSSION………...23
1.5 REFERENCES……….…...26
List of Figure
Figure 1.1. Visual inspection of tablets….…...32
Figure 1.2. Raman spectra of the active pharmaceutical ingredients (API), Blopress tablets (2 mg), (4 mg), (8 mg), (12 mg), (16 mg) and Placebo ……...33
Figure 1.3. Raman spectra of the API, lactose monohydrate and the tablets……...35
Figure 1.4. Average p-values of authentic products calculated automatically by the handheld Raman device….…...……...36
Figure 1.5. X-ray CT images of the internal structure of tablets T-1 to T-8...37
Figure 1.6. Decision tree of combination approach for non-destructive discrimination...38
List of Table
Table 1.1 The results of handheld Raman examination of authenticity...34
3
Chapter II Survey to Identify Substandard and Falsified Tablets in Several Asian Countries with Pharmacopeial Quality Control Tests and Principal Component Analysis of Handheld Raman Spectroscopy
2.1 INTRODUCTION………...………..40
2.1.1 SF statement in WHO 2017……….41
2.1.2 Survey on falsified medical products ……….41
2.1.3 Survey of substandard medical products………....42
2.1.4 Quality control by analytical procedures and acceptance criteria….42 2.1.5 Sample Collection………...43
2.1.6 Impact on quality by excipients …..………...43
2.1.7 Principal component analysis (PCA) of Raman spectra...44
2.2 EXPERIMENTAL………45
2.2.1 Sample Collection………...45
2.2.2 Visual Inspection………....45
2.2.3 Quality Control Test………46
2.2.4 Content Uniformity and Assay………46
4
2.2.5 Dissolution………..47
2.2.6 Handheld Raman Spectroscopy………..47
2.2.7 Preprocessing of Raman spectra………48
2.2.8 Principal component analysis (PCA) ………49
2.3 RESULTS……….50
2.3.1 Content Uniformity, Assay, Dissolution Behavior……….51
2.3.2 Handheld Raman spectroscopy and PCA…………..……….52
2.4 DISCUSS ION……….………...54
2.5 REFERENCES………..………55
2.6
CHALLENGES FOR FUTURE SF RESEARCH………...….71
List of Figure Figure 2.1. Dissolution result of candesartan cilexetil tablets...63
Figure 2.2. Content uniformity and assay results of candesartan cilexetil tablets
……….………...64
5
Figure 2.3. Raman spectra of authentic candesartan cilexetil tablets and SFs (Before MSC preprocessing of spectra)…………..………...66
Figure 2.4. Raman spectra of authentic candesartan cilexetil tablets and SFs (After MSC preprocessing of spectra)...67 Figure 2.5. Comparison between the calibration and validation result in PCA model...68
Figure 2.6. PCA score plot derived from the Raman spectra of candesartan cilexetil tablets, including falsified tablets, collected in China, Indonesia, Japan and Myanmar...69
Figure 2.7. Loading on PC1, PC2 and PC3 in the PCA model calculated by using Raman spectra of candesartan cilexetil tablets...70
List of Table
Table 2.1 Summary of the results of dissolution, assay, content uniformity and chemical similarity of candesartan cilexextil tablets………..………65
Chapter III Development and Application of Speedy and in-situ 3D Fluorescence Method
to Detect Substandard and Falsified Parenteral Products
6
3.1 INTRODUCTION……….…..73
3.1.1 Distribution of Falsified Avastin in U.S……….73
3.1.2 Distribution of Falsified Herceptin in EU………74
3.1.3 Evaluation of API in injectable products by Spectrofluorophotometer
………...74
3.1.4 Excitation-Emission Matrices Method………75
3.2 EXPERIMENTAL……….…76
3.2.1 Principle and Advantage of Fluorescence Measurement………....76 3.2.2 Fluorescence Excitation-Emission matrices (EEMs) method………76
3.2.3 Conventional Fluorescence Measurement vs New Approach………77
3.3 RESULTS………..……….….77
3.3.1 Identification of API in injectable product by EEMs…………78 3.3.2 New Approach without Cell Unit………78
3.4 DISCUSSION…..……….……….….78
3.5 REFERENCES………79
7
List of Figure
Figure 3.1. EEMs matrix of injectable products including peptide and vitamin
………...81
Figure 3.2. Conventional fluorescence measurement cell unit……….………....82
Figure 3.3. New approach to measure the fluorescence compound in parenteral product from the outside of the glass ampoule ………82
Figure 3.4. EEMs data of peptide, small molecule and antibody in injectable products ………...83
Conclusion and Summary………84
Acknowledgements ……….86
List of Papers (2014-2017) ………...……….87
8
Preface
WHO warned that Substandard and Falsified medical products (SFs) can harm patients and fail to treat the diseases for which they were intended and they lead to loss of confidence in medicines, healthcare providers and health systems, and affect every region of the world.
Development of analytical procedure for detecting SFs is the key to grasp the distribution of the SFs and to understand the physical and chemical properties of the SFs to take measure to suppress the public health damage.
There are various analytical methods defined for the analysis of a specific medical product, such as published in the pharmacopeias, but the discrimination methods to investigate the authenticity for detecting SFs which are actually distributed on the global market are still limited. Further, there are also few studies on how to apply the analytical technologies to discriminate the SFs with the portable device for in-situ measurements, non-destructive methods for evidence preservation of SFs, easy to use and low cost for easy introduction of those technologies, speedy measurements in order to grasp the actual situation immediately and to suppress damage to public health.
This paper is composed of three chapters. Chapter I shows that how to visualize the physical
and chemical properties of falsified medical products with the combination technology of
Handheld Raman Spectroscopy and X-ray Computed Tomography. Chapter II shows the result
9
of the survey to identify substandard and falsified tablets of hypertension medical products
collected in China, Indonesia and Myanmar with pharmacopeial quality control tests and
principal component analysis of handheld Raman spectroscopy. The measurements were
conducted using the quality control tests such as assay and dissolution tests published in the
pharmacopeia and the principal component analysis (PCA) of the Raman spectra obtained by
using handheld Raman spectroscopy. Chapter I and Chapter II describe about the analytical
technologies for the oral solid pharmaceutical products. In the chapter III, about the
development and application of speedy and in-situ 3D fluorescence method for the parenteral
products are shown. The fluorescence spectroscopy was applied to the active pharmaceutical
ingredient (API) in the parenteral pharmaceutical products. The developed analytical methods
shown in Chapter I to III are expected to be applied widely as the powerful tools for detecting
SFs in the research institutes, authorities and the pharmaceutical industry.
10
Chapter I
Classification and Visualization of Physical and Chemical Properties of Falsified
Medicines with Handheld Raman Spectroscopy and X-ray Computed
Tomography
11
ABSTRACT
Analytical methods for the detection of Substandard and Falsified medical products (SFs) are important for public health and patient safety. Research to understand how the physical and chemical properties of SFs can be most effectively applied to distinguish the SFs from authentic products has not yet been investigated enough. Here, we investigated the usefulness of two analytical methods, handheld Raman spectroscopy (handheld Raman) and X-ray computed tomography (X-ray CT), for detecting SFs among oral solid anti-hypertensive pharmaceutical products containing candesartan cilexetil as an active pharmaceutical ingredient (API). X-ray CT visualized at least two different types of falsified tablets, one containing many cracks and voids and the other containing aggregates with high electron density, such as from the presence of the heavy elements. Generic products that purported to contain equivalent amounts of API to the authentic products were discriminated from the authentic products by the handheld Raman and the different physical structure on X-ray CT.
Approach to investigate both the chemical and physical properties with handheld Raman and
X-ray CT, respectively, promise the accurate discrimination of the SFs, even if their visual
appearance is similar with authentic products. We present a decision tree for investigating the
authenticity of samples purporting to be authentic commercial tablets. Our results indicate that
the combination approach of visual observation, handheld Raman and X-ray CT is a powerful
strategy for non-destructive discrimination of suspect samples.
12
1.1 INTRODUCTION
In 2015, 128 countries were impacted by pharmaceutical crime, including sale of substandard and falsified medicines (SFs), and the number of incidents in the Asia Pacific region exceeded one thousand for the first time.
1-9The World Health Organization (WHO) and the European Commission have warned about the danger posed to public health by SFs, and pointed out the need for measures to detect and prevent distribution of SFs.
10,111.1.1 Definition of substandard and falsified medical products
The term of falsified medicines means any medicinal product with a false representation of:
(a) its identity, including packaging, labelling, name or composition, as regards any of the
ingredients including excipients and the strength of those ingredients; (b) its source, including
manufacturer, country of manufacture, country of origin or marketing authorisation holder; or
(c) its history, including records and documents relating to the distribution channels used.
11Meanwhile, the term of substandard medicines refers to genuine medicines produced by
manufacturers authorized by the relevant National Medicines Regulatory Authority, but which
do not meet quality specifications set out for them by the national standards.
10The United
States Food and Drug Administration (FDA) has investigated various analytical methods to
discriminate SFs from genuine medical products.
1213
1.1.2 Non-destructive spectroscopic method
Non-destructive analytical technologies that can identify and quantify APIs and excipients in pharmaceutical tablets include Raman spectroscopy
13-17, Near Infrared spectroscopy (NIR)
18-26, X-ray diffraction (XRD)
27-28, NMR spectroscopy
29, terahertz spectroscopy
30, and chemical imaging with combinations of vibrational spectroscopy and multivariate spectral analysis etc.
23,24,28,31-34In particular, Raman spectroscopy provides sharp, characteristic spectral peaks,
and therefore Raman spectroscopy is particularly suitable for identifying APIs and excipients in
tablets. Non-destructive spectroscopic methods are summarized in the following figure.
14
1.1.3 Handheld instrument to detect SFs
In addition, hand held instruments are now widely available for Raman
35and NIR spectroscopies, and devices covering the spectral region from ultraviolet (UV) to the infrared (IR)
12. These instruments are suitable for on-site inspection to detect SFs at airports and customs, and to detect substandard medicines at manufacturing sites. Since these instruments are relatively inexpensive and require little or no sample preparation, they are especially suitable for use in low and middle-income countries (LMICs).
36Further, these methods are non-destructive, so that specimens found in surveys remain available for use as evidence for legal and regulatory purposes.
1.1.4 Profiling of falsified products
Information allowing the manufacture of falsified products is readily available. For examples,
the contents of the drug product, including the API identity and quantity, and all excipients, are
stated in the drug package insert. Other pertinent information, such as the shape, color, special
markings and ID code can also be obtained easily from the drug package insert or website
information. Pfizer Inc. has reported the existence of the falsified medicines containing the
same effective ingredient as the authentic medicine, and with very similar appearance to the
authentic tablets, in the global market.
3715
1.1.5 Physical structure by X-ray CT
To detect such falsified products, which may be indistinguishable from authentic products visually and chemically, X-ray CT can be used to visualize differences in the physical structure of the tablets, such as particle size, uniformity of granules, film coating thickness, and the existence of pores or voids, which may result from differences in the manufacturing process and conditions, or grade of additive. These are important, because defects of physical structure can influence both stability and dissolution properties. Further, X-ray micro CT is a powerful tool to observe the distribution of elements in tablets by utilizing the difference of the electron density. For example, the distribution of magnesium in magnesium stearate, an additive used as a lubricant has been visualized by X-ray CT.
381.1.6 Combination method of handheld Raman and X-ray CT
In this study, we investigated the effectiveness of handheld Raman spectroscopy and X-ray CT
to discriminate SFs from authentic medicines of product A (Blopress Tablets), focusing on
anti-hypertensive tablets containing candesartan cilexetil as API which is an angiotensin II
receptor blocker, because they are widely prescribed worldwide for the treatment of
hypertension. Authentic medicines were collected from Japan manufacture. We used generic
products collected in China as example of products containing the same API but having
differences in the kind of excipients and the manufacturing process. As known falsified tablets,
we used falsified tablets from Indonesia, whose outer packaging and press through pack (PTP)
16
packaging were very similar with the authentic medicine, but were inconsistent with those of authentic medicines.
1.2 EXPERIMENTAL
The collected and measured samples are summarized in the following.
The authentic commercial tablets of Blopress including 0 mg (Placebo), 2 mg, 4 mg, 8 mg, 12
mg and 16 mg of API, together with lactose monohydrate, corn starch, maize starch,
carboxymethylcellulose calcium (ECG-505), hydroxypropyl cellulose (HPC-L), polyethylene
glycol 6000 (PEG 6000), and magnesium stearate (St-Mg) were used. The weight and size of
the 4 mg, 8 mg and 12 mg tablets are equivalent, as the amount of lactose monohydrate is
adjusted according to the weight of API to maintain a constant total weight. Tablets distributed
17
as generic products in China from two different manufactures and two falsified products discovered in Jakarta, Indonesia in 2011 and 2012 were also used in this study. The falsified products were identified based on visual inspection of the packaging (differences from the authentic product included the color of the printed letters and the printing positions on the surface of the aluminum blister). These falsified products had been collected in different pharmacies in Jakarta, and their distribution was reported to Forensics, Brand Protection and Investigations. Two types of model formulations of falsified tablets were also prepared by physically mixing the API and excipients, and directly compressing the mixture at a pressure of 11 kN without a granulation process. One of them contained the 8 mg API and lactose monohydrate to make the same total weight as that of the authentic tablets, and the other contained 8 mg API and all excipients in the same proportions as in the authentic tablets.
1.2.1 Handheld Raman Spectroscopy
All tablets were evaluated with a handheld Raman spectrometer (TruScan®, Thermo
Scientific), and chemical equivalence between the authentic product and the other samples was
examined based on the similarity of the Raman spectra. The Raman spectrum of the authentic
tablets was registered in the instrument as the reference spectrum, and the similarity of the
Raman spectra between the authentic tablets and test tablets was automatically calculated and
assigned the p-value. The test tablet is judged "pass" if the p-value for similarity is more than
18
0.05, and “fail” if less than 0.05. In other words, “fail” means that the Raman spectrum of the test sample does not match that of the authentic product. The calculation algorithm for p-value in the instrument has been validated, but has not disclosed and is designed not to be modifiable.
We confirmed the validity and the accuracy of the judgment by extracting and examining the raw data of the Raman spectra. If the device encounters a completely different Raman spectral pattern, it stops accumulating data and judges that the p-value is 0. Blow is a diagram of the flow of the discrimination by using handheld Raman.
1.2.2 X-ray CT and Image acquisition
The X-ray micro CT consists of a combination of a high-intensity X-ray generator and a
high-resolution X-ray camera. It is capable of observing the three-dimensional internal structure
19
of tablets at the micron-scale, based on the different X-ray absorptions of the constituent materials. The sample is placed on a rotating stage located between the X-ray generator and the X-ray detector. Multiple 2-dimension X-ray transmission images are recorded at different sample-rotation angles, and are converted into a three-dimensional image by a tomographic reconstruction algorithm. X-ray tomography measurements of tablets were conducted using a high resolution 3D X-ray microscope (nano3DX, Rigaku). The incident X-ray was generated using a rotating-anode generator with a molybdenum target operated at the tube voltage and current of 50 kV and 24 mA, respectively. The temperature was maintained at 22-24ºC during data acquisition. The 2160 lens, which allowed measurements in a 7.12 mm x 5.40 mm field of view with a resolution of 4.32 um/pixel, was used. Each CT reconstruction was conducted using 1800 projection shots with an exposure time of 5 seconds/shot. The analyses were done using the nano3D Calc software (Rigaku) and Image.
391.3 RESULTS
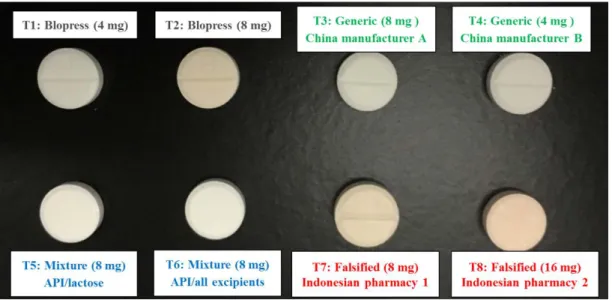
Figure 1.1 shows the appearance of each tablet. The 4 mg authentic product A (T-1) is white
scored tablets, and the 8 mg dosage strength authentic product A (T-2) is a reddish white scored
tablet. An embossed character was observed on the surface of both authentic tablets. The
generic Chinese products, labeled T-3 and T-4 were white scored tablets with no embossed
character on the surface. Two model formulation tablets, labeled T-5 and T-6, were prepared by
20
direct compression without granulation. T-5 contains 8 mg API and lactose monohydrate in an appropriate quantity to make tablet of the same shape and size as the authentic product A. T-6 includes API and all excipients in the same proportions as the authentic product A. T-5 and T-6 were white tablets with no scored line on the surface. The falsified products T-7 and T-8 from Indonesia, where product A is legally marketed were reddish white scored tablets and reddish tablets with no scored line, respectively. Without detailed knowledge of physical appearance of genuine tablets, it would be difficult to distinguish the falsified products simply by visual inspection.
Figure 1.2 shows the Raman spectra of the API and the authentic tablets of Blopress tablets (2 mg), (4 mg), (8 mg), (12 mg), (16 mg) and Placebo. The characteristic peaks from API were confirmed in the region from 1780 cm
-1to 1700 cm
-1, which are not overlap with the peaks from the excipients. Further, the intensity of the API peak at around 1610 cm
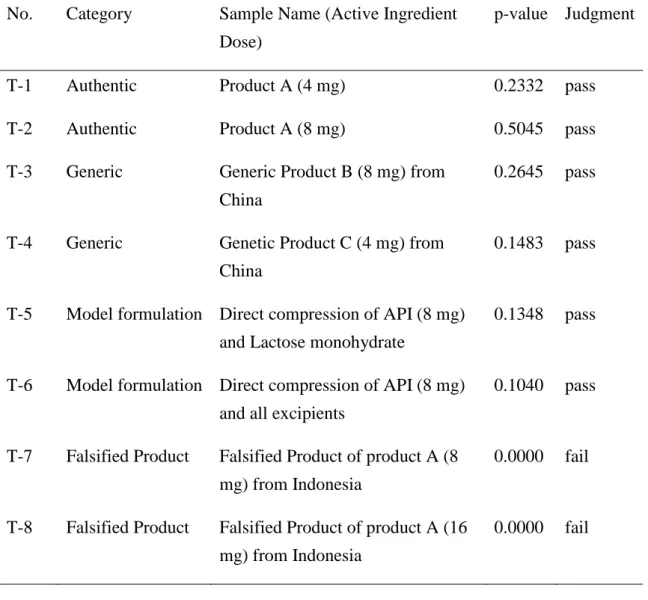
-1increased with the increase of the concentration of the API in the tablets. The Raman spectra of tablets T-1 to T-8 were compared with that of the authentic product. Table 1 shows the p-values and the auto-judgment results for each tablet. The authentic product T-2 was evaluated correctly as
“pass” (p = 0.5045). Authentic tablets with a different dose of API (4 mg, T-1), the generic
tablets T-3 and T-4 from China, and the model formulations T-5 and T-6 including same dose
of API as authentic product T-2 were also discriminated as “pass”, although the p-values were
lower than that of the authentic product T-2. The falsified products T-7 and T-8 were evaluated
as “fail” based on the obvious difference of the Raman spectra from that of the authentic
21
product. These results suggested that the handheld Raman technique can distinguish falsified products that are grossly different from authentic products, but cannot discriminate suspect samples with similar composition including an insufficient quantity of API.
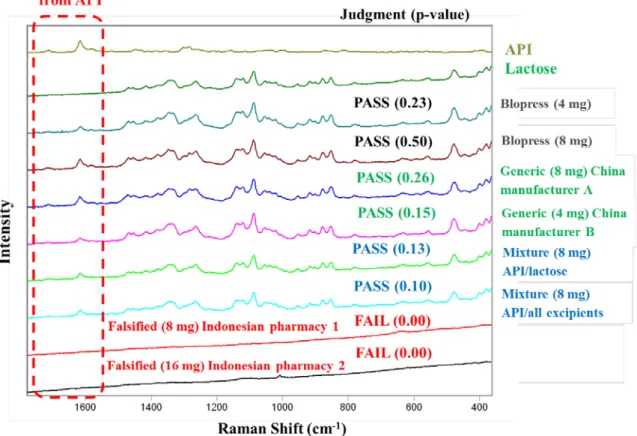
The Raman spectra obtained with the handheld instrument are shown in Figure 1.3. Samples T-1 to T-6 showed very similar Raman spectra to that of the authentic product. The spectral features are mainly due to the API and lactose monohydrate. Characteristic peaks of the API that do not overlap with peaks due to the excipients were observed in the region from 1780 cm
-1to 1700 cm
-1as shown in Figure 1.3. The peak intensity from API in this region was reported to increase linearly with increase of API content in the tablets.
27The Raman spectra of tablets T-1 to T-6 illustrate the difficulty of discriminating authenticity correctly among compositionally similar samples based only on chemical properties. On the other hand, the p-values of the falsified products T-7 and T-8 were 0.0000; their spectra showed no characteristic peaks of API, and the baselines rose from higher to lower wavelengths, suggesting the presence of a fluorescent component. Thus, falsified products that do not contain the API can be evaluated correctly as “fail”.
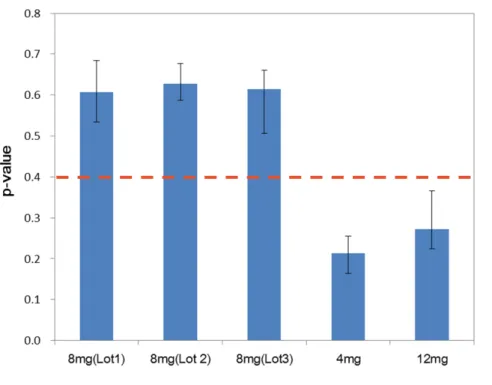
Figure 1.4 shows the average p-values calculated automatically by the handheld Raman
instrument with reference to the authentic product A (8 mg), T-2. Good repeatability of the
p-value was confirmed using 3 different lots of the authentic product A (8 mg) with ten
replicate measurements. The other doses (4 mg and 12 mg) of the authentic products gave
average p-values of 0.2127 and 0.2725, respectively, compared with the range of 0.5059 to
22
0.6768 for three different lots of 8 mg product A. These results suggested an appropriate criterion of the p-value should be set for discriminating the authenticity of the product A (8 mg) from falsified products. Based on the average p-values, a p-value of less than 0.4 might be a suitable criterion for judgment of falsified or substandard products containing less than 50% or more than 150% API compared to the content of the authentic product.
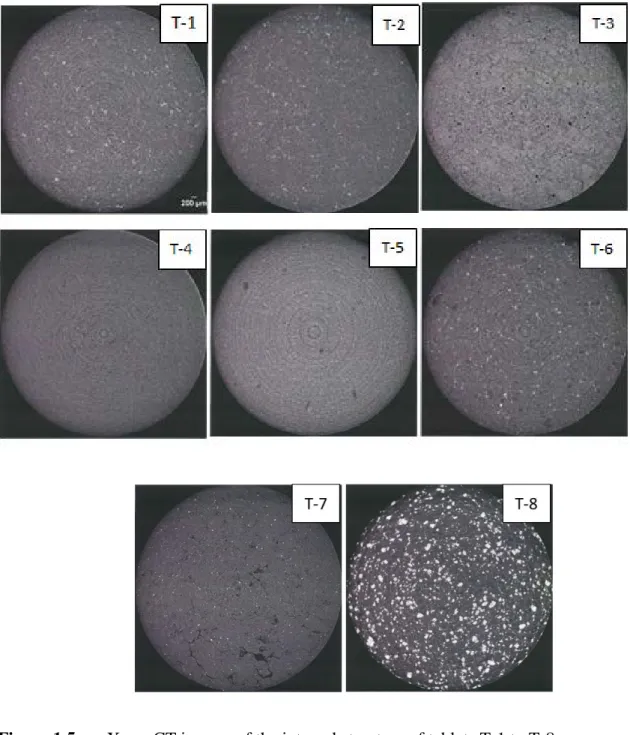
Next, samples T-1 to T-8 were examined by X-ray CT, as shown in Figure 1.5. Uniform granule powders and white spots were seen in images of the authentic products T-1 and T-2.
The white spots showed an elongated planar shape and were considered to be Magnesium
stearate (St-Mg), a known component of the authentic tablets. Magnesium has a high electron
density, and therefore has a higher X-ray absorption than the other components, so that St-Mg
is clearly visualized in the CT image. The CT image of generic product T-3 showed much
larger granules of non-uniform size and pores with a diameter of over 400 nm. Generic products
T-3 and T-4 did not show evidence of the presence of St-Mg. Generic product T-3 showed
aggregates with a diameter of 200-600
µm order. The model formulations T-5 and T-6 showeda uniform and smooth appearance, presumably due to the direct compression process without
granulation. However, the density unevenness resulting from the lack of enough mixing process
is confirmed by the color unevenness as in the black portion of the CT imaging. Also, in the CT
imaging of T-5 and T-6, the distribution of the larger particle as seen in T-1 and T-2 are not
confirmed.
23
The images data of falsified product T-7 showed many pores and cracks inside the tablets, suggestive of a poor manufacturing process. The image of falsified product T-8 shows a large amount of an unknown higher specific gravity component dispersed throughout the tablets.
1.4 DISCUSSION
Visual inspection of the appearance of a drug product is a critical test item for detecting the falsified products. However, in the present study, falsified products T-7 and T-8 showed a similar color to the authentic product T-2. Thus, instrumental methods are important to identify SFs.
Although the spectrum resolution of the handheld Raman instrument is only about one-tenth in
the comparison with the high resolution bench-top instrument, the handheld device is cheap and
easily portable for the field use, such as at the airports, customs, manufacturing sites in the
developing countries, owing to its small size. This instrument covers the required region of
2875cm
-1to 250 cm
-1to observe APIs and some excipients in the tablets. In this study, it was
found that the detection and discrimination of the falsified products of the product A were
achieved by using the handheld Raman instrument. Although the Raman spectra of tablets T-1
to T-6 were quite similar, the behavior of the repeatability in the same lot and the variation of
the p-value among the lots suggested that a criterion p-value of not more than 0.4 could be used
to discriminate SFs. The p-value was also clearly different among the original product A, the
24
generic products and the model formulations. This difference may be from the difference of the kind of and/or the grade of the excipients and the difference of the manufacturing process.
When the suspect sample is evaluated whether it is product A or not, the trend of the p-value should be considered.
Our results are in agreement with those of a research group in University of Washington (Kovacs et al., 2014), which compared various solutions for detecting SFs in LMICs and evaluated handheld Raman as one of the top solutions, offering multiple advantages, including no-need for sample preparation, high performance, speed, easy of use, low cost, no requirement for electricity supply. Further, handheld Raman technology can be employed without opening the PTP package, because the laser is focused on the tables, and the peaks from the plastic do not overlap the peaks of API. Therefore, this technology is particularly suitable for on-site inspection throughout the supply chain, such as at custom, posts, airports, and also in manufacturing sites.
The X-ray CT approach enables detailed examination of the internal structure of tablets. Many
voids were observed inside the falsified product T-7, while falsified product T-8 contained a
large amount of excipients with high electron density. Also, the physical mixture, T-5 and T-6
showed X-ray CT images that were clearly distinct from those of authentic product A,
reflecting the omission of the granulation process. Further, generic products which included the
same amount of API but contained different excipients and granules of the different sizes could
be easily distinguished. The results of X-ray CT of T-1 and T-2 suggested that the API is not
25
identified nor localized in a specific location in the tablets. This is one of the important information about the quality of T-1 and T-2 to discriminate the SFs from authentic samples.
Thus, the combination of Raman spectroscopy and X-ray CT can provide detailed information about API content and internal structure and uniformity of the tablet. At present the CT images have to be visually evaluated, but developments in equipment and software should make it possible to score images objectively in the future.
Overall, these results indicate that the combination approach of visual observation, handheld Raman and X-ray CT should be a powerful strategy for non-destructive discrimination of SFs.
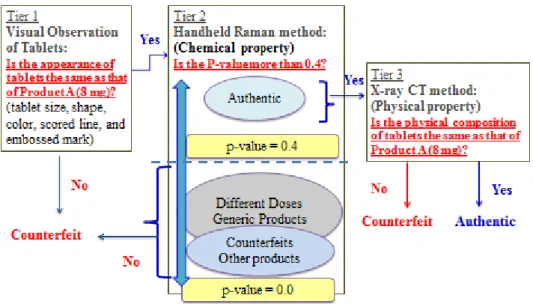
Figure 1.6 shows a decision tree for using these combination methods to discriminate the authenticity of samples purporting to be product A (8 mg). The first step is the visual observation of the tablet size, shape, color, scored line and embossed mark (Tier 1). Next, handheld Raman should be applied to identify the API and to detect differences of the kind of the excipients, based on the p-value (Tier 2). Generic products and different doses of product A should be discriminated at this point. Then, if necessary, the physical composition of the tablet can be investigated by X-ray CT (Tier 3). This combination approach should enable accurate detection of even falsified products that have very similar properties to the authentic products.
Further it should provide detailed information to assist in tracking the source of the falsified
products and for monitoring trends in SFs, as well as assessing the efficacy of regulatory
procedure.
26
1.5 REFERENCES
1. Pharmaceutical Security Institute, 2016 Available from:
http://www.psi-inc.org/geographicDistributions.cfm. Accessed June 19, 2016.
2. Yoshida N, Khan MH, Tabata H, Darath E, Sovannarith T, Kiet HB, Nivanna N, Akazawa M, Tsuboi H, Kimura K, BMC Pharmacology Toxicology 15, 13, (2014),
doi:10.1186/2050-6411-15-13
3. Natsumi Takahashi, Hirohito Tsuboi, Naoko Yoshida, Tsuyoshi Tanimoto, Mohiuddin
Hussain Khan, Kazuko Kimura, Therapeutics Innovation and Regulatory Science, 47(6), (2013), 699-705
4. Kazuko Kimura, Takayuki Honma, Tsuyoshi Tanimoto, Chisato Takao, Junko Okumura, Naoko Yoshida, Manabu Akazawa, The Journal of Health Care and Society, Vol.21(1), (2011), 55-67
5. Mohiuddin Hussain Khan, Junko Okumura, Tey Sovannarith, Nam Nivanna, Manabu
Akazawa, Kazuko Kimura, Tropical Medicine and International Health, 15(5), (2010), 639-644
6. Mohiuddin Hussain Khan, Junko Okumura, Tey Sovannarith, Nam Nivanna, Hiroto Nagai,
Masatoshi Tara, Naoko Yoshida, Manabu Akazawa, Tsuyoshi Tanimoto, Kazuko Kimura,
Pharmaceutical Research, 28 (3), (2011), 484-439
27
7. Newton PN, Proux S, Green M, Smithuis F, Rozendaal J, Prakongpan S, Chotivanich K, Mayxay M, Looareesuwan S, Farrar J, Nosten F, White NJ, Lancet 357, (2001), 1948-1950
8. Newton PN, Fernández FM, Plancon A, Mildenhall DC, Green MD, Ziyong L, Christophel EM, Phanouvong S, Howells S, Mcintosh E, Laurin P, Blum N, Hampton CY, Faure K, Nyadong L, Soong SWR, Santoso B, Zhiguang W, Newton J, Palmer K, PLoS Medicine 5, (2008), e32
9. Hall KA, Newton PN, Green MD, De Veij M, Vandenaabele P, Pizzanelli D, Mayfong M, Dondorp A, Fernández F, American Journal of Tropical Medicine and Hygiene, 75, (2006), 804-811
10. World Health Organisation, SSFFC medical products,
http://www.who.int/medicines/regulation/ssffc/definitions/en/. Accessed May 14, 2016 and
http://www.who.int/mediacentre/factsheets/fs275/en/. Accessed June 19, 2016.11. European Commission, Guidelines of 5 November 2013 on Good Distribution Practice of medicinal products for human use (2103/C 343/01)
12. Nicola Ranieri, Patricia Tabernero, Michael D. Green, Leigh Verbois, James Herrington,
Eric Sampson, R. Duane Satzger, Chindaphone Phonlavong, Khamxay Thao, Paul N. Newton,
and Mark R. Witkowski, American Journal of Tropical Medicine and Hygiene, 91(5), (2014),
920-924
28
13. P. de Peinder, M.J. Vredenbregt, T. Visser, D. de Kaste, Journal of Pharmaceutical and Biomedical Analysis, 47 (2008), 688-694
14. Sylwester Mazurek, Roman Szostak, Journal of Pharmaceutical and Biomedical Analysis, 40 (2006), 1225-1230
15. Sylwester Mazurek, Roman Szostak, Journal of Pharmaceutical and Biomedical Analysis, 48 (2008), 814-821
16. Ricci C, Eliasson C, Macleod NA, Newton PN, Matousek P, Kazarian SG, Analytical Bioanalytical Chemistry, 389, (2007), 1525-1532
17. Ricci C, Nyadong L, Yang F, Fernandez FM, Brown CD, Newton PN, Kazarian SG, Analytical Chemica Acta, 623, (2008), 178-186
18. Floyd E. Dowell, Elizabeth B. Maghirang, Facundo M. Fernandez, Paul N. Newton, Michael D. Green, Journal of Pharmaceutical and Biomedical Analysis 48 (2008), 1011-1014.
19. Marta B. Lopes, Jean-Claude Wolff, Analytica Chemica Acta, 633 (2009), 149-155.
20. O. Ye. Rodionova, A.L. Pomerantsev, Trends in Analytical Chemistry, Vol. 29, No. 8, (2010), 795-803
21. T. Puchert, D. Lochmann, J.C. Menezes, G. Reich, Journal of Pharmaceutical and
Biomedical Analysis, 51 (2010), 138-145
29
22. Frederic Been, Yves Roggo Klara Degardin, Pierre Esseiva, Pierre Margot, Forensic Science International, doi: 10.1016/j.forsciint.2011.04. 023, (2011)
23. Dong Xiang, Rosario Lobrutto, James Cheney, Busolo wa Wabuyele, Joseph Berry, Robbe Lyon, Huiquan Wu, Mansoor A. Khan, Ajaz S. Hussain, Applied Spectroscopy, 63(1), (2009), 33-47
24. Dong Xiang, Joseph Berry, Susan Buntz, Paul Gargiulo, James Cheney, Yatindra Joshi, Busolo Wabuyele, Huiquan Wu, Mazen Hamed, Ajaz S. Hussain, Mansoor A. Khan, Journal of Pharmaceutical Science, 98(3), (2009), 1155-1166
25. Jukka Rantanen, Eetu Räsänen, Jussi Tenhunen, Markku Känsäkoski, Jukka-Pekka Mannermaa, Jouko Yliruusi, European Journal of Pharmaceutics and Biopharmaceutics, 50, (2000), 271-276
26. T. De Beer, A. Burggraeve, M. Fonteyne, L.Saerens, J.P. Remon, C. Vervaet, International Journal of Pharmaceutics, 417, (2011), 32-47
27. Tomoko Kakio, Takashi Hiroshima, Yukihiro Ikeda, Journal of Pharmaceutical Machinery and Engineering, Vol. 23, No. 2 (2014)
28. Ann W. Newman and Stephen R. Byrn, Drug Discovery Today, Vol.8, No. 19, (2003)
29. Ulrike Holzgrabe, Myriam Malet-Martino, Journal of Pharmaceutical and Biomedical
Analysis, 55, (2011), 679-687
30
30. Yao-Chun Shen, International Journal of Pharmaceutics, 417, (2011), 48-60
31. P.-Y. Sacre, C. De Bleye, P.-F. Chavez, L. Netchacovitch, Ph. Hubert, E. Ziemons, Journal of Pharmaceutical and Biomedical Analysis, 101, (2014), 123-140
32. Gregory A. Stephenson, Robert A. Forbes, Susan M. Reutzel-Edens, Advanced Drug Derivery Reviews 48 (2001), 67-90
33. Svante Wold, Johan Trygg, Anders Berglund, Henrik Antti, Chemometrics and Intelligent Laboratory Systems, 58 (2001), 131-150
34. Dong Xiang, Michele Konigsberger, Busolo Wabuyele, Karl Hornung, James Cheney, Analyst (2009), 134, 1405-1415
35. Katherine A. Bakeev, Robert V. Chimenti, Pros and cons of using correlation versus multivariate algorithms for material identification via handheld spectroscopy, European
Pharmaceutical Review, from: http://www.europeanpharmaceuticalreview.com. Accessed Aug 30, 2013.
36. Stephanie Kovacs, Stephen E. Hawes, Stephen N. Maley, Emily Mosites, King Wong, Andy Stergachis, PLOS ONE| Volume 9, Issue 3, (March 2014), e90601
37. Pfizer Global Security, A serious threat to patient safety, Counterfeit Pharmaceuticals,
http://www.pfizer.com/files/products/CounterfeitBrochure.pdf. Accessed May 13, 2016.
31
38. Bruno C. Hancock, Matthew P. Mullarney, X-ray Microtomography of Solid Dosage Forms, Pharmaceutical Technology (April 01, 2005), from:
http://www.pharmtech.com/x-ray-microtomography-solid-dosage-forms-0. Accessed June 19,
2016.
39. Schneider, C.A., Rasband, W.S., Eliceiri, K.W., Nature Methods 9, (2012), 671-675
32
Figure 1.1. Visual inspection of tablets: T-1; authentic product A (4 mg), T-2; authentic product A (8 mg), T-3 and T-4; generic products from different Chinese manufacturers, T-5;
model formulation including API and lactose monohydrate, obtained by direct compression,
T-6; model formulation including API and the same excipients as in the authentic product A,
obtained by direct compression, T-7 and T-8; counterfeits found in Indonesia.
33
Figure 1.2. Raman spectra of the active pharmaceutical ingredients (API), Blopress tablets (2
mg), (4 mg), (8 mg), (12 mg), (16 mg) and Placebo.
34
Table 1.1 The results of handheld Raman examination of authenticity, based on the correlation of Raman spectra between test samples and the authentic product A (8 mg). The result of the instrumental judgment based on the p-value is also shown.
No. Category Sample Name (Active Ingredient Dose)
p-value Judgment
T-1 Authentic Product A (4 mg) 0.2332 pass
T-2 Authentic Product A (8 mg) 0.5045 pass
T-3 Generic Generic Product B (8 mg) from China
0.2645 pass
T-4 Generic Genetic Product C (4 mg) from China
0.1483 pass
T-5 Model formulation Direct compression of API (8 mg) and Lactose monohydrate
0.1348 pass
T-6 Model formulation Direct compression of API (8 mg) and all excipients
0.1040 pass
T-7 Falsified Product Falsified Product of product A (8 mg) from Indonesia
0.0000 fail
T-8 Falsified Product Falsified Product of product A (16 mg) from Indonesia
0.0000 fail
35
Figure 1.3. The Raman spectra of the API, lactose monohydrate (excipient) and the tablets.
The area surrounded by the dashed line covers the specific peak of API that does not overlap with the peaks of excipients. Other peaks are due to excipients, mainly from lactose
monohydrate. The Raman spectra of all tablets except the falsified tablets, which includes both API and lactose monohydrate are similar, but the falsified tablets (T-7 and T-8) show
distinctly different spectra.
36
Figure 1.4. Average p-values of authentic products calculated automatically by the handheld
Raman device for similarity to the authentic product A (8 mg). Repeatability of the p-value was
confirmed by ten replicate measurements. The range of the p-value from the maximum to the
minimum value is shown by a bar.
37
Figure 1.5. X-ray CT images of the internal structure of tablets T-1 to T-8.
38
Figure 1.6. Decision tree of combination approach for non-destructive discrimination.
39
Chapter II
Survey to Identify Substandard and Falsified Tablets in Several Asian
Countries with Pharmacopeial Quality Control Tests and Principal
Component Analysis of Handheld Raman Spectroscopy
40
ABSTRACT
The World Health Organization (WHO) has warned that substandard and falsified medical products (SFs) can harm patients and fail to treat the diseases for which they were intended, and they affect every region of the world, leading to loss of confidence in medicines, healthcare providers and health systems. Therefore, development of analytical procedures to detect SFs is extremely important. In this study, we investigated the quality of pharmaceutical tablets containing the antihypertensive candesartan cilexetil, collected in China, Indonesia, Japan, Myanmar, using the Japanese pharmacopeial analytical procedures for quality control, together with principal component analysis (PCA) of Raman spectra obtained with a handheld Raman spectrometer. Some samples showed delayed dissolution and failed to meet the pharmacopeial specification, while others failed the assay test. These products appeared to be substandard.
PCA showed that all Raman spectra could be explained in terms of two components: the concentration of the active pharmaceutical ingredient (API) and the kind of the excipient.
Examination of the PCA score plot indicated that the excipients of the substandard and falsified
tablets showed similar Raman spectra, in contrast to authentic products. The locations of
samples within the PCA score plot varied according to the source country, suggesting that
manufacturers in different countries employ different excipients. Our results indicate that the
handheld Raman device will be useful for detection of SFs in the field. PCA of that Raman data
clarify the difference in chemical properties between good quality products and SFs that
circulate in the Asian market.
41
2.1 INTRODUCTION
2.1.1 SF statement in WHO 2017
In May 2017, definitions of substandard and falsified medical products (SFs) were announced by the World Health Organization (WHO).
1Substandard medical products (also called “out of specification”) are authorized by national regulatory authorities, but fail to meet either national or international quality standards or specifications – or in some cases, both. On the other hand, falsified medical products deliberately or fraudulently misrepresent their identity, composition or source.
1-52.1.2 Survey on falsified medical products
Many surveys of falsified medical products and analytical procedures for investigation of the
authenticity of medical products have been reported by various public research institutes.
2-12In 2015, the Pharmaceutical Security Research Institute (PSI) reported that Asia experienced
the highest incidence of drug crime cases among seven regions in the world. In that year, a
total of 3,002 cases of drug crime were recorded, among which around 1,000 involved the
Asia-Pacific region.
13Many cases where defective products have been transported across
national borders have been reported.
1442
2.1.3 Survey of substandard medical products
Relatively little work has been done on analytical methods for investigating the actual status of substandard medical products, including their distribution, and their physical and chemical properties.
14-15One reason for this may be concern about the possibility of excessively hindering the development of medicines and access to medicines in developing countries.
16Also, regular quality control and surveillance of medicines after marketing tend to be more difficult in developing countries for various reasons, including high cost, the need for sophisticated equipment and skilled technicians, and lack of pharmacological knowledge to recognize the need for implementation of countermeasures.
6, 15, 17-19Further, medicines may be transported across national borders without proper quality checks through various distribution channels.
14,20These are serious issues to be taken measures, because SFs can cause treatment failure, development of antimicrobial resistance, and serious adverse drug reactions, thereby damaging public confidence in medicines.
2,21-222.1.4 Quality control by analytical procedures and acceptance criteria
The International Conference on Harmonisation (ICH) Q6A provides guidance to establish a
harmonized set of global specifications consisting of analytical procedures and acceptance
criteria for new drug substances (DS) and drug products (DP) for human use (1999).
23Specifications of DS and DP are proposed and justified by the manufacturer, and approved by
43
regulatory authorities in each country. The specifications and acceptance criteria are focused on those chemical, physical and biological properties considered to be important for ensuring the safety and efficacy of DS and DP. Thus, they can be adopted to identify substandard products. Possible issues include 1) out-of-specification content of API,
24-252) significant dissolution delay,
243) contamination with toxic substances,
26-27and 4) lack of sterility.
28-29These points can be checked by means of assay, content uniformity testing, measurements of dissolution properties and impurities, and microbial tests.
2.1.5 Sample Collection
Candesartan cilexetil tablets were collected in China, Indonesia, Japan and Myanmar, and subjected to quality control tests (assay, content uniformity and dissolution tests) according to the Japanese pharmacopeia. The acceptance criteria for these tests in the Japanese pharmacopeia were adopted as thresholds for identification of SFs.
2.1.6 Impact on quality by excipients
Many issues of quality and bioavailability are considered to be due to technical deficiencies
in the manufacturing process design and differences in the nature of the excipients
30-32.
Although many studies have shown that excipients influence quality, the excipients are not
44
generally stipulated in quality tests. Our previous study found that the types of excipients used in candesartan cilexetil tablets differ depending on the manufacturer, and Raman spectra of the tablets showed different patterns reflecting the chemical nature of the excipients.
332.1.7 Principal component analysis (PCA) of Raman spectra
Here, we focused on methodology for detecting substandard and falsified medicines by principal component analysis (PCA)
12,22,34-42of raw data obtained by handheld Raman
spectroscopy. We aimed to clarify the chemical features of substandard medicines by
comparing them with authentic medicines, and by extracting the principal components of the
Raman spectrum to visualize the relationships among the tablets. We chose the handheld
Raman device as a simple spectroscope suitable for the speedy, easy to use, robust and in-situ
observation in anywhere, and we employed PCA as a means to extract critical information
despite the limited resolution and sensitivity of the device. We also compared signal
preprocessing methods for PCA, and selected the MSC method as being particularly suitable
to extract the desired signals from the strong fluorescence background.
42This approach
proved highly effective to evaluate the degree of similarity among samples.
45
2.2 EXPERIMENTAL
2.2.1 Sample Collection
Authentic candesartan cilexetil tablets were supplied by a Japanese manufacturer as reference samples. Samples of candesartan cilexetil tablets were collected from hospitals and clinic in China, Indonesia and Myanmar, and also purchased via the internet (2009-2015).
2.2.2 Visual Inspection
46
First, we observed the outer package and package insert, PTP or Al-blister packaging. The product name, dose, component, formulation, packaging unit, manufacturer, manufacturing date, expiration date and manufacturing number were recorded. The cartons were examined visually and microscopically and compared to reference samples. Printing on the edge of the tape seal was carefully observed to check fine details.
2.2.3 Quality Control Test
Content uniformity
43, Assay and Dissolution tests of candesartan cilexetil tablets were conducted according to the Japanese pharmacopeia.
Acetonitrile (for high-performance liquid chromatography), polyoxyethylene 20, and sorbitan monolaurate (for biochemistry) were purchased from Wako Pure Chemical Industries, Ltd., and acetic acid and acenaphthene were purchased from Nacalai Tesque Co., Ltd. Candesartan cilexetil reference tablets were supplied by Takeda Pharmaceutical Co., Ltd.
2.2.4 Content Uniformity and Assay
Candesartan cilexetil in tablets were extracted in a mixture of acetonitrile and water (3:2), and
measurements were carried out at a wavelength of 305 nm using a spectrophotometer (U-3210,
Hitachi, Tokyo, Japan). Since the number of the collected samples was limited, 2, 3 or 10
47
tablets were used for each evaluation of content uniformity and the mean of the content was calculated as the result for assay. The acceptance criterion for the assay was set to 95.0-105.0%.
2.2.5 Dissolution
The dissolution test was performed under the conditions described for Apparatus 2 (paddle method) with 50 rpm agitation in 900 mL of a dissolution medium containing 10 w/v%
polyoxyethylene (20) sorbitan monolaurate at 37 °C. A sample was taken at the time point of 45 minutes, and examined by high-speed liquid chromatography (HPLC, L-7200 autosampler, D-7000 interface, L-7100 pump, L-7300 column, L-7405 UV detector, Hitachi, Tokyo, Japan).
Acenaphthene was added to the test solution as the internal standard. HPLC conditions: 5 μm ODS column (Shim-pack CLC-ODS (M) 4.6 mm × 15 cm, Shimadzu, Kyoto, Japan), flow rate 1.8 mL/min, column temperature 25 °C , injection volume 50 μL, detection wavelength 254 nm.
The mobile phase was a mixture of acetonitrile, water and acetic acid (57:43:1). The mean of the dissolution rates of 2, 3 or 6 tablets were evaluated, respectively. The criterion adopted was that the dissolution rate of candesartan cilexetil should be more than 75% at the 45-minute sampling point.
442.2.6 Handheld Raman Spectroscopy
48
All tablets were evaluated by the handheld Raman spectroscopy (TruScan®, Thermo Fisher Scientific). The chemical equivalent in structural component between the reference authentic products including 8 mg of API and the others were examined based on the similarity of the Raman spectra. The similarity of the Raman spectra between the authentic and the test tablets was calculated automatically as the p-value. The calculation algorithm for p-value in the handheld Raman spectroscopy is validated, not disclosed and designed not to be modified.
After the auto-judgment by the handheld Raman device, to investigate trend of the chemical properties of the candesartan cilexetil tablets using PCA, the raw data of the Raman spectra were extracted and investigated. To input the factor of the API in the Raman spectra to the PCA, in addition to measuring the collected tablets, the original authentic tablets including 0 mg (Placebo), 4 mg, 8 mg and 12 mg of the API were also measured with handheld Raman, respectively and applied to PCA. The weight and size of 4 mg, 8 mg and 12 mg tablets are equivalent, and same weights of each excipient except Lactose monohydrate to adjust total weights of them.
2.2.7 Preprocessing of Raman spectra
The data interval of the hand-held device is around 1.4 to 2.2 cm
-1, and the noise level is high,
so preprocessing of the spectroscopy spectra is critical for accurate PCA calculation. We used
the Savitzky-Golay (SG) method
45to smooth each segment of the original Raman spectrum in a
49
small window by fitting to a polynomial function
45-46. The multiplicative scattering correlation (MSC) method
46-49was also applied to eliminate baseline shift caused by the multiplicative shift of the baseline tilts and the additive shift of the baseline shifts up and down.
46-48MSC can utilize data from many wavelengths to distinguish between light absorption and light scattering, correcting spectra according to a simple linear univariate fit to a standard spectrum by means of least-squares regression using the standard spectrum. The observed spectrum
Y(ω)is considered to depend on wavelength as follows:
) e(
+ b ω+ a + ) Y(
= )
Y(ω ω ω
(1.2)
where
Y(ω)is the standard spectrum and
e(ω)represents the residual. a and b are adjusted in order to minimize the term e (ω), to make these discrete deviations as small as possible.
472.2.8 Principal component analysis (PCA)
Unscrambler® software (CAMO Software) was used for PCA. The Raman spectral data set
consisting of 85 samples and 476 wavenumbers was calculated and it was decomposed into a
linear combination of scores t
nand loadings p
nconsisting of several principal components,
allowing the spectrum to be understood clear with a limited number of principal components.
50
That is, the data set X is decomposed into a linear combination of the score and the loading as shown in equation 1.3 and the schematic figure below.
N N
p t p t p t p
t
+ + +=
Χ 1 1 2 2 3 3
(1.3)
The validity and robustness of the calculated PCA model were confirmed by cross-random validation.
2.3 RESULTS
More than fifteen brands of candesartan cilexetil tablets were available in China, as judged
from an internet survey, but only 4 brands were found to be distributed in hospitals and clinics
in Shanghai in China. The collected 7 samples of Japanese manufactures (Blopress), 3 kinds of
51
samples of Chinese manufactures (2 samples of
悉君宁, 4 samples of
维尔亚, 13 samples ofXINXIN in distributed in Shanghai in China were used for quality tests and PCA. In Mandalay in Myanmar, three brands, which are Blopress manufactured in Japan, Candelong-8 manufactured in India and Advant manufactured in Pakistan, were found in private hospitals, community pharmacies and wholesalers. No obvious deficiencies in the PTP packaging, package insert, pillows, or tablets were found in visual inspection of all collected samples.
Table 2.1 shows the summary of the results of dissolution, assay, contents uniformity and chemical similarity of candesartan cilexetil tablets.
2.3.1 Content Uniformity, Assay and Dissolution Behavior
Figure 2.1 summarizes the results of the dissolution test for the collected samples. Dissolution delay was confirmed in two samples of XINXIN candesartan cilexetil tablets, which failed to meet the criterion dissolution rate of more than 75% at 45 minutes. Other all samples met the criterion and was observed the enough dissolution at 45 minutes. Figure 2.2 summarizes the content uniformity and assay results for the collected samples.The assay values of 12 out of 13 samples of XINXIN candesartan cilexetil tablets exceeded the upper limit of 105.0%. The difference in assay of these samples was large (Max 112.8% to Min 104.4%) and the content un-uniformity was observed from the standard deviation among each sample up to Max 4.8%.
(see Tablet 2.1). Two samples of
悉君宁and one sample of Advant candesartan cilexetil tablets
52
gave an assay value below the lower acceptance limit of 95.0%. Other samples met the criterion of assay.
2.3.2 Handheld Raman spectroscopy and PCA
Raman spectra obtained with the handheld instrument are shown in Figure 2.3. The spectral features are mainly due to the API and excipients, including lactose monohydrate. The Raman spectra of the falsified products and XINXIN products showed a distinctive upward slope of the baseline toward high wavenumber. The API peak intensity in this region was reported to increase linearly with increase of API concentration in the tablets,
27and a similar result was also obtained in this study. These relationships of the quantitation between the API peak intensity and the assay of the API in tablet were also confirmed in not only the weight measurement of API in tablets vs the peak intensity of Raman spectra but the relationship between the weight measurements of API vs the peak intensity of X-ray diffraction measurement.
27These Raman spectra were conducted preprocessing and subjected to PCA in order to
investigate the similarity of chemical components among samples. Figure 2.4 shows the spectra
after the preprocessing of Savitzky-Golay method for smoothing and MSC method for baseline
correction for the Raman spectra. The calibration result and cross validation result in PCA
model were compared as shown in Figure 2.5. The result suggested that the difference among
53
the samples can be clarified by using the two principal components of PC1 and PC2 and the intensity change of Raman spectrum can be sufficiently expressed by PC1 and PC2. Therefore, the score plot was shown with the score of the PC1 and PC2 on the horizontal axis and the vertical axis, respectively for each tablet as shown in Figure 2.6. Data set of the Raman spectra in the range of 1780 to 1000 cm
-1, which includes peaks from the API and main excipients, showed the intuitive interpretation score plot in the PCA result. Tablets collected in Myanmar were distributed around authentic Blopress tablets in the score plot, suggesting that similar excipients were used in both cases. On the other hand, the tablets collected in China showed a wide distribution on the score plot, suggesting that different excipients were used by different manufacturers. Notably, XINXIN tablets were placed very far from the other tablets, and there was a high positive correlation in PC2 and the falsified products collected in Indonesia were located similarly in the plot. The falsified products including the API were plotted on the PCA score plot suggesting those tablets include around 60% assay of the dose (16 mg) displayed in the package. This result is agreement with the result of the assay measured by high performance liquid chromatography. In addition, both SFs contained almost the same amount of API, despite being labelled on the packages as having 8 mg and 16 mg, respectively, suggesting that these were falsified products with poor quality control.
Figure 2.7 shows the loading of each PC in the calculated PCA model. The contribution rates
were 84% of PC1, 7% of PC2 and 5% of PC3. PC2 was shown as a component extracted the
characteristics of the signal derived from API, while PC1 showed the characteristics of the
54
excipients of the lactose and others excipients in the wave number region of 1200 to 1000 cm
-1. PC3 appeared to be mainly due to lactose factor.
2.4 DISCUSSION
Candesartan cilexetil tablets distributed in China, Indonesia and Myanmar were made by
various manufacturers and contained different kinds of excipients. Testing identified a number
of samples with unacceptable API contents above or below the criterion limits of the Japanese
pharmacopeia, and others with excessive dissolution delay. Several products which meet the
criteria of the assay, CU and dissolution were plotted in the center on the PCA plot. The failed
samples which did not meet the criteria were all located far from the center position on the
PCA score plot. This PCA model was very effective to distinguish the products include the
different excipients, which appeared in different regions of the score plot and itwas able to
explain all spectra clearly with two components of the concentration of the medicinal
ingredient and the kinds of the excipients. The PCA result decomposed spectrum reflected the
elements of pure Raman spectrum on PC 2 without interference by background of strong
florescence substances. In this study, with an appropriate spectral preprocessing and PCA
combination, even in market research using a large amount of Raman spectrum of various
kinds of tablets including some unknown excipients, the elements of the API and the kinds of
the excipients are clearly extracted, and the similarity and correlation are clearly visualized.
55
A key feature of the present work was the use of the MSC method for Raman signal preprocessing. This method proved to be more effective than other commonly used methods, such as the second derivative and standard normal variate methods, for extracting the desired signals from the strong fluorescence background. It was found that how to extract the chemical information itself from the spectrum of the spectroscopic, not the experimental devices and methods, is a significant powerful and effective solution for detecting SFs. These results suggest that the handheld Raman device we used could be a useful tool to detect SFs in the field, despite its relatively low sensitivity and low resolution.
In conclusion, the combination of pharmacopeial quality control tests and PCA score plots calculated from Raman spectra proved to be very effective methodology for detecting SFs.
Application of this approach to candesartan cilexetil tablets collected in several Asian countries uncovered a number of examples of out-of-specification content and inadequate dissolution.
The handheld Raman device is expected to be useful in field surveys to detect SFs. PCA of that Raman data clarify the difference in chemical properties between good quality products and SFs that circulate in the Asian market.
2.5 REFERENCES
1. World Health Organisation (2017), http://www.who.int/medicines/regulation/ssffc/en/.
Accessed June 22, 2017.
56