Risk Evaluation Accuracy Using Telematics and Policyholdersʼ Coverage Selection: An Analysis Based on an Equilibrium Model
Yoshihiko SUZAWA
Abstract
This study aims to demonstrate the ef fect of accurate risk evaluation by Insur tech on the participantsʼ selection of insurance coverage, based on the canonical separating market equilibrium model. A precise risk evaluation through telematics will promote market efficiency by alleviating adverse selection and moral hazard of insureds. In reality, however, risk evaluation is not perfectly accurate even utilizing telematics and thus a certain cross-subsidy applies. The analysis reveals that low- risk individuals tend to purchase less coverage in case a cross-subsidy factor is embedded based on a constant ratio. Meanwhile, when cross-subsidy is factored into the premiums at a constant value, individuals are willing to be fully insured regardless of their risk characteristics.
Keywords: Risk evaluation, Insurtech, Telematics, Separating market equilibrium, Cross-subsidy
1. Introduction
Development of information technology permits the banking and security sectors to access new data sources and Big Data, artificial intelligence, cognitive computing, and predictive modeling, leading to a noticeable impact on financial operations; this value chain innovation is known as Fintech. The insurance sector is also increasingly impacted by a similar trend, and it has become recognized as Insurtech. This evolution is impacting every process of insurance operations, including product design, pricing, underwriting, marketing, distribution, and claims management.
1)Digitalization helps insurers design and price their insurance products; the growing proliferation of new data about insureds, collected via sensors and smart devices permits more granular underwriting of individual risks. Further, sophisticated analytics and predictive modeling connected with telematics devices allow insurers to
This study is financially supported by Japan Society for the Promotion of Science, Grant-in-Aid for Scientific Research
(C), No. 17K04018, and is based on the presentation at the Asia-Pacific Risk and Insurance Association 2019 Annual Conference. The author appreciates all valuable comments provided by the conference participants.
1) Swiss Re Institute (2017), pp.1-3
create insurance products and set premium rates based on accurate data relating to insuredsʼ behavior rather than inaccurate risk factors such as age, gender, or profession.
For example, insurers are introducing new automobile and medical insurance products utilizing telematics and wearable devices, which helps insurers continuously monitor insuredsʼ behavior by collecting data on aspects such as real-time driving mileage, driving area and time, walking distance, and personal fitness. Development of telematics and sensor-based pricing enables insurers to evaluate risk characteristics of exposures more accurately and to offer more segmented insurance coverage to individual applicants, using a risk-differentiated base. Consequently, insurers have to make decisions on how much they should individualize insurance coverage and price based on risk characteristics, considering the cost of underwriting and maintaining such insurance contracts. Policymakers should also design regulations on insurance premium rates and product development such that they preserve and support insurance availability. The extant literature on insurance, however, has not fully elucidated how Insurtech products and insurance regulations should be designed. Attempting to address this absence in the literature, this study focuses on the utility effects of accurate risk evaluation and analyzes the individualsʼ choice of insurance coverage based on the separating market equilibrium model.
2. Literature Motivating the Study
(1) Separating Market Equilibrium Model of Insurance
Many studies have theoretically and empirically analyzed the effect of risk classification in the private insurance market long before Insurtech products were introduced. Rothschild and Stiglitz (1976) constructed the separating market equilibrium model of insurance by expanding upon the precedent study by Arrow (1963).
2)They demonstrated a cost-ef fective process of categorizing applicants according to their risk character through self-selection when a variety of insurance coverage and premium options are offered by an insurer. This first model, however, was premised on a single-period contract and ignored the existence of competitors; thus, successive studies, including Wilson (1977) and Hoy (1982), refined the model by factoring the possibility of multi-period contracts and a competitive market environment.
3)Particularly, Hoy (1982) analyzes the cream-skimming mechanism and discussed that insurers may offer a combination of insurance coverage and premium that attracts low-risk individuals only, and they may selectively under write such preferable applicants in a cost- effective manner, resulting in undermined insurance availability and excessive risk segmentation
2) Rothschild and Stiglitz (1976), pp.629-649, Arrow (1963), pp.941-973.
3) Wilson (1977), pp.167-207. Hoy (1982), pp.321-336.
regardless of cost.
(2) Risk Classification in the Insurance Market
The effect of risk classification in the insurance market has been investigated based not only on the equilibrium model but also on other approaches. Harrington and Doepinghaus (1993) applied the hypothetical compensation model to test the accuracy of risk classification. According to their analysis, the utility for low-risk individuals increases by risk classification but that increase would be less than the utility loss for high-risk individuals because the cost of risk evaluation limits the premium discount, resulting in efficiency loss in the insurance market.
4)Crocker and Snow (1986) factored expense loadings into the actuarially-fair separating premiums and showed that the utility gain is obfuscated by the presence of risk evaluation costs.
5)Hoy (2006) analyzed the utility effect of a risk classification ban through regulatory intervention and indicated that intensified adverse selection would undermine market ef ficiency unless the number of high-risk exposures in the insurance contract portfolio was low.
6)Recent contributions utilizing the market equilibrium model include Dionne and Rothschild (2014), who indicated that any insurance applicants would willingly pay fair insurance premiums based on their risk and opt for full insurance coverage in case there was no information asymmetry between the insurer and the applicant.
7)Their findings imply that Insur tech can help an individual choose suf ficient insurance coverage regardless of risk characteristics as long as the insurer can accurately monitor the insuredʼs behavior without any costs.
(3) Telematics and Risk Evaluation
After telematics automobile insurance was introduced in the early 2000s, it began to attract both academic and practical interest. Edlin (2003) and Litman (2005) both mention that insurance telematics reduces unnecessary automobile driving but simultaneously impairs insurance availability for high-risk drivers.
8)Suzawa (2008) demonstrated that telematics can mitigate the negative effect of adverse selection and moral hazard while it may impose a cost burden on both policyholders and insurers.
9)Suzawa (2018) expanded the study to include medical insurance with wearable devices, and discussed the possibility that inaccuracy in determining risk evaluation and monitoring costs would reduce the
4) Harrington and Doepinghaus (1993), pp.59-84.
5) Crocker and Snow (1986), pp.321-344.
6) Hoy (2006), pp.245-269.
7) Dionne and Rothschild (2014), pp.184-221.
8) Edlin (2003), pp.53-82, Litman (2004), pp.35-53.
9) Suzawa (2008), pp.31-49.
efficacy of Insurtech.
10)The precedent literature, however, has not elaborated on the effect of telematics on the policyholdersʼ choice of insurance coverage thus far. The following sections, therefore, analyze the effect of accurate risk evaluation by Insurtech on the participantsʼ selection of insurance coverage, by expanding the canonical separating market equilibrium model that focuses on the utility change among individuals.
3. Analytical Approach
The analysis is based on the standard separating market equilibrium model of insurance, which has been employed by many studies, as referred to in the previous section. The model presumes some settings, as follows:
(i) The policyholder holds initial wealth of W in the no-loss state: S
1, and she incurs a loss of D (i.e., the wealth becomes W-D in the loss state S
2). D is parity among all policyholders.
(ii) The probability of loss varies among individual policyholders, indicated as p
ifor policyholder i.
( 1 ) Actuarially-Fair Premium Rates
Figure 1 graphically illustrates the model laid out on the S
1-S
2plane where Point A and Line F denote the uninsured state and fully-insured state, respectively. Insurance coverage is offered by private insurers with a variety from partial to full coverage options, from A to F. The insurer is risk-neutral and charges premium rates that depend on the expected loss (p
iD) and the coverage ratio chosen by the
10) Suzawa (2018), pp.79-100.
S
2R
1F
R
pR
nW-D A
D S
1S
1: No-loss State S
2: Loss State
W: Initial Wealth without Loss D: Amount of Loss
A: Uninsured State F: Fully-insured State
R
p: Pooled Fair Premium Rates for All Individuals
R
i: Separated Fair Premium Rates for Risk Category i
R
2R
4R
5R
3Figure 1. Fair Price of Separating Premium Rates
policyholder (r
i). When the insurer classifies policyholders into n groups according to the probability of loss (p
i), the actually-fair premiums rates (R
i) are defined as:
R
i= p
ir
iD, where p
1< p
2< p
3< ... < p
nThis is illustrated as a straight line from Point A to Line F with a coefficient p
i(1-p
i), as illustrated in Figure 1. The insurer breaks even by providing coverage along Line R
i, or can make a profit if the coverage offered is under that line.
( 2 ) Expected Utility of Policyholders
The expected utility of policyholders depends on the initial wealth (W), the wealth in the loss-state (W-D), and the probability of loss (p
i). Assuming that policyholders are economically rational and risk- averse, they prefer more generous and less expensive coverage, which means the option of insurance coverage falls in the upper right section above the S
1-S
2plane. The indifference curve of expected utility is described as a negatively sloped curve from the upper left to the lower right section of the plane.
Expanding upon the definition provided by Hoy (2006) and Dionne and Rothschild (2014),
11)the expected utility of an uninsured individual is derived as follows:
U(W, W-D, p
i) = (1-p
i)u(W)+ p
iu(W-D)
In case an individual purchases an insurance policy with a coverage ratio of r
i, she will receive an insurance payment of r
iD when a loss occurs. The wealth in the no-loss state (W
1), that at loss-state (W
2), and the expected utility (U) are defined as follows:
W
1= W-p
ir
iD; W
2= W-p
ir
iD-D+r
iD
⇒ U(W
1, W
2, p
i) = (1-p
i)u(W-p
ir
iD)+p
iu(W-p
ir
iD-D+r
iD)
The indifference curve of the policyholderʼs expected utility is identified by taking the derivative with respect to the summation of expected utility of the no-loss and loss states:
U
i:∂W
1/∂W
2=-[p
i∂U
i/∂(W-p
ir
iD)]/[(1-p
i)∂U
i/∂(W-p
ir
iD-D+r
iD)]
11) Hoy (2006), pp.248-249, Dionne and Rothschild (2014), p.187.
This is described as a convex curve toward the starting point as U
iin Figure 2. Reflecting the probability of loss (i.e., p
1< p
2< p
3<...< p
n,), the indifference curve of a lower-risk policyholder is steeper than that of a high-risk one. Among a variety of coverage options the insurer offers on or under the actuarially-fair premium line R
i, an individual opts for single insurance coverage to maximize her utility through the trial-and-error process on or over her own expected utility indifference curve U
i.
4. Canonical Implications from the Separating Equilibrium Model
The comparative utility approach has often been employed in relation to risk classification issues and rate-making regulator y designs in the insurance market.
12)The standard model implies that an individual will opt for full insurance coverage through the self-selection process as long as the insurer perfectly evaluates his risk level in a costless manner. Similarly, in case Insurtech allows the insurer to precisely evaluate the risk of each exposure and to provide him with an insurance policy at actuarially- fair premiums, the policyholders̶regardless of their risk characteristics̶are expected to purchase full insurance coverage and to minimize the basis risk.
In order to derive this expectation from the model, the following additional setting is configured for simplification:
12) Studies that employed the comparative utility approach include Hoy (2006) and Dionne and Rothschild (2014), referred to in section 2.
S
2U
1F
U
nW-L A
S
1W
U
i: Indifference Curve of the Expected Utility of Policyholder i U
2U
3U
4Figure 2. Indifference Curve of Pension Participants
(iii) There are only two types of individuals with respect to risk: low-risk and high-risk (denoted as type L and type H), and both types are composed of exactly the same number of individuals.
The premium rates applied to high-risk and low-risk individuals (R
Land R
H, respectively) are derived as follows:
R
L= p
Lr
LD, R
H= p
Hr
HD, where p
L< p
p< p
H, 0 < r
L<1, 0 < r
H<1
R
Land R
Hbecome symmetrical lines centering the pooled premium rates line (R
p) on the S
1-S
2plane as illustrated in Figure 3, because both age types consist of the same number of par ticipants. The insurance coverage is offered on or under R
Lfor the low-risk type and on or under R
Hfor the high-risk type.
The indifference curves for both risk types are also described on the S
1-S
2plane, and are given, respectively, as:
U
L:∂W
1/∂W
2= -[p
i∂U
L/∂(W-p
Lr
LD)] / [(1-p
L)∂U
L/∂(W-p
Lr
LD-D+r
LD)]
U
H:∂W
1/∂W
2= -[p
i∂U
H/∂(W-p
Hr
HD)] / [(1-p
H)∂U
H/∂(W-p
Hr
HD-D+r
HD)]
Reflecting the different probability of loss for both risk types, U
Lis described as a steeper curve than U
Has shown in Figure 3, and an individual chooses a coverage option located on or over his own expected utility indifference curve. Consequently, the wealth in the no-loss state (W
1), that in the loss state (W
2), and the expected utility for both risk types (U
L) and (U
H) are defined as follows:
W
1= W-p
Lr
LD, W
2= W-p
Lr
LD-D+r
LD
⇒ U
L(W
1, W
2, p
L) = (1-p
L)u(W-p
Lr
LD)+p
Lu(Wp
Lr
LD-D+r
LD) W
1= W-p
Hr
HD, W
2= W-p
Hr
HD-D+r
HD
⇒ U
H(W
1, W
2, p
H) = (1-p
H)u(W-p
Hr
HD)+p
Hu(W-p
Hr
HD-D+r
HD)
U
Land U
Hare both maximized when r
L=1 and r
H=1 because all actuarially-fair premium rates (R
Land R
L) are defined depending on the probability of loss (p
Land p
H). Low-risk individuals opt for
insurance coverage on Point O
Land high-risk ones do so on Point O
H;both are on Line F, denoting full
insurance coverage. As far as Insurtech perfectly complements the information asymmetry between the
insurer and the policyholder, individuals regardless of risk type willingly purchase a full coverage option
at actuarially-fair premium rates and thus will not be exposed to basis risk.
5. Policyholdersʼ Choice under Imperfect Information
Insurtech will obviously help insurers collect a large amount of risk-related data in real time and evaluate risk individual exposures more precisely. However, currently, data collected through telematics or wearables are limited to driving mileage, the insuredʼs whereabouts, and walking distance. These factors are correlated with the frequency and severity of automobile accidents, injury, or illness, but do not perfectly represent the expected loss. In addition, regulations may prohibit the usage of certain sorts of risk factors because of privacy and social acceptability reasons. The residual information imperfection and asymmetry still exist and the cross-subsidy is allowed even for Insurtech products.
Thus, we must consider other cases where an insurer cannot perfectly evaluate the risk of each exposure and premium rates are applied on the partially cross-subsidized base.
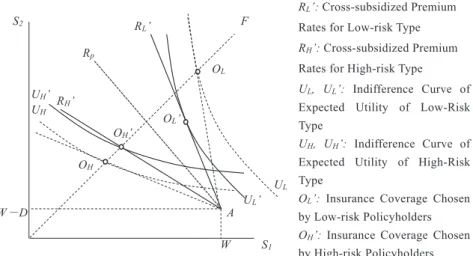
(1) Cross-Subsidy Factor with Constant Ratio
First, consider a case where the cross-subsidy factor s is a constant ratio of actuarially-fair premiums; the premiums for low-risk individuals are increased and those for high-risk ones are discounted from the actuarially-fair premium rates. The premium rates charged from the low-risk and high-risk policyholders are defined as p
Lr
LD(1+s) and p
Hr
HD(1-s), respectively. Thus, W
1and W
2, as well as U
Land U
Hare defined as follows:
S
2F
R
pO
LO
HW㸫D A
W S
1R
L: Separated Fair Premium Rates for the Low-risk Type
R
H: Separated Fair Premium Rates for the High-risk Type
U
L, U
L’: Indifference Curve of Expected Utility for the Low-risk Type
U
H, U
H’: Indifference Curve of Expected Utility for the High - risk Type
O
L: Insurance Coverage Chosen by Low-risk Policyholders O
H: Insurance Coverage Chosen by High-risk Policyholders R
LU
L’ U
LU
HU
H’
R
HFigure 3. Policyholdersʼ Choice under Perfect Information
W
1= W-p
Lr
LD(1+s), W
2= W-p
Lr
LD(1+s)-D+r
LD
⇒ U
L(W
1, W
2, p
L) = (1-p
L)u[W-p
Lr
LD(1+s)]+ p
Lu[W-p
Lr
LD(1+s)-D+r
LD]
W
1= W-p
Hr
HD(1-s), W
2= W-p
Hr
HD(1-s)-D+r
HD
⇒ U
H(W
1, W
2, p
H) = (1-p
H)u[W-p
Hr
HD(1-s)]+p
Hu[W-p
Hr
HD(1-s)-D+ r
HD]
From the definitions where s > 0, the expected utility of a low-risk individual U
L, U
Lis maximized when r
L<1, and r
Lchosen by the policyholder decreases as s increases. The more the cross-subsidy that is factored into the premiums, the less is the insurance coverage the low-risk person chooses. In the meantime, the expected utility of a high-risk individual (U
H, U
H) is maximized when r
H㲓 1, which means high-risk individuals willingly purchase an insurance product at full or close-to-full coverage. This is observable in Figure 4 where the premium rates (R
Land R
H) shift inward from the original actuarially- fair premium lines round on Point A, indicating s with a positive value. The indifference cur ve of expected utility of low-risk policyholders (U
L) is at the highest position at Point O
L, which is under Line F denoting partial insurance coverage, while U
His the highest at O
Hand a high-risk person chooses full insurance coverage.
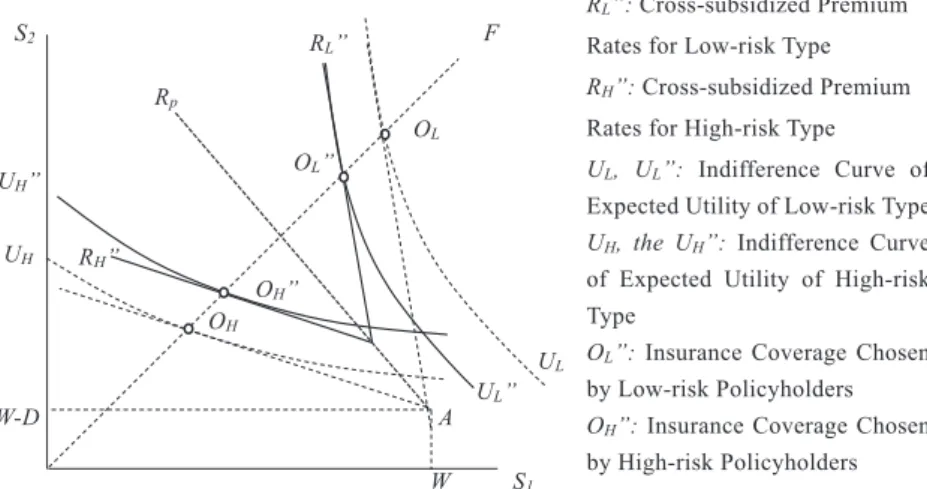
( 2 ) Cross-Subsidy Factor with Constant Value
Consider another case where the cross-subsidy factor s is a constant value and is factored into actuarially-fair premium rates; the premium rates charged from the low-risk and high-risk policyholders are defined as (p
Lr
LD+s ) and (p
Hr
HD-s ), respectively. W
1and W
2as well as U
Land U
Hare derived as:
S
2F
R
pO
LR
H’
O
L’ O
H’ O
HW㸫D A
W S
1R
L’: Cross-subsidized Premium Rates for Low-risk Type R
H’: Cross-subsidized Premium Rates for High-risk Type
U
L, U
L’: Indifference Curve of Expected Utility of Low-Risk Type
U
H, U
H’: Indifference Curve of Expected Utility of High-Risk Type
O
L’: Insurance Coverage Chosen by Low-risk Policyholders O
H’: Insurance Coverage Chosen by High-risk Policyholders R
L’
U
HU
H’
U
LU
L’
Figure 4. Cross-Subsidy of Constant Ratio and Policyholdersʼ Coverage Selection
W
1= W-(p
Lr
LD+s ), W
2= W-(p
Lr
LD+s )-D+r
LD
⇒ U
L(W
1, W
2, p
L) = (1-p
L)u[W-(p
Lr
LD+s )]+ p
Lu[W-(p
Lr
LD+s )-D+r
LD]
W
1= W-(p
Hr
HD-s ), W
2= W-(p
Hr
HD-s )-D+r
HD
⇒ U
H(W
1, W
2, p
H) = (1-p
H)u[W-(p
Hr
HD-s )]+p
Hu[W-(p
Hr
HD-s )-D+ r
HD]
The high-risk individual still opts for full or close-to-full insurance coverage because U
H, U
His maximized when r
H㲓 1. As for the low-risk individual under this condition, the expected utility U
L, U
Lcan be also maximized when r
L㲓 1. In addition, r
Lchosen by the policyholder is unaffected by the value of s . The premium rates for both risk types (R
Land R
H) make a parallel shift from the actuarially-fair premiums as described in Figure 5 because s is a constant positive value. The indifference curves of expected utility of low-risk and high-risk persons (U
Land U
H) both trace the highest curve via Point O
Land Point O
Hon Line F denoting full insurance coverage. It is implied, from the analysis, that policyholders are willing to pay cross-subsidized premium rates to purchase full insurance coverage as long as the cross-subsidy factor is embedded on a constant-value base.
6. Summary and Implications
Insurtech is significantly impacting the insurance industr y and is engendering innovation in product development, pricing, and underwriting. By utilizing telematics and wearable devices, insurers can evaluate the risk characteristics of insured exposures and re-classify those exposures more precisely than in the case of traditional insurance contracts. Insurtech is thus expected to address
S
2F
R
pO
LO
L”
R
H”
O
H” O
HW-D A
W S
1R
L”: Cross-subsidized Premium Rates for Low-risk Type R
H”: Cross-subsidized Premium Rates for High-risk Type
U
L, U
L”: Indifference Curve of Expected Utility of Low-risk Type U
H, the U
H”: Indifference Curve of Expected Utility of High-risk Type
O
L”: Insurance Coverage Chosen by Low-risk Policyholders O
H”: Insurance Coverage Chosen by High-risk Policyholders R
L”
U
HU
H”
U
LU
L”
Figure 5. Cross-Subsidy of Constant Value and Policyholdersʼ Coverage Selection
information asymmetry relating to the risk attribute and contribute to alleviating adverse selection and moral hazard. In reality, however, data on risk factors collected through Insurtech are limited; such risk factors include the driving area, time and mileage for automobile insurance, the insuredʼs whereabouts, and walking distance for medical insurance. Therefore, risk evaluation is not yet precise at present, and cross-subsidy is factored into the premium rates; low-risk policyholders are imposed with a surcharge in addition to the actuarially-fair separating premiums, and high-risk policyholders can avail a discount with regard to separating premiums.
This study analyzes how the policyholderʼs choice of insurance coverage will be affected by the accuracy or inaccuracy of risk evaluation using Insurtech, based on the separating equilibrium model of the insurance market. The analysis reveals that low-risk policyholders tend to opt for partial insurance coverage in a case where the cross-subsidy factor is embedded as a constant ratio of actuarially-fair premiums. In addition, the more cross-subsidy a factor has, the less is the insurance coverage low-risk policyholders choose; as a result, they may be exposed to significant basis risk. The analysis also demonstrates that policyholders are willing to be fully insured regardless of risk characteristics when the cross-subsidy is factored into actuarially-fair premium rates as a constant value. These results will help insurance industry managers to design the premium rates structure of Insurtech products using a constant-value cross-subsidy base in order to attract all potential policyholders regardless of their risk characteristics in a cost-ef ficient manner. The study also provides information for insurance policymakers about the regulatory framework pertaining to insurance ratemaking. Risk classification with a cross-subsidy on a constant-ratio base should be banned or restricted, to promote individualsʼ participation in insurance utilizing Insurtech.
References
Arrow, K. (1963)
“Uncertainty and the Welfare Economics of Medical Care,
”American Economic Review, Vol. 53, No.5, pp. 941-973.
Crocker, K. and A. Snow (1986)
“The Efficiency Effects of Categorical Discrimination in the Insurance Industr y,
”Journal of Political Economy, Vol. 94, No.21, pp.321-344.
Dionne, G. and C. Rothschild (2014)
“Economic Effects of Risk Classification Bans,
”The Geneva Risk and Insurance Review, Vol. 39, No.2, pp.184-221.
Edlin, A. (2003)
“Per-Mile Premiums for Auto Insurance
”in Economics for an Imperfect World, edited by Arnott, R., B.
Greenwald, R. Kanbur and B. Nalebuff, The MIT Press, pp.53-82.
Harrington, S. and H. Doepinghaus (1993)
“The Economics and Politics of Automobile Insurance Rate Regulation,
”Journal of Risk and Insurance, Vol. 60, No.1, pp.59-84.
Hoy, M. (1982)
“Categorizing Risks in the Insurance Industry,
”Quarterly Journal of Economics, Vol. 97, No.2, pp.321-
336.
Hoy. M. (2006)
“Risk Classification and Social Welfare,
”The Geneva Paper on Risk and Insurance
―Issue and Practice, Vol. 31, No.2, pp.245-269.
Litman, T. (2005)
“Pay-As-You-Drive Pricing and Insurance Regulatory Objectives,
”Journal of Insurance Regulation, NAIC, Vol. 23, No.3, pp.35-53.
Rothschild, M. and J. Stiglitz (1976)
“Equilibrium in Competitive Insurance Markets: An Essay on the Economics of Imperfect Information,” Quarterly Journal of Economics, Vol. 90, No.4, pp.629-649.
Suzawa Y. (2008)
“Economic Analysis on New Automobile Insurance Applying Satellite Communications Technology,
”Journal of Insurance Science, No.602, pp.31-49 (written in Japanese).
Suzawa Y. (2018)
“Improved Risk Evaluation and Policyholders Insurance Choice,
”Songai-hoken Kenyu (Journal of Non-life Insurance Science), Vol. 80, No.3, pp.79-100 (written in Japanese).
Wilson, C. (1977)
“A Model of Insurance Markets with Incomplete Information,
”Journal of Economic Theory, Vol. 16, No.2, pp.167-207.
Swiss Re Institute (2017) Technology and Insurance: Themes and Challenges, pp.1-3.
テレマティクスによる精緻なリスク評価が保険契約者の選択に与える影響
―市場均衡モデルに基づく分析―
諏澤 吉彦
要旨
本稿は,インシュアテックの試みの一つとして試行されている,テレマティクスによる精緻なリスク評価が,保険 契約者の選択にどのような影響を及ぼすのかを,標準的な保険市場の分離均衡モデルに基づいて明らかにしようとした ものである.テレマティクスによる被保険者のリスク評価の精緻化は,逆選択やモラルハザードの緩和により,保険市 場の効率性を向上させることが期待される.しかし実際には,テレマティクスを用いても完全なリスク評価は現在のと ころ不可能であり,低リスク者から高リスク者への一定の保険料内部補助が残存すると考えられる.分離均衡モデルに 基づく分析結果からは,内部補助要素が期待損失に対して定率で保険料に算入された場合に,高リスク者は十分な保障 を伴う全部保険を選択するのに対して,低リスク者は一部保険を選好し,それが高率となれば,過小な保障を伴う保険 契約しか選択しないおそれがあることが明らかとなった.いっぽうで,内部補助要素が定額で保険料に算入された場合 には,その金額に関わらず,高リスク者,低リスク者ともに,全部保険が選択されることがわかった.
キーワード:インシュアテック,テレマティクス,リスク評価,分離均衡モデル,保険料内部補助