RELATIONSHIP BETWEEN SEVERITY OF CORONARY ARTERY STENOSIS AND OF CALCIFICATION AND CKD : COMPARISONS
OF CT CORONARY ANGIOGRAPHY WITH EGFR IN PATIENTS WITH CARDIOVASCULAR DISEASE
Osamu Yasuda1), Ken-ichi Matsuda1) and Hiroshi Ito2) (received 13 October, 2010, Accepted 26 November, 2010)
1)Department of Internal Medicine, Ugo Town Hospital, Akita 012-1131, Japan
2)Department of Cardiovascular and Respiratory Medicine, Akita University Graduate School of Medicine, Akita 010-8543, Japan
Abstract
To investigate the relationship between chronic kidney disease (CKD) and the severity of coro- nary artery stenosis and of calcification, we compared estimated glomerular filtration rates (eGFR) with coronary stenosis and coronary artery calcification scores (CACS) assessed by CT coronary angiography in 300 patients (146 men, 154 women ; average age, 68.8 y). Among these, 275 as- sessable patients were classified according to stenosis rates of <25%, 25-49%, 50-74% and ≥75%
as normal coronary arteries (n=129) and slight (n=50), moderate (n=39) and severe (n=57) ste- nosis, respectively. They were also classified by total CACS of 0, 0.1-100, 101-399 and ≥400 as having non-calcification (n=93), slight (n=79), moderate (n=50) and severe calcification (n=53), respectively. The average (± standard deviation) eGFR values of the groups with normal arter- ies, slight, moderate and severe stenosis were 81.86±20.10, 76.29±19.51, 76.59±19.83 and 66.83
± 17.75, respectively. Those of the groups with non-calcification, slight, moderate and severe calcification were 80.76±17.53, 79.46±23.06, 72.69±20.65 and 70.84±17.76, respectively. Our findings indicated that CKD might cause coronary stenosis and calcification to be severe.
Key words : CKD, eGFR, coronary calcification, coronary stenosis, CT coronary angiogra- phy
Introduction
Hypertension (HT), diabetes mellitus (DM) and dyslip- idemia (DL) are traditional coronary risk factors that are closely associated with the progression of coronary ar- tery calcification (CAC) and stenosis. Coronary stenosis
is a main cause of the development of cardiovascular dis- ease (CVD) and CAC is an important background of ste- nosis. Furthermore, atherosclerosis is a main cause of CAC and the degree of CAC correlates with the severity of atherosclerosis1,2). Chronic kidney disease (CKD) is a lifestyle-related disease that is similar to metabolic syn- drome, and it is an important condition in preventive medicine as it is a considerable risk factor for CVD.
High rates of CKD are associated with the development and mortality of myocardial infarction, congestive heart failure and cerebral infarction3-9). Thus, CKD should be prevented and treated like conventional coronary risk Correspondence : Osamu Yasuda
Department of Internal Medicine, Ugo Town Hospital, Akita 012-1131, Japan
Tel : 81-183-62-1111 Fax : 81-183-62-4110 E-mail : y-6734@ugo-h.jp
Coronary stenosis and coronary calcification versus CKD
(28)
factors to prevent CVD. Computed tomography (CT) coronary angiography (CTCA) using multidetector-row CT (MDCT) has recently become a popular diagnostic tool for imaging the coronary arteries. Low invasive- ness and excellent quality images are features of CTCA, which along with conventional coronary angiography (CAG) equals the utility of coronary imaging in diagnos- ing coronary artery disease10-14). Furthermore, evalua- tions of CAC with coronary plane CT using MDCT or electron beamed CT is useful screen for ischemic heart disease15-19). The present study investigates the rela- tionship between CKD as a novel risk factor for CVD and the severity of coronary stenosis and CAC. Here, we compared estimated glomerular filtration rates (eGFR) with coronary stenosis and CAC scores (CACS) assessed by CTCA in patients who were diagnosed or suspected as CVD.
Methods Patients
We enrolled 300 consecutive patients (male/female, 146/154 ; average age ± standard deviation (SD) of all patients, 68.8±10.8 y ; men, 67.4±11.2 y ; women, 70.2
±10.1 y) who underwent CTCA using 64-row CT, Aqulion (Toshiba, Tokyo, Japan) between January 4th, 2007 and February 16th, 2010. All male and female pa- tients were respectively classified by age decade as fol- lows : 20s (n=0 and 1), 30s (n=3 and 0), 40s (n=6 and 4), 50s (n=25 and 18), 60s (n=41 and 37), 70s (n=55 and 64), 80s (n=15 and 30) and 90s (n=1 and 0). They comprised 20 patients with old myocardial infarction ; 183 with angina pectoris ; 31 at silent high risk with over three conventional coronary risk factors such as HT, DL, DM, or family history (FH) of CVD and smoking ; 56 with atypical chest pain without detectable ischemic change ; and 10 with other conditions.
Assessment of coronary stenosis using CTCA Coronary stenosis was assessed from CTCA images using a Workstation and the analyzing coronary artery software, ZIOSOFT M900 (Amin, Tokyo, Japan), volume rendering and curved multiplanar reformation (curved- MPR). Images were visually assessed for coronary ste-
nosis at our hospital by the consensus of two physicians and one radiologist. All patients were classified into groups according to rates of stenosis in the major coro- nary arteries that were amenable to percutaneous coro- nary intervention (PCI) as follows. Normal coronary ar- teries, slight, moderate and severe stenosis were classified as <25%, 25-49%, 50-74% and ≥75% stenosis, respectively (Fig. 1). Patients who had already under- gone PCI before CTCA were considered as having severe stenosis regardless of the CTCA findings. Normal coro- nary arteries and slight, moderate and severe stenosis were scored by CT as 1, 2, 3 and 4, respectively. These CT scores were summed for each group according to re- nal function. We respectively compared the average values of eGFR and the ratios of patients with CKD in each stenosis group.
Assessment of CACS
Cardiac plane CT was performed during one maximal breath with consecutive scans under the following condi- tions : slice width, 3 mm ; slice intervals, 3 mm ; scan range between the base and the apex of heart, 90 mm.
We calculated CACS from CT images using a workstation with the CACS analysis software, ZIOSOFT M900, ac- cording to Agatston’s method15) as follows. We estab- lished regions of interest (ROI) for CAC in each scanned slice and considered a CT number of ≥130 Hounsfield units (HU) and an area of ≥0.51 mm2 (2 pixels) as signifi- cant calcification. Furthermore, all ROI with significant calcifications were scored as numbers according to maxi- mal CT ranges of 130-199, 200-299, 300-399 and ≥400 HU as 1, 2, 3 and 4, respectively. The CACS for the ROI were calculated by multiplying the calcification area by the score. The total CACS in patients were calculat- ed by summing all CACS of the calcification areas. Total CACS for the patients with PCI were assessed without calculating the CACS for coronary stent areas. All as- sessable patients were classified into groups according to total CACS as follows. Absent, slight, moderate and se- vere calcification were classified as total CACS of 0, 0.1- 100, 101-399 and ≥400, respectively. Moreover, absent, slight, moderate and severe calcification were graded as 1, 2, 3 and 4, respectively. These CAC grades were used included in multiple regression analysis of CAC and
Akita University
coronary risk factors.
Calculation of eGFR and patient classification according to renal function
The standard for evaluating GFR is inulin clearance, which is very difficult to measure. Therefore, eGFR (ml/min/1.73 m2 ; units are omitted from subsequent val- ues, which are shown as numbers) is used as a substitute for GFR in routine clinical practice. It is a standard mo- dality for diagnosing CKD that depends on age, serum creatinine and sex20,21). We calculated eGFR values for assessable patients using the portable computer, J Pocket Clearance 2008 (Kureha, Tokyo, Japan) which measures Japanese eGFR21). We also measured serum creatinine using an enzymatic method and the automated analytical instrument, 80FRNEO2 (Toshiba, Tokyo, Japan) before performing CTCA. We classified CKD stages in assess-
able patients according to eGFR values of ≥90, 60-90 and <60 as normal renal function equivalent to CKD stage 1 or high risk, slight renal dysfunction equivalent to CKD stage 2 and CKD equivalent to CKD stage 3-5, re- spectively. We compared the average CT scores and the total CACS in each of the renal function groups.
Definition of coronary risk factors in this study We defined the traditional coronary risk factors in this study such as increase age (IA), HT, DM, DL (hyper-low density lipoproteinemia [LDL] or hypo-high density lipo- proteinemia [HDL]), smoking and FH of CVD, because considerable evidence has established that these factors associated with CVD22-29). Diagnosing standards as posi- tive IA, HT, DL and DM were respectively male age ≥45 y, female age ≥55 y, systolic blood pressure ≥140 mmHg, diastolic blood pressure ≥90 mmHg, LDL ≥140 mg/dl, Fig. 1. Curved-MPR images of coronary arteries with coronary stenosis visually evaluated with CTCA using MDCT. Stenosis rates of <25%, 25-49%, 50-74% and ≥75% are classified as normal coronary artery and slight, moderate and severe stenosis, respectively.
Coronary stenosis and coronary calcification versus CKD
(30)
HDL <40 mg/dl, HbA1c ≥5.8% and patients with who had previously received treatment for these risks before CTCA regardless of measured values. Information about these conventional risk factors and CKD (eGFR
<60) was obtained from all assessable patients by anam- neses, consultation findings, chest X-rays, ECG, blood biochemical test and ultracardiography findings before CTCA. We investigated the degrees to which the seven risk factors contributed to the severity of stenosis and of calcification.
Statistical analysis
Data were analyzed using Stat View 5.0 or Windows Excel 2003 software. Average differences between two groups were compared using a t-test when the analysis of variance (ANOVA) indicated significant differences in all populations. Significant differences in ratios between two groups were compared using Ryan’s method after significance in all populations was determined using the χ2 test with a contingency table. We investigated the re- lationship between each risk factor and the severity of coronary stenosis and of CAC using multiple regression analysis as follows. We analyzed the independent dum- my variables comprising the seven risk factors assessed as positive or negative, and 1 or 0, and dependent vari-
ables as CT scores and CAC grades. A value of p<0.05 indicated significant difference.
Results
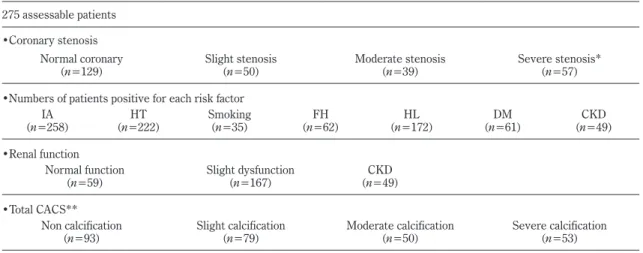
1. Classifications of 275 assessable patients Among 300 patients, coronary stenosis could not be evaluated in 15 due to significant calcification, motion ar- tifacts and insufficient coronary artery enhancement, and 10 had peripheral artery stenosis or lateral branch steno- sis that would not be amenable to PCI. These 25 pa- tients were considered as not assessable. Table 1 shows 275 assessable patients were respectively classified by stenosis rate, the numbers of patients positive for each risk factor, renal function and total CACS. 275 assess- able patients comprised 129 with normal coronary arter- ies, 50 with slight, 39 with moderate and 57 with severe stenosis, including 41 who had undergone PCI. We also respectively classified the 275 patients were by the num- bers of patients positive for each risk factor as : IA (n=
258), HT (n=222), Smoking (n=35), FH (n=62), DL (n=
172), DM (n=61) and CKD (n=49). Moreover, the as- sessable patients comprised 59 with normal renal func- tion, 167 with slight renal dysfunction and 49 with CKD. They also comprised 93 without calcification, and
Table 1. Classifications of 275 assessable patients.
275 assessable patients
•Coronary stenosis Normal coronary
(n=129) Slight stenosis
(n=50) Moderate stenosis
(n=39) Severe stenosis*
(n=57)
•Numbers of patients positive for each risk factor
(n=258)IA HT
(n=222) Smoking
(n=35) FH
(n=62) HL
(n=172) DM
(n=61) CKD
(n=49)
•Renal function Normal function
(n=59) Slight dysfunction
(n=167) CKD
(n=49)
•Total CACS**
Non calcification
(n=93) Slight calcification
(n=79) Moderate calcification
(n=50) Severe calcification
(n=53) Among 300 patients, 25 patients were considered as not assessable. 275 assessable patients were respectively classified by stenosis rate, the numbers of patients positive for each risk factor, renal function and total CACS. * : Including 41 patients who had undergone PCI. ** : Total CACS for the patients with PCI were assessed without calculating the CACS for coronary stent areas.
Akita University
79, 50 and 53 with slight, moderate and severe calcifica- tion, respectively.
2. Comparisons of renal function with coronary stenosis
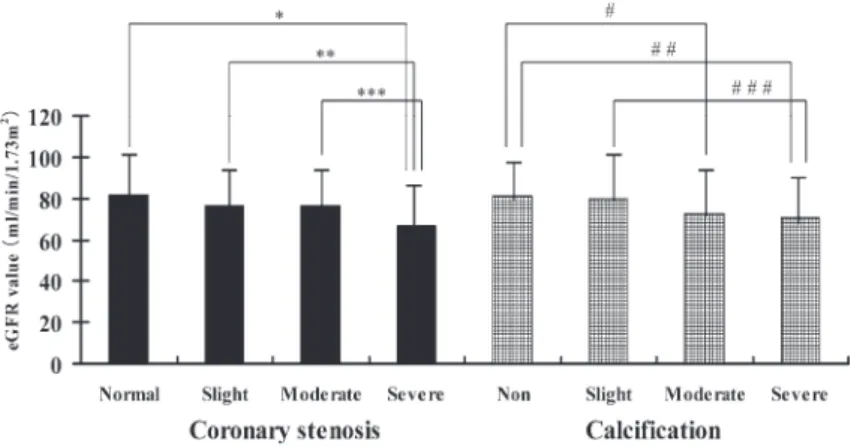
The average ± SD of the eGFR values of the groups with normal coronary arteries, and with slight, moderate and severe stenosis were 81.86±20.10, 76.29±19.51, 76.59±19.83 and 66.83±17.75, respectively (Fig. 2).
The value with PCI was 66.10±18.86. The SD values were large, indicating wide variation in the eGFR values for each of the stenosis groups. Nevertheless, increas- ing stenosis rates were associated with decreasing aver- age eGFR values. Significant differences were found between the group with severe stenosis and those with
moderate and slight stenosis, and normal coronary arter- ies. (ANOVA ; p=0.01, 0.007 and <0.0001, respective- ly). Figure 3 compares ratios of patients with CKD in each stenosis group. The ratios of CKD of the groups with normal coronary arteries, and with slight, moderate and severe stenosis were 9.3% (12/129), 24.0% (12/50), 17.9% (7/39) and 31.6% (18/57), respectively. Signifi- cant differences were found between the groups with normal coronary arteries and slight as well as severe ste- nosis (Ryan’s method ; p<0.05). Figure 4 shows that the average ± SD of CT scores of the groups with normal and slight renal dysfunction and CKD were 1.81±1.05, 2.02±1.19 and 2.63±1.21, respectively. Significant dif- ferences were found between the group with CKD and those with normal and slight dysfunction (ANO-
Fig. 3. Ratio of CKD according to coronary stenosis and calcification. Ryan’s method identified significant differences between groups with normal coronary arteries and with slight and severe stenosis (*p<0.05), but not among groups with calcification.
Fig. 2. Values for eGFR according to coronary stenosis and calcification. Significant differences were found between the stenosis groups by ANOVA as follows : *p<0.0001 ; **p=0.007 ; ***p=0.01. Decreasing renal function was associated with increasing degree of CAC. ANOVA found significant differences between calcification groups (#p=0.01 ; ##p=0.001 ; ###p=0.02).
Coronary stenosis and coronary calcification versus CKD
(32)
VA ; p=0.0003, 0.002, respectively). Coronary artery stenosis had obviously progressed in the patients with CKD.
3. Comparisons of renal function with coronary calcification
Figure 2 compares the average ± SD of the eGFR val- ues of the groups according to CAC. Those of the groups without calcification and with slight, moderate and severe calcification were 80.76±17.53, 79.46±23.06, 72.69±20.65 and 70.84±17.76, respectively. Decreas- ing renal function was associated with increasing CAC. Significant differences were found between the groups with non-calcification and moderate or severe cal- cification, and between those with slight and severe calci- fication (ANOVA ; p=0.01, 0.001, 0.02, respective- ly). Figure 3 compares the ratios of patients with CKD in each CAC group. The ratios of CKD among the groups without calcification and with slight, moderate and severe calcification were 12.9% (12/93), 13.9% (11/79), 26.0% (13/50) and 24.5% (13/53), respectively. Ryan’s method did not identify any significant differences in any population. The average ± SD of the total CACS of the groups with normal and slight dysfunction, and CKD
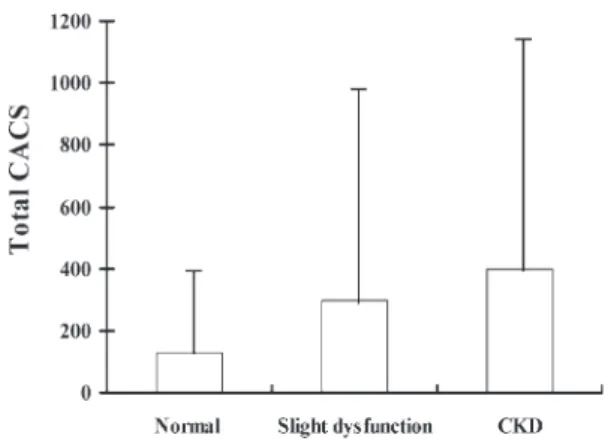
were 127.2±288.9, 297.7±687.9 and 396.4±735.2, re- spectively (Fig. 5). An increasing degree of renal dys- function was associated with increasing average total CACS. However, the large SD values indicated a wide variation in the total CACS for each renal function group, so significant differences were not identified in any of the populations by ANOVA.
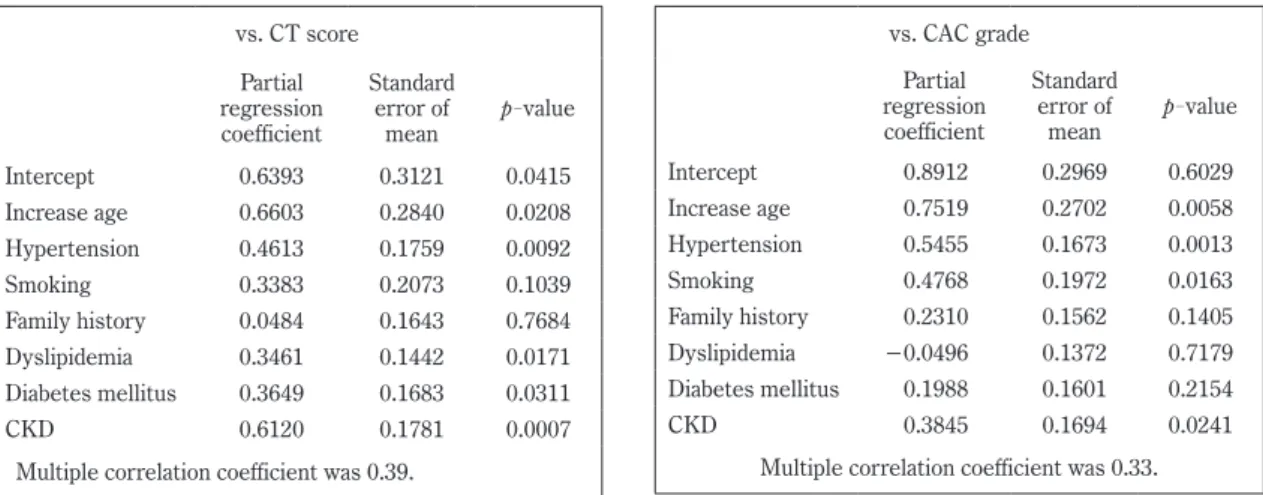
4. Multiple regression analysis of relationships between coronary risk factors and the sever- ity of coronary stenosis and of calcification Table 2 shows a multiple regression analysis of the contributions of the seven coronary risk factors to CT score and CAC grade. The partial regression coeffi- cients and p-values indicated that CKD made the great- est contribution to increasing CT scores, which reflect the degree of coronary artery stenosis. Each of IA, HT, DL and DM also significantly affected these CT scores.
On the other hand, the findings indicated that IA and HT were important factors in increasing CAC grades that re- flect the degree of CAC. Both CKD and smoking were also significantly associated with CAC grade. However, the multiple correlations between coronary risks and CT score and CAC grade were 0.39 and 0.33, respectively.
Fig. 4. Average CT score values according to renal function. ANOVA revealed significant differences among renal function groups (*p=0.0003 and **p=
0.002)
Fig. 5. Total CACS based on renal function. In creas- ing degree of renal dysfunction was associated with increasing average total CACS. ANOVA found no significant differences in total CACS according to renal function in any population.
Akita University
Discussion
Multiple regression analysis of the risk factor contribu- tion to increasing stenosis rates indicated that CKD in particular, as well as IA, HT, DL and DM, are associated with severe coronary stenosis. As stenosis rates in- creased, the average eGFR values were significantly low, and the ratios of CKD attended to be high. These find- ings indicated that CKD represents a significant risk fac- tor for CVD in terms of the severe stenosis, and that ac- tive intervention for CKD is indispensable for pre - ven tion. Several reports have indicated that treating conventional HT, DM and DL inhibits CKD progression and possibly decreases in GFR30-34). The fact that risk factors for CKD and for CVD, namely, IA, HT, DM, DL and smoking, closely overlap supports our findings. Not only is CKD an independent risk factor for CVD, it is also related to each of the traditional coronary risks ; that is, CKD and CVD are closely linked. Thus, the measures for treating CKD are identical to those of aggressive treatment for conventional coronary risks. Moreover, proteinuria, anemia, CKD-related mineral and bone dis- order (CKD-MBD), inflammation and nutrition may be also considered as risk factors for CVD in patients with CKD. Microalbuminuria might be associated with a
high risk of developing early CVD4,9,35-37). We consider that the reason why CKD has a remarkable effect on the severity of coronary stenosis is as follows. Firstly, ath- erosclerosis is not only related to conventional risk fac- tors, but also to other factors such as proteinuria, anemia, CKD-MBD, inflammation and nutrition in CKD. Our comparisons of renal function with calcification showed low eGFR values and high ratios of patients with CKD as total CACS increased. These findings indicated that CAC severity is associated with CKD. Multivariate analysis determined that increasing CAC, IA and HT are factors that predominantly contribute to severity of CAC. This analysis also suggested that the contribution of CKD might be significant, but to a lesser extent than those of IA and HT. Several studies have found many patients with severe coronary arteriosclerosis among those with CKD accompanied by renal arteriosclerosis such as stage 5 or on dialysis38,39). In addition, CAC also becomes more frequent and severe over time40). The severity of CAC might be under a powerful influence of IA. Consequently, we consider that increasing CKD se- verity over time has deeper effects on CAC. None of our enrolled patients had undergone or were receiving dialysis. This might explain why the contribution of CKD to increasing CAC grade was lower than that of ei- vs. CT score
Partial regression coefficient
Standard error of
mean p-value Intercept 0.6393 0.3121 0.0415
Increase age 0.6603 0.2840 0.0208
Hypertension 0.4613 0.1759 0.0092
Smoking 0.3383 0.2073 0.1039
Family history 0.0484 0.1643 0.7684
Dyslipidemia 0.3461 0.1442 0.0171
Diabetes mellitus 0.3649 0.1683 0.0311
CKD 0.6120 0.1781 0.0007
Multiple correlation coefficient was 0.39.
vs. CAC grade Partial regression coefficient
Standard error of
mean p-value Intercept 0.8912 0.2969 0.6029
Increase age 0.7519 0.2702 0.0058
Hypertension 0.5455 0.1673 0.0013
Smoking 0.4768 0.1972 0.0163
Family history 0.2310 0.1562 0.1405
Dyslipidemia −0.0496 0.1372 0.7179 Diabetes mellitus 0.1988 0.1601 0.2154
CKD 0.3845 0.1694 0.0241
Multiple correlation coefficient was 0.33.
Partial regression coefficients and p-values indicated that CKD contributes the most to increasing CT score values, which reflect the degree of coronary artery stenosis.
On the other hand, age and hypertension were important factors that participated in increasing CAC grades, which reflect the degree of CAC.
Table 2. Multivariate analysis of association between seven coronary risk factors and CT scores and CAC grades.
Coronary stenosis and coronary calcification versus CKD
ther IA or HT. Thus, our findings indicate that CKD is associated with the severity of coronary stenosis and of coronary calcification. To prevent the development of CVD requires curative approaches to CKD.
Conclusions
To investigate the relationship between CKD as a new risk factor for CVD and the severity of coronary stenosis and of coronary calcification, we compared eGFR with coronary stenosis and CACS assessed using 64-row CT in 275 assessable patients who were diagnosed or sus- pected as CVD. Our findings indicated that CKD causes the severity of coronary stenosis and CAC.
Acknowledgements
We thank Nobuyo Sekiguchi, MD, Toshiaki Takahashi, MD, Satoru Takeda, MD, Kouhei Fukahori, MD and Yo- shinao Sugai, MD (Department of the Second Internal Medicine, Hiraka General Hospital, Akita, Japan) for ex- perimental advice and for performing CAG and PCI. We are also grateful to Mr. Yoshihisa Nakano, Mr. Kaname Ono, and Mr. Tadashi Okako (Department of Radiology, Ugo Town Hospital, Akita, Japan) for useful advice re- garding the coronary imaging and the visual evaluations of coronary stenosis on CTCA images.
References
1) McCarthy, J.H. and Palmer, F.J. (1974) Incidence and significance of coronary artery calcification. Br.
Heart J., 36, 499-506.
2) Wexler, L., Brundage, B., Crouse, J., Detrano, R., Fuster, V., Maddahi, J., Rumberger, J., Stanford, W., White, R. and Taubert, K. (1996) Coronary artery calcification ; pathology, epidemiology, imaging methods, and clinical implications. A statement for health professionals from the American Heart Asso- ciation. Writing Group. Circulation, 94, 1175- 1192.
3) Anavekar, N.S., McMurray, J.J., Velazquez, E.J., et al. (2004) Relation between renal dysfunction and cardiovascular outcomes after myocardial infarc-
tion. N. Engl. L. Med., 351, 1285-1295.
4) Scott, D.S., Julie, L., Caren, G.S., et al. (2007) for the Prevention of Events with ACE Inhibition (PEACE) Investigators. Influence of albuminuria on cardiovascular risk in patients with stable coro- nary artery disease. Circulation, 116, 2687-2693.
5) Weiner, D.E., Tighiouart, H., Stark, P.C., Amin, M.G., MacLeod, B., Griffith, J.L., Salem, D.N., Levey, A.S.
and Sarnak, M.J. (2004) Chronic kidney disease as a risk factor for recurrent cardiovascular disease and mortality. Am. J. Kidney Dis., 44, 198-206.
6) Irie, F., Iso, H., Sairenchi, T., Fukasawa, N., Yamaguti, K., Ikehara, S., Kanashiki, M., Saito, Y., Ota, H. and Nose, T. (2006) The relationships of proteinuria, serum creatinine, glomerular filtration rate with car- diovascular disease mortality in Japanese general population. Kidney Int., 69, 1264-1271.
7) Go, A.S., Chertow, G.M., Fan, D., McCulloch, C.E.
and Hsu, C.Y. (2004) Chronic kidney disease and the risks of death, cardiovascular events, and hospi- talization. N. Engl. J. Med., 351, 1296-1305.
8) Nakayama, M., Metoki, H., Terawaki, H., et al.
(2007) Kidney dysfunction as a risk factor for first symptomatic stroke events in a general Japanese population—the Ohasama study. Nephrol. Dial.
Transplant., 22, 1910-1915.
9) Mann, J.F., Gerstein, H.C., Pogue, J., Bosch, J. and Yusuf, S. (2001) Renal insufficiency as a predictor of cardiovascular outcomes and the impact of ramipril : the HOPE randomized trial. Ann. Intern.
Med., 134, 629-636.
10) Nieman, K., Oudkerk, M., Rensing, B.J., van Ooijen, P., Munne, A., van Geuns, R.J. and de Feyter, P.J.
(2001) Coronary angiography with multi-slice com- puted tomography. Lancet, 357, 599-603.
11) Achenbach, S., Giesler, T., Ropers, D., et al. (2001) Detection of coronary artery stenoses by contrast- enhanced, retrospectively electrocardiographically- gated, multislice spiral computed tomography. Cir- culation, 103, 2535-2538.
12) Khan, M.F., Herzog, C., Landenberger, K., Maataoui, A., Martens, S., Ackermann, H. and Vogl, T.J. (2005) Visualisation of non-invasive coronary bypass imag- ing : 4-row vs. 16-row multidetector computed to- mography. Eur. Radiol., 15, 118-26.
13) Kopp, A.F., Schroeder, S., Kuettner, A., Baumbach, A.,
(34)
Akita University
Georg, C., Kuzo, R., Heuschnid, M., Karsch, K.R., Ohnesorge, B. and Claussen, C.D. (2002) Non-in- vasive coronary angiography with high resolution multidetector-row computed tomography. Eur.
Heart J., 23, 1714-1725.
14) Raff, G.L., Gallagher, M.J., O’ Neill, W.W. and Gold- stein, J.A. (2005) Diagnostic accuracy of noninva- sive coronary angiography using 64-slice spiral com- puted tomography. J. Am. Coll. Cardiol., 46, 552- 557.
15) Agatston, A.S., Janowitz, W.R., Hildner, F.J., Zusmer, N.R., Viamonte, M. Jr. and Detrano, R. (1990) Quantification of coronary artery calcium using ultra- fast computed tomography. J. Am. Coll. Cardiol., 15, 827-832.
16) Nasu, K. and Yoshioka, K. (2002) Coronary artery calcification score measured by electron beam com- puted tomography for evaluation of ischemic heart disease in Japanese. Nippon. Acta. Radiologica., 62, 701-706.
17) Knez, A., Becker, A., Leber, A., White, C., Becker, C.R., Reiser, M.F., Steinbeck, G. and Boekstegers, P.
(2004) Relation of coronary calcium scores by elec- tron beam tomography to obstructive disease in 2115 symptomatic patients. Am. J. Cardiol., 93, 1150- 1152.
18) Leber, A.W., Knez, A., Mukherjee, R, White, C., Hu- ber, A., Becker, A., Becker, C.R., Reiser, M. and Steinback, G. (2001) Usefulness of calcium scoring using electron beam computed tomography and non- invasive coronary in patients with suspected coro- nary artery disease. Am. J. Cardiol., 88, 219-223.
19) Becker, C.R., Kleffel, T., Crispin, A., Knez, A., Young, J., Schopf, U.J., Herberl, R. and Reiser, M.F. (2001) Coronary artery calcium measurement : agreement of multirow detector and electron beam CT. Am. J.
Roentgenol., 176, 1295-1298.
20) Stevens, L.A., Coresh, J., Greene, T. and Levey, A.S.
(2006) Assessing kidney function—measured and estimated glomerular filtration rate. N. Engl. J.
Med., 354, 2473-2483.
21) Matsuo, S., Imai, E., Horio, Y., Yasuda, Y., Tomita, K., Nitta, K., Yamagata, K., Tomino, Y., Yokoyama, H.
and Hishida, A. On behalf of the collaborators for developing Japanese equation for estimating GFR.
The Japanese Equation for Estimating Glomerular
Filtration Rate from Serum Creatinine. Am. J. Kid- ney Dis., in press.
22) Matsuzaki, M., Kita, T., Mabuchi, H., Matsuzawa, Y., Nakaya, N., Oikawa, S., Saito, Y., Sasaki, J., Shima- mura, K. and Itakura, H. ; J-LIT Study Group.
(2002) Japan Lipid Intervention Trial. : Large scale cohort study of the relationship between serum cho- lesterol concentration and coronary events with low- dose simvastatin therapy in Japanese patients with hypercholesterolemia. Circ. J., 66, 1087-1095.
23) Kodama, K., Sasaki, H. and Shimizu, Y. (1990) Trend of coronary heart disease and its relationship to risk factors in a Japanese population : a 26-yaer follow up, Hiroshima / Nagasaki study. Circ. J., 54, 414-421.
24) Ueshima, H., Choundhury, S.R., Okayama, A., Ha ya- kawa, T., Kita, Y., Kadowaki, T., Okamura, T., Minowa, M. and Iimura, O. NIPPON DATA80 Re- search Group (2004) Cigarette Smoking as a Risk Factor for Stroke Death in Japan : NIPPON DATA80.
Stroke, 35, 1836-1841.
25) Stamler, J., Stamler, R. and Neaton, J.D. (1993) Blood pressure, systolic and diastolic, and cardiovas- cular risks. US population data. Arch. Intern.
Med., 153, 598-615.
26) Okayama, A., Kadowaki, T., Okamura, T., Hayakawa, T and Ueshima, H. (2006) Age-specific effects of systolic and diastolic blood pressures on mortality due to cardiovascular diseases among Japanese men (NIPPON DATA80). J. Hypertens., 24, 459-462.
27) Schneider, D.J. and Sobel, B.E. (1997) Determi- nants of coronary vascular disease in patients with type II diabetes mellitus and their therapeutic impli- cations. Clin. Cardiol., 20, 433-440.
28) Barrett-Conner, E. and Khaw, K. (1984) Family history of heart attack as an independent predictor of death due to cardiovascular disease. Circulation, 69, 1065-1069.
29) Okamura, T., Hayakawa, T., Kadowaki, T., Kita, Y., Okayama, A. and Ueshima, H. (2006) The inverse relationship between serum high-density lipoprotein cholesterol level and all-cause mortality in a 9.6-year follow-up study in the Japanese general popula- tion. Atherosclerosis, 184, 143-150.
30) Ninomiya, T., Kiyohara, Y., Kubo, M., Yonemoto, K., Tanizaki, Y., Doi, Y., Hirakata, H. and Iida, M. (2006)
Coronary stenosis and coronary calcification versus CKD
Metabolic syndrome and CKD in a general Japanese population : the Hisayama Study. Am. J. Kidney Dis., 48, 383-391.
31) Bakris, G.L., Williams, M., Dworkin, L., Elliot, W.J., Epstein, M., Toto, R., Tuttle, K., Douglas, J., Hsueh, W. and Sowers, J. (2000) Preserving renal function in adults with hypertension and diabetes : a consen- sus approach. National Kidney Foundation Hyper- tension and Diabetes Executive Committees Work- ing Group. Am. J. Kidney Dis., 36, 646-661.
32) The Diabetes Control and Complications Trial Re- search Group (1993) The effect of intensive treat- ment of diabetes on the development and progres- sion of long-term complications in insulin-dependent diabetes mellitus. N. Engl. J. Med., 329, 977-986.
33) K/DOQI Clinical practice guidelines for managing dyslipidemias in chronic kidney disease. (2003) Am. J. Kidney Dis., 41 (Suppl 3), S1-91.
34) Yamagata, K., Ishida, K., Sairenchi, T., Takahashi, H., Ohba, S., Shiigai, T., Narita, M. and Koyama, A.
(2007) Risk factor for chronic kidney disease in a community-based population : a 10-year follow-up study. Kidney Int., 71, 159-166.
35) Gerstein, H.C., Mann, J.F., Yi, Q., et al. ; HOPE Study Investigators. (2001) Albuminuria and risk of cardiovascular events, death, and heart failure in diabetic and nondiabetic individuals. JAMA, 286,
421-426.
36) de Zeeuw, D., Remuzzi, G., Parving, H.H., Keane, W.F., Zhang, Z., Shainfar, S., Snapinn, S., Cooper, M.E., Mitch, W.E. and Brenner, B.M. (2004) Albu- minuria, a therapeutic target for cardiovascular pro- tection in type 2 diabetic patients with nephropa- thy. Circulation, 110, 921-927.
37) Bohm, M., Thoenes, M., Danchin, N., Bramlage, P., La Puerta, P. and Vople, M. (2007) Association of cardiovascular risk factors with microalbuminuria in hypertensive individuals : the i-SERACH global study. J. Hypertensions, 25, 2317-2324.
38) Nakamura, S., Ishibashi-Ueda, H., Niizuma, S., Yoshi- hara, F., Horio, T. and Kawano, Y. (2009) Coronary calcification in patients with chronic kidney disease and coronary artery disease. Clin. J. Am. Soc.
Nephrol., 12, 1892-1900.
39) Piers, L.H., Touw, H.R., Gansevoort, R., Franssen, C.F., Oudkerk, M., Zijlstra, F. and Tio, R.A.
(2009) Relation of aortic valve and coronary artery calcium in patients with chronic kidney disease to the stage and etiology of the renal disease. Am. J.
Cardiol., 103, 1473-1477.
40) Tuttle, K.R. and Short, R.A. (2009) Longitudinal relationships among coronary artery calcification, se- rum phosphorus, and kidney function. Clin. J. Am.
Soc. Nephrol., 12, 1968-1973.
(36)