Spatiotemporal profiles of nociceptive information processing of dental pulp in rat cerebral cortex
Hiroko Nakamura
Nihon University Graduate School of Dentistry, Major in Pediatric Dentistry
(Directors: Profs. Tetsuo Shirakawa and Noriaki Koshikawa, and Assoc. Prof. Masayuki Kobayashi)
1
Index
Aim and Scope --- 2
CHAPTER 1 Introduction --- 4
Materials and Methods --- 5
Results --- 9
Discussion --- 17
CHAPTER 2 Introduction --- 21
Materials and Methods --- 22
Results --- 24
Discussion --- 29
Conclusions --- 32
Acknowledgments --- 32
References --- 33
2
Aim and Scope
Nociception is finally processed in the cerebral cortex including the somatosensory (SS), cingulate, and insular cortices (IC). Somatosensation is topographically organized in the primary (S1) and secondary (S2) somatosensory cortices, which contributes to identify the region receiving sensory inputs, however, it is still an open issue how the nociception of the tooth pulp is processed in the cerebral cortex. This issue is pivotal to understand the mechanism of tooth pain that underlies the clinical finding of spatial misunderstanding of the diseased tooth.
In Chapter 1, cortical regions responding to electrical stimulation of the maxillary and mandibular dental pulp were elucidated in rats by in vivo optical imaging. Electrical stimulation of the mandibular incisor pulp evoked neural excitation in two areas: the most rostroventral part of S1, and the ventral part of S2 caudal to the middle cerebral artery.
Maxillary incisor pulp stimulation initially evoked responses only in the ventral part of S2, though later maximum responses were also observed in S1 similar to those of mandibular incisor stimulation. The maxillary and mandibular molar pulp-responding regions were located in the most ventral S2, a part of which was histologically classified as the insular oral region (IOR). In terms of the initial responses, maxillary incisor and molar stimulation induced excitation in the S2/IOR rostral to the mandibular dental pulp-responding region.
Contrary to the spatially segregated initial responses, the maximum excitatory areas responding to both incisors and molars in the mandible and maxilla overlapped in S1 and the S2/IOR.
Multi-electrode extracellular recording supported the characteristic localization of S2/IOR neurons responding to mandibular and maxillary molar pulp stimulation.
In Chapter 2, I focused on the anatomical and physiological differences between S1 and S2/IOR in the temporal activation kinetics, dependency on stimulation intensity, and additive or summative effects of simultaneous pulpal stimulation. In comparison to S1, optical signals in S2/IOR showed a larger amplitude with a shorter rise time and a longer decay time responding to maxillary molar pulp stimulation. The latency of excitation in S2/IOR was shorter than in S1. S2/IOR exhibited a lower threshold to evoke optical responses than S1, and the peak amplitude was larger in S2/IOR than S1. Unexpectedly, the topography of S1 that responded to maxillary and mandibular incisor and molar pulps overlapped with the most ventral sites in S1 that was densely stained with cytochrome oxidase histochemistry. An additive effect was observed in both S1 and S2/IOR after simultaneous stimulation of bilateral maxillary molar pulps but not after contralateral maxillary and mandibular molar pulp
3
stimulation. Taken together with these findings, it is likely that the location of a toothache is possibly identifiable. However, the overlapping excitatory patterns in the maximum responses imply less topographic organization, which may underlie the referred pain and/or misunderstanding of the diseased tooth. Furthermore, S2/IOR is more sensitive for detecting dental pulp sensation and codes the intensity of stimulus more precisely than S1. This information processing contributes to discriminate tooth pulp stimulation.
This thesis is based on two studies on nociceptive information processing from dental pulps (Nakamura et al. J Comp Neurol, 2015; Nakamura et al. J Dent Res, 2016).
4
CHAPTER 1
Spatiotemporal profiles of dental pulp nociception in rat cerebral cortex: an optical imaging study
Hiroko Nakamura, Risako Kato, Tetsuo Shirakawa, Noriaki Koshikawa, and Masayuki Kobayashi. The Journal of Comparative Neurology, 523, 1162-1174, 2015.
Introduction
The primary (S1) and secondary (S2) somatosensory areas are somatotopically organized in the rat (Chapin and Lin, 1984; Brett-Green et al., 2003, 2004; Krubitzer et al., 2011; Haque et al., 2012; Seelke et al., 2012). The barrel field, which processes whisker sensation, has been extensively studied and occupies the largest area in S1/S2. The barrel field shows a distinct somatotopy in the ventral part of S1/S2 (Woolsey and Van der Loos, 1970; Chappell et al., 2007; Petersen, 2007). In contrast, nociception of the dental pulps has been less explored in the rat. Most studies have focused on the evoked potential in response to incisor pulp stimulation (Rehnig et al., 1984; Catania and Remple, 2002; Remple et al., 2003). In S1, mandibular and maxillary incisor stimulation evokes responses in the most rostroventral and caudoventral areas, respectively (Remple et al., 2003). Interestingly, the caudal part adjacent to the S1 maxillary incisor area responds to both mandibular and maxillary incisors and is thus described as the mixed incisors area, oral module 3 (OM3) (Remple et al., 2003). Because OM3 receives somatosensory inputs from multiple teeth, OM3 is possibly the incisor responsive area in S2, as previously reported (Shigenaga et al., 1974). Hayama et al. (1993) demonstrated that stimulation of the inferior dental nerve innervating the dental pulp including the mandibular molars induces field potentials in the mandibular zone in the rostral part of the somatosensory cortex, possibly S1. Although the spatial projection profiles of molar teeth in S2 or OM3 are critical to understanding the somatotopy in these areas, little information is currently available.
OM3 is located dorsally to the anterior part of the insular cortex (IC), where gustation and visceral sensation are processed (Yasui et al., 1991). Yamamoto et al. (1984) reported that gustatory neurons are intermingled with somatosensory neurons, even in the gustatory IC.
Other electrophysiological studies supported the above findings (Kosar et al., 1986; Hanamori et al., 1998; Ogawa and Wang, 2002). These results suggest that local circuits in the IC play
5
critical roles in the integration of multiple sensations (Rodgers et al., 2008). However, it is still an open question whether nociceptive inputs from the dental pulp project to the IC.
Taken together, these findings suggest that somatosensory cortical areas responding to dental pulp stimulation, i.e., OM3 (Remple et al., 2003), may be involved in the dorsal part of IC.
Furthermore, several critical questions should be answered. First, are cortical regions responding to pulpal pain somatotopically organized? Second, if so, are there connections among the different somatotopic regions? Optical imaging using voltage-sensitive dye allows researchers to visualize the spatial pattern of cortical excitation with high resolution compared to field potential recording. Therefore, the optical imaging was performed in urethane- anesthetized rats to evaluate the spatiotemporal profile of neural excitation in the S1, S2, and IC in response to stimulation of incisor and molar pulp in the mandible and maxilla. In addition, multi-electrode extracellular recording was performed to examine the temporal patterns of neural excitation in S2 and IC.
Materials and Methods
Twenty-six male Sprague-Dawley rats were used in this study. The experiments performed in this study were approved by the Animal Experimentation Committee of Nihon University and were conducted in accordance with institutional guidelines for the care and use of experimental animals described in the National Institutes of Health Guide for the Care and Use of Laboratory Animals. All efforts were made to minimize animal suffering and reduce the number of animals used.
In vivo optical imaging
All optical imaging experiments were performed using a voltage-sensitive dye (RH1691, Optical Imaging, New York, USA) with the previously described method (Fujita et al., 2010, 2011, 2012; Mizoguchi , 2011). Six- to seven-week-old male Sprague-Dawley rats (Sankyo Labo, Tokyo, Japan), weighing 225.9 ± 10.2 g (n = 15), received atropine methyl bromide (5 mg/kg, i.p.) and were anesthetized with urethane (1.5 g/kg, i.p.). The efficacy of anesthesia was gauged by the absence of a toe pinch reflex, and additional urethane was added as needed.
Body temperature was maintained at ~37˚C using a heating pad and was monitored using a rectal probe (BWT-100, Bio Research Center, Osaka, Japan). A tracheotomy and intubation were performed. Lidocaine (2% gel, AstraZeneca, Tokyo, Japan) was administered to the incisions to ensure complete analgesia. The animal was fixed to a custom-made stereotaxic
6
snout frame, which was tilted 60˚ laterally to image the surface of the left IC using a CCD camera (MiCAM02, Brainvision, Tokyo, Japan). The left temporal muscle and zygomatic arch were carefully removed, and a craniotomy was performed to expose the IC and surrounding cortices (Fig. 1A).
RH1691 (1 mg/ml) was dissolved in 0.9% saline and applied to the cortical surface for approximately 1 hour. Fluorescent changes in RH1691 were measured using the CCD camera system described above, which was mounted on a stereomicroscope (Leica Microsystems, Wetzler, Germany). The cortical surface was illuminated through a 632 nm excitation filter and a dichroic mirror using a tungsten-halogen lamp (CLS150XD, Leica Microsystems). The fluorescent emission was captured through an absorption filter (λ > 650 nm long-pass, Andover, Salem, USA). The CCD camera had a 6.4 × 4.8 mm2 imaging area consisting of 184 × 124 pixels.
To remove signals due to acute bleaching of the dye, values in the absence of any stimuli were subtracted from each recording: one image was constructed from paired recordings with and without stimulation. The sampling interval was 4 ms, and the acquisition time was 500 ms. Forty consecutive images in response to the stimuli were averaged to reduce the noise described above.
Multiple unit recording in vivo
Male Sprague-Dawley rats (Sankyo Laboratories) weighing 200.1 ± 4.5 g (n = 11) were anesthetized as above. The surgical and recording procedures were as described previously (Fujita et al., 2013). A small craniotomy and resection of the dura mater was carefully performed to insert a recording electrode into the left side of the IC.
The microelectrode arrays (NeuroNexus, Ann Arbor, MI, USA), which have 32 circular sensors (diameter = 20 μm, impedance = 1.32 ± 0.02 MΩ at 1 kHz) at intervals of 50 μm in a linear arrangement, were perpendicularly inserted 0.3 mm anterior and 5.0 mm lateral to bregma and 3.2-4.5 mm from the cortical surface. Action potentials were recorded extracellularly, amplified, filtered, digitized using a Plexon Recorder System (band pass: 100-8,000 Hz;
sampling rate 20 kHz; Plexon, Dallas, TX, USA), and stored on a computer hard disk with recording software (ver. 2, Plexon). The spikes were sorted into single units based on the peak amplitude, sum of the squared amplitude, and half width using an off-line sorter software (ver.
3, Plexon).
7
Fig. 1. Orofacial stimulation-induced excitatory propagation in the primary (S1) and secondary (S2) somatosensory areas and the insular cortex (IC) revealed by optical imaging. A, A schematic drawing of the in vivo preparation for optical imaging. Upper Inset, An example of CCD indicated by the red square. Lower Inset, Schemes of stimulation electrodes (blue) inserted in the tongue, upper incisor, and lower molar. B, A fluorescent image of a coronal section loaded with a voltage-sensitive dye, RH1691, superimposed on a translucent image. C, An example of excitatory propagation corresponding to mandibular incisor stimulation (5 pulses at 50 Hz). The amplitude of ΔF/F was color-coded, and the time from the onset of stimulation is shown at the top of each panel. The area of excitation is indicated with red at 14 ms, orange at 18 ms, yellow at 22 ms, cyan at 26 ms, and blue at 30 ms. Note that the initial responses were observed in the restricted region outlined by the red lines (14 ms). After the initial response, the excitation propagated in a concentric manner. D, The outlines of the excitation shown in C are superimposed. E, Spatiotemporal profiles of excitation produced by stimulation of the whisker pad, mentum, tongue, maxillary incisor and the 1st molar, mandibular incisor and the 1st molar.
The first frame that exhibited excitation (Initial) and the frame with the maximum amplitude of optical signal at the center of excitation (Maximum) are shown in the left two panels. The temporal profiles of optical signals at the center of excitation indicated by asterisk (*) are shown in the right column. Arrows indicate the timing of stimulation. F,G, Superimposed outlines of initial (F) and maximum responses (G). The colors corresponded to those in E. B, barrel field; LI, lower (mandibular) incisor; LM, lower molar; M, mentum; MCA, middle cerebral artery; RF, rhinal fissure; T, tongue; UI, upper (maxillary) incisor; UM, upper molar.
8
Electrical stimulation
Bipolar electrodes made from an enamel-coated copper wire (diameter = 80 μm for dental pulp stimulation and 260 μm for skin stimulation; Tamagawadensen, Tokyo, Japan) were inserted into the skin (the whisker pad, mentum, and tongue) and dental pulp (the maxillary and mandibular incisor and the 1st molars; Fig. 1A). The tip of the wire (0.5-1.0 mm) was bared and fixed with dental cement (Estelite Flow Quick, Tokuyama Dental, Tokyo, Japan). For electrical stimulation, voltage pulses of 100 μs duration and 3-7 V amplitude were applied using a stimulator unit (STG2008, Multi Channel Systems, Reutlingen, Germany). In the present study, five voltage pulses at 50 Hz were applied at 0.05 Hz to obtain stable optical responses.
Morphology
After optical imaging or multiple unit recording, the animals were perfused with 4%
paraformaldehyde in 0.1 M phosphate buffer, and the brains were removed and stored in fixative overnight at 4°C. Then, the brains were subjected to 30% sucrose in 0.1 M phosphate buffer for 3-4 days until they sank. Sections were cut with a freezing microtome (CM1850, Leica Microsystems) at 50 μm thickness. For Nissl staining, sections were mounted on gelatin-coated slides and air-dried overnight. Sections were hydrated in a series of ethanol and washed in distilled water. Subsequently, they were stained with 0.25% Thionin for 20 seconds. After staining, sections were rinsed in distilled water, dehydrated in ethanol, cleared in xylene, and cover-slipped. In some experiments, the cerebral cortex was transversely sectioned at 70 μm after the hemisphere was flattened. Sections were immersed in a solution containing 0.05% cytochrome C, 0.08% DAB, 4% sucrose and 0.1 M phosphate buffer, and then incubated at 37°C for 2-6 hours in the dark until the barrel columns were visible (Wong- Riley, 1979). After being rinsed three times for 7 minutes in 0.1 M PB, sections were mounted on gelatin-coated slides, air-dried, dehydrated in ethanol, cleared in xylene and cover-slipped.
To examine the penetration depth of RH1691 into the cortex, the brains were removed without perfusion and coronally sectioned at 70 μm thickness with a freezing microtome (CM1850, Leica Microsystems).
Stained sections were imaged using a microscope (BZ-9000, Keyence, Osaka, Japan).
Minor adjustments of image brightness and contrast were performed in Adobe Photoshop (ver.
CS6; Adobe Systems, San Jose, CA). The final schematic figures were generated in Adobe Illustrator (ver. CS6; Adobe Systems, San Jose, CA).
9
Data analysis
In the optical imaging experiment, changes in the intensity of fluorescence (ΔF) of each pixel relative to the initial intensity of fluorescence (F) were calculated (ΔF/F), and the ratio was processed with a spatial filter (9 × 9 pixels). A significant response was defined as a signal exceeding 7 times the SD of the baseline noise. The optical imaging data were processed and analyzed by a software program (Brain Vision Analyzer, Brainvision, Morrisville, NC).
Images were aligned across multiple rats using the rhinal fissure and middle cerebral artery (MCA) as markers. In 4% of rats, the MCA exhibited angioplany, e.g., it was bifurcated at the rhinal fissure. In these animals, the rhinal fissure and the MCA could not be aligned with the other animals, and therefore, the results obtained from these animals were excluded.
I estimated the spatial profiles of excitation using the initial and maximum responses (Fig.
1). The initial response was obtained by outlining the evoked excitation in the first frame that exhibited a significant increase in the optical signal. The maximum response was defined as the outline of the excitatory response in the frame with the maximum amplitude of optical signal in the center of the initial response. To quantify the overlapped areas, which responded to stimulation of ≥ 2 dental pulps, the overlapped area index (OAI) was calculated as follows:
OAI = overlapped area / (area responding to a single pulp + overlapped area) × 100 (%)
Statistics
Data are expressed as the mean ± SEM. Student's t-tests were used to compare the latency of action potential induction responding to the maxillary and mandibular molar stimulation.
One-way analysis of variance (ANOVA) followed by a Bonferroni post-hoc test was used for statistical analysis to compare the OAI of the initial and maximum responses. Kolmogorov- Smirnov tests were used for the statistical comparison of the distribution patterns of neuron subtypes responding to the maxillary and mandibular molar stimulation. P < 0.05 was considered significant.
Results
The spatiotemporal kinetics of excitatory propagation in the rat IC have been studied using an optical imaging technique (Fujita et al., 2010, 2011, 2012; Mizoguchi et al., 2011). In the present study, optical signals were measured under the in vivo preparation in the IC and surrounding cortices, including S1 and S2 (Fig. 1A). Voltage-sensitive dye RH1691 was applied to the cortical surface, and coronal sections prepared after optical imaging demonstrated
10
that the dye penetrated at least to the deeper part of layer III (Fig. 1B). Thus, the observed optical signals reflect a change in the membrane potential of layers I–III neurons. Electrical stimulation of peripheral structures evoked excitatory propagation in these cortices (Fig. 1E).
The initial response (see Materials and Methods) was spatially restricted, and the subsequent excitation propagated in a concentric manner (Fig. 1C,D). The excitation reached the largest area (the maximum response) at approximately the same time when the optical signal in the center of the initial response showed the peak amplitude.
Spatial distribution patterns of excitation following stimulation of orofacial regions
The S1 subregions corresponding to the whisker pad, mentum, and tongue are well- established. In the first experiment, therefore, excitatory propagation in response to electrical stimulation of the whisker pad, mentum, and tongue was recorded to confirm the S1 subregions in preparations.
Stimulation of the whisker pad between the whiskers (D1 and D2) evoked excitation in the dorsal part of the imaged area (Fig. 1E). The latency of excitation was 16.9 ± 1.4 ms (n = 7).
In reference to the previous studies (Remple et al., 2003), it is likely that the dorsocaudal excitatory regions correspond to the barrel field in S2. Excitation in S1 barrel field was out of imaged area, though a part of experiments showed excitation in the dorsorostral region (Fig.
2A). After the initial response, the excitatory propagation in the cerebral cortex spread towards the surrounding cortices.
The initial response to stimulation of the mentum was located in two separate regions: rostral to the S1 whisker pad region and ventral to the S2 whisker region (Fig. 1E). The initial response to tongue stimulation was located in the rostroventral region of S1 and ventral to the S2 barrel field (Fig. 1E). These spatial profiles are consistent with previous studies (Kosar et al., 1986; Remple et al., 2003). Similar to whisker pad stimulation, the later responses to the mentum and tongue propagated to the adjacent cortical regions, and the somatotopic arrangement of excitation disappeared (Fig. 1E).
The outlines of excitation obtained from the 7 rats that were used to record all responses (whisker pad, mentum, tongue, incisors and molars of the maxilla and mandible) were superimposed with reference to the rhinal fissure and MCA to confirm the somatotopic map shown in Figure 2. Although there was slight variation in the distribution patterns of excitation among the rats, the summed responses, especially the initial responses, replicate previous findings. Therefore, I determinded the map of the whisker pad, mentum and tongue
11
Fig. 2. Spatial patterns of the initial and maximum responses to orofacial stimulation obtained from 7 rats. A, The initial responses were superimposed with reference to the MCA and RF. The number of overlapping responses is represented by the gradation of colors; the area painted with the deepest color showed responses in all animals. Note that stimulation of the whisker, mentum, tongue and mandibular incisor showed initial responses in the rostral (S1) and caudal (S2) regions. B, The maximum responses were superimposed on the left column. Two-tone colored maps shown in the right column (Overlap) indicate that overlapped areas in 4/7 rats (light color) and 7/7 rats (deep color). C, Outlines of the initial responses to dental pulp stimulation shown in A.
Note that maxillary dental stimulation evoked responses in the rostral region compared with mandibular dental stimulation. In addition, the incisor stimulation-induced region tended to localize dorsal to molar stimulation areas. D, Outlines of the initial responses to orofacial stimulation shown in A. The excitatory regions evoked by whisker pad, mentum, and tongue is superimposed on the outlines. The areas with green and purple indicate S1 and S2, respectively. B, barrel field; IOR, insular oral region; LI, lower (mandibular) incisor; M, mentum; T, tongue; UI, upper (maxillary) incisor. E, Outlines of the maximum responses to dental stimulation (B right column). Note that most excitatory regions overlapped.
12
to identify the somatotopic distribution pattern of incisor and molar pulp stimulation, as described below.
Spatial distribution patterns of initial responses to dental pulp stimulation
Similar to the stimulation of the whisker pad, mentum, and tongue, mandibular incisor dental pulp stimulation evoked initial responses in both rostral and caudal regions of the same rat shown in Figure 1. Consistent with a previous study (Remple et al., 2003), the rostral and caudal regions activated by mandibular incisor pulp stimulation were located rostral to the tongue region in S1 and in the mixed dental region, respectively (Fig. 1E,F). According to the rat brain in stereotaxic coordinates by Paxinos and Watson (2007), the mixed dental region is located in S2. The superimposed outlines of excitation (n = 7) confirmed that the S1 region responding to the mandibular incisor is located adjacent to the S1 tongue region, but tongue and mandibular incisor stimulation induced similar regions of S2 (Fig. 2D). The latency of excitation responding to mandibular incisor pulp stimulation was 20.3 ± 2.4 ms in S1 and 18.6
± 2.5 ms in S2 (n = 7).
In contrast to the mandibular incisor region, the initial response to electrical stimulation of the maxillary incisor pulp was observed in a single region, S2, which was located between the MCA and the S2 mandibular incisor region (Figs. 1,2). The latency of response for the maxillary incisor was 18.6 ± 1.6 ms (n = 7).
The mandibular and maxillary molar stimulation also induced excitation in the mixed dental region (Figs. 1,2). The latency of responses for the mandibular and maxillary molars were 14.6 ± 1.0 ms and 14.6 ± 1.4 ms, respectively (n = 7). A typical example demonstrating that the initial responses to dental pulp stimulation in the S2 were spatially segregated (Fig. 1F).
The superimposed images of the outlines of excitation showed that the maxillary incisor and molar stimulation induced excitation in the rostral part of the S2 (Fig. 2). On the other hand, mandibular incisor and molar stimulation activated the caudal S2. Moreover, incisor stimulation activated the dorsal part of the regions responding to molar stimulation.
The OAI of the initial responses, which quantifies how responding areas are overlapped (see Materials and Methods), was 12.2 ± 1.6% (n = 7), suggesting that the most initial responses to stimulation of maxillary and mandibular incisors and molars were spatially separated.
Anatomical profile of S2/IOR
Many neurons in the gustatory cortex, a part of the IC, respond to somatosensory stimuli to the oral structures (Yamamoto et al., 1984; Kosar et al., 1986; Hanamori et al., 1998; Ogawa
13
and Wang, 2002), and therefore, the molar pulp-responding regions, the most ventral part of the S2, are possibly located in the dorsal part of the IC (Paxinos and Watson, 2007). To examine this possibility, Nissl staining of coronal sections was used to identify the cytoarchitecture of the mandibular molar pulp-responding region.
After optical signal recording, a heated needle was inserted in the center of the field responding to mandibular molar stimulation (Fig. 3A,B), and the Nissl sections were prepared as described in the Materials and Methods. Figure 3A,B show two examples of Nissl sections with a lesion. The lesions are located in the dysgranular IC (DI), which exhibits disruption or lack of the granular layer (layer IV). In 6/7 cases, the lesions were observed in the DI or granular IC (GI), indicating that the mandibular molar pulp-responding regions are at least partially located in the 'insular oral region (IOR)' (Fig. 3C).
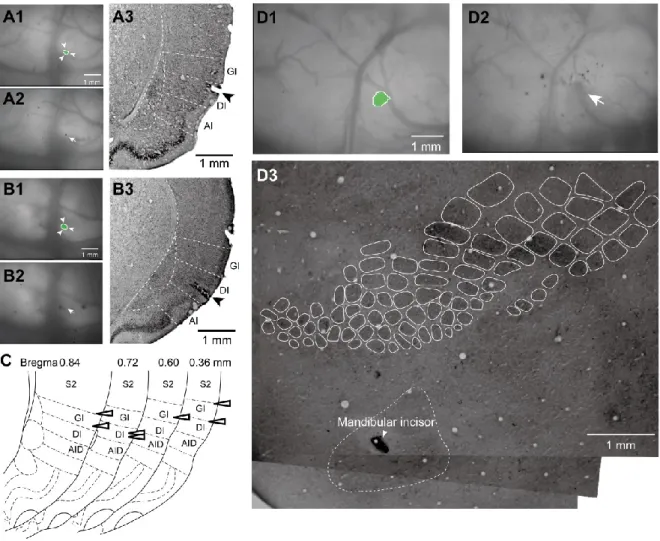
Fig. 3. Histological analysis of excitatory regions responding to dental stimuli. A,B, The center of the initial response to mandibular incisor stimulation (surrounded by arrowheads in A1 and B1) was coagulated (arrow in A2 and B2). The coronal Nissl sections showed that the lesion was observed in the dysgranular insular cortex (arrowhead in c). C, Schemes of the location of lesions. D, The coagulation (D2) in the center of the initial response to the mandibular incisor stimulation (D1) is located in the cytochrome oxidase-dense region that ventrally adjacent to the barrel cortex in a flat mount section (D3).
14
Cytochrome oxidase histochemistry is suitable for identification of barrel structures in the S1 and S2 (Woolsey and Van der Loos, 1970; Remple et al., 2003; Chappell et al., 2007).
According to a previous study by Remple et al. (2003), the OM3 is located ventral to the barrel structures and cytochrome oxidase-dense region, where the mandibular incisor response is recorded (Fig. 3D). The location of the mandibular incisor pulp-responding region in the flat- mounted sections was examined to confirm this finding. Cytochrome oxidase histochemistry clearly indicated that the mandibular incisor pulp-responding region is located in the center of the cytochrome oxidase-dense region ventrally adjacent to the barrel field (n = 8).
Maximum responses to pulp stimulation
As shown in the previous reports, excitation in a part of the DI and GI spreads towards the surrounding cortex with a preference for the rostral direction (Fujita et al., 2010, 2012). This preferred excitatory propagation directs to the ventral part of the S1 and motor cortex and is mediated in part by cortico-cortical connections (Fujita et al., 2010; Adachi et al., 2013).
Therefore, the later responses that follow the initial excitation are likely to be partially mediated by cortico-cortical connections. The maximum responses were analyzed to examine the profile of the later responses.
The maximum response was defined as the peak amplitude of the initial response (see Materials and Methods). In contrast to the initial responses, the maximum responses to incisor and molar pulp stimulation in the mandible and maxilla exhibited evoked excitation in the two regions: (1) S2/IOR and (2) S1 (Figs. 1E,G, 2B,E). The caudoventral part of the S2/IOR may correspond to the PV defined by Remple et al. (2003).
Although there was a slight difference in the distribution patterns of excitatory propagation among the teeth, most excitatory areas overlapped (Figs. 1G, 2E). In reference to the responses to stimulation of the whisker pad, mentum, and tongue, the regions commonly excited by dental pulp stimulation were located around the mandibular incisor region of S1. The maximum responses rarely propagated beyond the rhinal fissure.
The OAI of maximum responses were 53.0 ± 6.1% (n = 7) in S1 and 55.2 ± 5.4% (n = 7) in S2/IOR, which were much higher than that of the initial response in S2/IOR (P < 0.001, one- way ANOVA). These results suggest that the maximum responses were considerably overlapped both in S1 and in S2/IOR.
15
Extracellular recording from the S2/IOR
The optical imaging results of the spatially differentiated initial responses to dental pulp stimulation in the S2/IOR suggested that these regions receive their own thalamic inputs. On the other hand, the intermingled responses to different teeth in the S2/IOR imply the cortico- cortical propagation of excitation. If this is the case, unit recording may reveal a shorter latency to the principal tooth compared to the other teeth. To explore this possibility, multi- channel recording was performed from the S2/IOR, and the followings were examined: (1) the population rate of S2/IOR neurons responding to dental pulp stimulation, (2) whether there are S2/IOR neurons that respond to both mandibular and maxillary dental pulp stimulation, and (3) the latency of evoked neural activity responding to each dental pulp. In the case in which multi-units were recorded from a single channel, the units were carefully sorted into single units using an off-line sorter software as described in Materials and Methods.
Recordings from 283 S2/IOR neurons of 11 rats revealed that 50.5% of S2/IOR neurons (143/283) increased their firing frequency in response to molar pulp stimulation. Among these neurons with increased activity, 19.8% (56/283) responded to both mandibular and maxillary molars. The other neurons showed responses to either mandibular (46/283) or maxillary molar pulp stimulation (41/283). The latency to maxillary and mandibular molar stimulation was 73.1 ± 3.7 ms (n = 97) and 66.6 ± 3.5 ms (n =102), respectively, which was not significantly different (P > 0.1, Student's t-test).
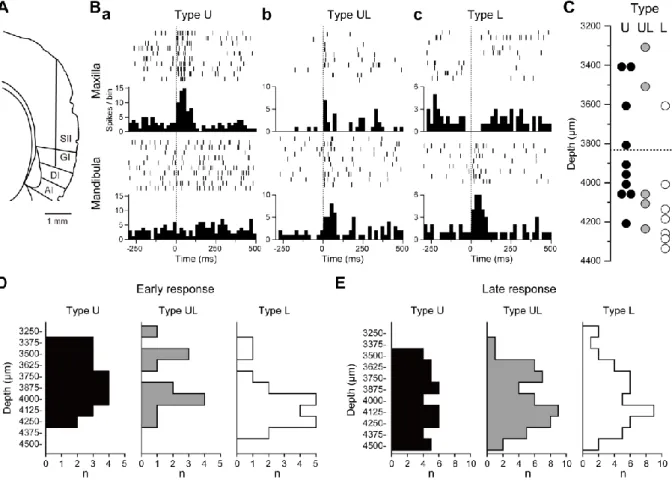
Next, I analyzed that the latency of neural activity in the S2/IOR neurons responding to molar pulp stimulation. As shown in Figure 4B, the S2/IOR neuron showed significantly faster responses to the maxillary molar (≤ 20 ms latency) than to the mandibular molar. To estimate the initial response obtained from the optical imaging experiment, I classified the S2/IOR neurons into those that responded at a latency of ≤ 20 ms (early response) and > 20 ms (late response).
A typical example of a recording from an S2/IOR neuron is shown in Figure 4A-C. S2/IOR neurons were divided into three categories according to their early responses at a latency of ≤ 20 ms: (1) neurons responding only to maxillary (upper) molar pulp stimulation (Type U; Fig.
4Ba), (2) neurons responding both to maxillary and mandibular (lower) molar pulp stimulation (Type UL; Fig. 4Bb), and (3) neurons responding only to mandibular molar pulp stimulation (Type L; Fig. 4Bc). Type U, UL, and L cells constituted 31.7% (n = 45/283), 34.5% (n = 49/283), and 33.8% (n = 48/283) of the population, respectively. Figure 4C shows the relationship between neuron subtypes (Type U, UL, or L) and the depth from the cortical surface obtained from the rat described above. Although each subtype of neuron was
16
intermingled, there was a tendency for Type L neurons to exist in the deeper (ventral) area.
To confirm this tendency, the summed results obtained from 11 rats were analyzed (Fig. 4D).
The summed data indicate that Type L neurons populated a significantly deeper area compared to Type U neurons (P < 0.05, Kolmogorov-Smirnov test).
Type U, UL, and L neurons classified by late responses showed a similar distribution pattern (Fig. 4E). In addition, the rate of Type UL was higher in the late response than in the early response, suggesting that many neurons responded to both maxillary and mandibular molar pulp stimulation.
These results support the hypothesis obtained from the optical imaging: the initial responses are spatially separated in the S2/IOR but the maximum responses overlapped.
Fig. 4. Extracellular unit recording using 32 channel multi-electrodes. A, An example of a tract of the recording electrode. B, Typical examples of the neurons that showed early responses (< 20 ms onset from electrical stimulation) to maxillary molar (Type U), both to maxillary and mandibular molar (Type UL), and to mandibular molar stimulation (Type L). Bin width = 20 ms. C, The distribution patterns of Type U (black), UL (grey), and L neurons (white) in the same rat shown in A and B. The horizontal dotted line indicates the border between SII and GI. D, Summary of the distribution histograms of early response of Type U (black), UL (grey), and L neurons (white) obtained from 7 rats. Note that Type L neurons tended to be observed in deeper regions (P < 0.05, Kolmogorov-Smirnov test). E, Summary of the distribution histograms of late response neurons of Type U (black), UL (grey), and L (white) obtained from 11 rats. Note the less uneven distribution patterns in all types of neurons compared to early responses.
17
Discussion
The present study focused on the spatial distribution profiles of dental pulp sensation in S1, S2, and IC, and analyzed the initial and maximum excitatory areas responding to dental pulp stimulation of four teeth, the incisors and the 1st molars in the maxilla and mandible. It was found that the initial excitation was induced in the S2/IOR by both types of dental pulp stimulation, and was spatially segregated. In addition, the maximum excitatory areas in response to dental pulp stimulation were observed in both S1 and the S2/IOR, and most areas overlapped. These spatiotemporal features of S1 and S2/IOR responses to dental pulp stimulation were supported by extracellular multiple unit recordings.
Initial and maximum responses
The somatosensory and IC cortices receive sensory inputs independently from the thalamic nuclei (Ohara et al., 2005). In addition to thalamic inputs, cortico-cortical connections such as horizontal connections mediated by layer II/III pyramidal cells are prominent (Petersen et al., 2003). Indeed, single cell tracing studies have revealed local connections in S1 and the IC (Adachi et al., 2013). In addition, a previous study demonstrated that the excitatory propagation after initial responses is effectively diminished by application of CNQX, an AMPA receptor antagonist, in the IC, indicating that glutamatergic synaptic connections in the local cortical circuits play a major role in cortical excitatory propagation (Fujita et al., 2010).
The initial responses were defined as the excitation in the first frame showing the response (see Materials and Methods) and were likely directly induced by thalamic inputs, but not by cortico-cortical connections. On the other hand, the maximum responses were propagated from the initial response region and did not arise independently. This finding suggests that the maximum responses involve the summation of excitation around the core excitatory area, which corresponds to the initial excitatory area. Overall, the initial responses are suitable for making a topographic map of the teeth, because they reflect the direct inputs from the thalamus.
Dental field in S1
Previous studies have reported that incisor pulp stimulation evokes excitation in the ventral part of S1. The mandibular incisor region is located on the side ventral to the mentum, which is the most rostroventral part of S1. The maxillary incisor region is located in the region caudal to the tongue region and ventral to the barrel field (Remple et al., 2003). The present
18
optical imaging data replicates the previous findings and extends them by examining the molar regions, which have been unknown.
In contrast to incisor stimulation, no consistent S1 region was found to respond to molar stimulation in terms of initial responses. Interestingly, the maximum responses to molar stimulation excited the most rostral part of S1, which is adjacent to the motor cortex. This S1 region was also activated by incisor stimulation at the maximum responses, indicating a poor somatotopy. Several possible mechanisms may underlie these observations.
First, the amplitude of the initial response to molar stimulation was much smaller than the incisor response in S1. The optical signals corresponding to molar stimulation were just under the detectable level. Second, C fibers are dominant in molar pulp. Dental pain is mediated by Aδ and C fibers, which mediate fast and slow pain, respectively. Therefore, the initial responses may be mediated by Aδ, but not C fibers, and the maximum responses may involve C fiber-mediated inputs. This idea is supported by the finding that the S1 region responding to molar stimulus was not induced by excitatory propagation from the initial response region in the S2/IOR. If it is induced, slow pain, which is mediated by C fibers, is less topographically organized in S1. Another possibility is that molars do not directly project to S1. The initial response in the S2/IOR may induce the maximum response in S1 via direct cortical connections, as suggested by axonal projection patterns reported by Adachi et al. (2013).
Dental field in the S2/ IOR
The S2/IOR is the most consistent region that responded to incisor and molar stimulation.
The first response to mandibular incisor stimulation simultaneously occurred in S1 and S2.
Furthermore, the cytochrome oxidase histochemistry demonstrated that the mandibular incisor- responding region in S2 is densely stained by the cytochrome oxidase, indicating abundant axon terminals. These findings suggest that S2 receives direct inputs from the thalamus. The IOR corresponds or is located close to the IC subregion that is reported to induce rhythmic jaw movement by repetitive electrical stimulation (Zhang and Sasamoto, 1990; Maeda et al., 2014).
Thus, the IOR receives sensory inputs from the oral region and likely controls oral motor functions, including jaw movement.
The region that responded to maxillary incisor stimulation is located most dorsorostral in the mixed dental region, adjacent to S1. Therefore, the dorsorostral S2 may partially correspond to S1 responding to maxillary incisor stimulation (Remple et al., 2003).
Although the maximum responses to maxillary and mandibular incisor and molar stimulation were not somatotopically organized in the S2/IOR, their initial responses showed distinctive
19
nociceptive information processing: the IOR receives nociceptive inputs from molars, while the nociceptive information from incisors projects to the ventral S2. These findings indicate that both the ventral S2 and IOR play a similar role in dental nociception, and therefore, the IOR might be functionally involved in S2, as previously suggested (Shigenaga et al., 1974).
Comparison between optical imaging and extracellular recording
Similar to the topographically organized initial responses to dental stimulation obtained by optical imaging, the distribution pattern of neurons responding to maxillary and mandibular pulp stimulation in the extracellular recordings showed that neurons responding to mandibular molar stimulation were located in deeper areas than neurons responsive to maxillary stimulation.
However, several neurons responded to both maxillary and mandibular molar stimulation.
Both postsynaptic potentials (PSPs) and action potentials increase the optical signals, whereas extracellular recordings measure action potentials but not PSPs. Indeed, the latency of optical signals was faster than that of action potentials. Therefore, the early optical signals likely reflect PSPs only. If this is the case, it would suggest that inputs from the thalamus are spatially restricted. In contrast, after spike induction in pyramidal cells, which exhibit abundant axon collaterals in the adjacent region (Shi and Cassell, 1998; Adachi et al., 2013), local circuits are activated and less topographical organization may be observed. These properties of local circuits in the IC may underlie the mechanisms of plasticity in the oral region.
Spatially separated or overlapped areas responding to dental pulp stimulation
The present spatial profiles of rats might be inapplicable to human, because of rodent-specific functions of incisors such as grooming and exploring behaviors. The morphological structures of incisor (but not molar) are different from those of human teeth: wide apical foramen and continuous growing (Smith and Warshawsky, 1976). In addition, a single trigeminal ganglion cell considerably branches to the molar pulps (Atkinson and Kenyon, 1990). Although little information is available in terms of human S2, a functional magnetic resonance imaging (fMRI) study in human S1 demonstrates that the sensory representation of the tongue, upper incisor, and lips are located in the ventral-to-dorsal direction in the rostral postcentral gyrus, whereas these structures are overlapped in the rostral postcentral gyrus (Miyamoto et al., 2006). These features suggest that oral somatosensory information of different structures are partially processed in the same area of the cortex as is demonstrated in rat OM3 (Remple et al., 2003).
The present results also demonstrated the overlapped areas in S1 and S2, and thus, I consider
20
the spatiotemporal profiles of dental nociception in rat S1 and S2 may be applicable to information processing in human.
Why does mandibular incisor occupy larger cortical area in S1? As described above, rat incisors play multiple roles in comparison to molars. In this aspect, the mandibular incisors are more dynamically moved than maxillary incisors during feeding and grooming behaviors.
Therefore, more neurons might be recruited to process more information, which makes the area of mandibular incisor in S1 larger.
Functional implications
Topographic features of the initial and maximum responses appear controversial:
somatotopic organization in the initial responses with poor topographic distribution in the maximum responses. As described above, the initial responses likely reflect the distribution pattern of thalamic inputs, and therefore, sensory information from the thalamus is somatotopically arranged. This means that the location of a toothache is possibly identifiable.
However, the overlapping excitatory patterns in the maximum responses imply less topographic discrimination after the initial response. Nociception in the orofacial region frequently causes the perception of pain in other regions; this phenomenon is called referred pain (Bender, 2000), and clinical studies have reported that patients with diseased dental pulp misunderstand the site of dental (pulpal) pain. Less topographic organization of maximum responses may explain the poor localization of toothaches mediated by C fibers as follows.
Iwata and colleagues have demonstrated that intensive neural activity of primary sensory neurons is transmitted to adjacent primary neurons in the trigeminal ganglion via the release of growth factor (Shinoda et al., 2011; Matsuura et al., 2013; Ohara et al., 2013). In addition, secondary sensory neurons are involved in ectopic mechanical allodynia: fractalkine signaling activates microglia that releases IL-1β onto secondary trigeminal neurons, which increases their excitability (Kiyomoto et al., 2013). Injury or inflammation of dental pulp may increase the activity of C fibers, which may induce neuroplastic change in the cortex and induce poor localization of toothache. This hypothesis should be pursued in the future.
The IOR is located in the dorsal part of the IC and is adjacent to the IC gustatory area (Yamamoto, 1984; Yamamoto et al., 1984; Accolla et al., 2007). Notably, Yamamoto et al.
(1984, 1988) described IC neurons that respond to jaw movement and mechanical stimulation of the tongue. Taken together with the descending projections from the IC to the pain- receptive trigeminal caudalis (Sato et al., 2013), the IOR neurons may contribute not only to control nociception in the orofacial area but also to integrate multimodal sensations.
21
CHAPTER 2
Distinct excitation to pulpal stimuli between somatosensory and insular cortices
Hiroko Nakamura, Tetsuo Shirakawa, Noriaki Koshikawa, and Masayuki Kobayashi. Journal of Dental Research, 2016, in press.
Introduction
Symptoms of toothache are described in many terms, e.g., as sharp, piercing, aching, and dull pain (Narhi, 1990). This wide variation in pain may reflect the multiplicity of temporal responses of nociceptive neurons in the cerebral cortex. Somatosensory information from the dental pulp is processed in the most ventral part of the primary (S1) and secondary (S2) somatosensory areas and in the insular oral region (IOR) in rat cerebral cortex (Shigenaga et al., 1974; Hayama et al., 1993; Remple et al., 2003; Nakamura et al., 2015). The S1 regions that respond to maxillary and mandibular incisor pulp stimulation are discriminated by field potential recordings (Remple et al., 2003); however, a previous study demonstrated spatial overlap between the incisor and molar regions in S1 (Nakamura et al., 2015). In addition to the spatial profiles of S1 and S2/IOR, their temporal profiles of responses to dental pulp stimulation, which are characterized by the detection of the onset and duration of nociception (Iwata et al., 1998), have not been described.
Activity dependency on stimulation intensity is another critical factor used to estimate how noxious stimulus intensity is coded in the cerebral cortex. It has been shown that electrical stimulation at low and high intensities causes the activation of A and C fibers, respectively (Takemura et al., 2000; Fukui et al., 2007; Fujisawa et al., 2012). Changing the intensity of stimulation of the dental pulp would therefore vary the response amplitude in S1 and S2/IOR, and analysis of the intensity dependency of these responses may reveal which region between S1 and S2/IOR plays a principal role in encoding and discriminating dental sensation or other somatosensation.
In contrast to the body surface, the oral structures are spatially closed, and therefore, somatosensory and gustatory stimuli tend to activate bilateral and multiple sites. This feature may influence the cortical processing of this information via cortico-cortical connections, including transcallosal projections. Indeed, the insular cortex (IC) receives dense projections from adjacent cortical areas, including S1 and S2 (Shi and Cassell, 1998), and from the
22
contralateral IC (Fujita et al., 2012). Determination of the information processing mechanisms in multiple oral regions is critical to understanding the integration of oral functions.
However, in terms of nociception in dental pulps, it is completely unknown whether simultaneous dental pulp stimulation of two dental pulps induces additive or synergistic effects on S1 and S2/IOR responses.
In the present study, the findings regarding the spatial and temporal coding of nociception in dental pulps from experiments using optical imaging were compared between S1 and S2/IOR, and the functional significance of S1 and S2/IOR in addition to their hierarchical and topographical organization was discussed.
Materials and Methods
The experimental protocol used in this study was approved by the Animal Experimentation Committee at Nihon University. The animal treatments were performed in accordance with ARRIVE (Animal Research: Reporting of In Vivo Experiments) guidelines and the institutional guidelines for the care and use of experimental animals described in the National Institutes of Health Guide for the Care and Use of Laboratory Animals.
In vivo optical imaging
All optical imaging experiments were performed using a voltage-sensitive dye (RH1691, Optical Imaging, New York, USA) with the previously described method (Fujita et al., 2011, 2012; Mizoguchi et al., 2011; Horinuki et al., 2015; Nakamura et al., 2015). Briefly, 6- and 7-week-old male Sprague-Dawley rats (244.0 ± 9.8 g, n = 46, Sankyo Labo, Tokyo, Japan) were intraperitoneally injected with atropine methyl bromide (5 mg/kg) and urethane (1.4 g/kg), and additional urethane was added as needed. Body temperature was monitored and maintained at ~37˚C using a rectal probe and a heating pad (BWT-100, Bio Research Center, Osaka, Japan). Lidocaine (2% gel, AstraZeneca, Tokyo, Japan) was applied to the incisions to ensure complete analgesia. A custom-made stereotaxic snout frame was used to image the left cortex using a CCD camera (MiCAM02, Brainvision, Tokyo, Japan) mounted on a stereomicroscope (Leica Microsystems, Wetzlar, Germany).
RH1691 (1 mg/ml) was applied to the cortical surface for approximately 1 hour. The cortical surface was illuminated through a 632 nm excitation filter and a dichroic mirror using a tungsten-halogen lamp (CLS150XD, Leica Microsystems). The fluorescent emission was
23
captured through an absorption filter (λ > 650 nm long-pass, Andover, Salem, NH, USA). The CCD camera had a 6.4 × 4.8 mm2 imaging area (184 × 124 pixels).
Acute bleaching of the dye was canceled by subtraction of values in the absence of any stimuli from each recording. The sampling interval was 4 ms, and 40 consecutive images were averaged to improve the signal-to-noise ratio.
Electrical stimulation
Bipolar electrodes made from an enamel-coated copper wire (diameter = 80 μm) were inserted into the contralateral maxillary 1st molar pulp. For S1 mapping, the contralateral maxillary and mandibular incisors and the 1st molars were also stimulated. The tip of the wire (0.5-1.0 mm) was bared and fixed with dental cement. For electrical stimulation, voltage pulses of 100 μs duration and 1-7 V amplitude were applied using a stimulator unit (STG2008, Multi-Channel Systems, Reutlingen, Germany), and five voltage pulses at 50 Hz were applied at 20 s intervals.
An additive or synergistic effect of simultaneous stimulation of dental pulps was estimated by stimulation of the ipsilateral maxillary molar pulp or the contralateral mandibular molar pulp in combination with the contralateral maxillary molar pulp. The stimulation intensity of each pulp was set at 2-4 V, which evokes a middle or lower response amplitude, to avoid the saturation of evoked responses by simultaneous stimulation of two dental pulps.
Morphology
After optical imaging, the animals were perfused with 4% paraformaldehyde in 0.1 M phosphate buffer, and the brains were removed and stored in fixative overnight at 4°C. The brains were submerged in 30% sucrose in 0.1 M phosphate buffer until they sank. The cerebral cortex was transversely sectioned at 70 μm after the hemisphere was flattened. Sections were immersed in a solution containing 0.05% cytochrome C, 0.08% DAB, 4% sucrose and 0.1 M phosphate buffer and then incubated at 37°C for 2-6 hours in the dark until the barrel columns were visible (Wong-Riley, 1979). After being rinsed with 0.1 M PB, sections were mounted and coverslipped. Stained sections were imaged using a microscope (BZ-9000, Keyence, Osaka, Japan).
Data analysis
Changes in the fluorescence intensity relative to the initial value (ΔF/F) were processed with a spatial filter (9 × 9 pixels) and analyzed using a Brain Vision Analyzer (Brain Vision LLC,
24
Morrisville, NC, USA). A significant response was defined as a signal > 7 SD of the baseline noise. The initial response was obtained by outlining the evoked excitation in the 1st frame that exhibited a significant signal increase. The maximum response was defined as the outline of the excitation in the frame with the maximum amplitude in the center of the initial response.
Data are expressed as the mean ± SEM. Student's t-test was used to compare the kinetics of excitation between S1 and S2/IOR. The dependency of stimulation intensity was examined by comparing the amplitude and area of responses to 1-7 V, and Student's t-test was used for the comparison between S1 and S2/IOR. An additive or synergistic effect was evaluated by paired t-test with Bonferroni correction. Differences were considered significant when P <
0.05.
Results
Temporal kinetics of pulpal stimulation-induced optical responses
Optical response kinetics, including the latency, amplitude, rise and decay time, and half duration, were examined to determine the cortical neuronal response profiles. A single electrical stimulation of the maxillary 1st molar pulp at 5 V induced excitation in S2/IOR and propagated in an almost concentric manner (Fig. 1A). S1 was excited ~4 ms after S2 activation (Fig. 1A-C; n = 11; P < 0.001, paired t-test). The amplitude of excitation in S2/IOR was significantly larger than that in S1 (Fig. 1C; n = 11; P < 0.001, paired t-test). Although the half duration was almost comparable between S1 and S2/IOR, the optical response in S2/IOR was faster in rise time (Fig. 1C; n = 11; P < 0.05, paired t-test) and longer in decay time (Fig. 1C; n = 10; P < 0.001, paired t-test). These findings suggest the earlier onset of neural firing, higher neural activities, and longer firing period in S2/IOR than S1.
Next, short-term plasticity against paired-pulse stimulation were examined (Fig. 1D-F).
The inter-stimulus interval (ISI) was set at 100, 200, and 300 ms. Paired-pulse depression was observed at these ISI, which gradually recovered when the ISI was longer. At 300 ms ISI, a larger recovery of the 2nd response in S2/IOR was observed (n = 10, P < 0.05, paired t-test), although there was no significant difference in the recovery kinetics of paired-pulse depression between S1 and S2/IOR at 100 or 200 ms ISI (Fig. 1F).
25
Fig. 1. Kinetics of cortical excitation revealed by optical imaging in the primary (S1) and secondary (S2) somatosensory cortices and the insular oral region (IOR). (A) An example of S1 and S2/IOR responses to a single electrical stimulation of the maxillary molar pulp. Note that the first responses in S2/IOR (arrow) and S1 (arrowhead) were observed 10 and 14 ms after stimulation, respectively. (B) Time course of excitation in S1 (black) and S2/IOR (blue) indicated by asterisks in (A). Time-expanded traces indicate a shorter latency in S2/IOR than in S1 (inset). (C) Comparison of the latency, peak amplitude, rise and decay time, and half duration of excitation between S1 and S2/IOR (n = 11). (D) Short-term plasticity responses to paired-pulse stimulation at 100, 200, and 300 ms inter-stimulus intervals (ISI). (E) Temporal profiles of optical signal amplitudes in S1 (black) and S2/IOR (blue) ROIs shown in (D) during responses to paired-pulse stimulation (arrows). Paired- pulse depression was observed at all ISI. (F) Larger recovery of the 2nd response in S2/IOR than in S1 at 300 ms ISI (n = 10). D, dorsal; MCA, middle cerebral artery; R, rostral; RF, rhinal fissure. *P < 0.05, ** P < 0.01,
*** P < 0.001, paired t-test.
26
Dependency of pulpal stimulation intensity
S2/IOR required a lower threshold to evoke excitation than S1 (Fig. 2). Stimulation at 1 V evoked no response in S1 (n = 12), whereas 7/12 animals showed a small but significant response in S2/IOR. Stimulation at 2 V evoked a significant response in S1 in 4/12 animals and in S2/IOR in 11/12 animals. Increasing the intensity of stimulation increased the rate at which the animals showed a significant response (Fig. 2C) and caused larger responses both in S1 and S2/IOR (Fig. 2D). The amplitude of responses in S2/IOR was consistently larger than in S1 (Fig. 2D; n = 10; P < 0.001-0.05, paired t-test). On the other hand, the activated area in S2/IOR that responded to stimulation at 1-5 V was almost comparable to that in S1, although
Fig. 2. Stimulation intensity-dependent optical signal amplitude in S1 and S2/IOR. (A and B) The initial and maximum responses (see Materials and Methods) in S2/IOR (A) and S1 (B) are superimposed in reference to the rhinal fissure and middle cerebral artery (n = 10). Black outlines indicate the overlapped areas in 5/10 rats. The intensity of stimulation was set at 1-7 V. (C) The threshold of optical responses was lower in S2/IOR than in S1.
In the case of stimulation intensity at 1 V, S2/IOR showed an optical response at 1 V in 7/12 rats, but no rat showed a significant response in S1. (D) The peak amplitudes of optical signals in S1 and S2/IOR plotted against the stimulation intensity. Note the larger amplitude in S2/IOR than in S1. (E) The maximum area of optical signals in S1 and S2/IOR plotted against the stimulation intensity. *P < 0.05, ** P < 0.01, *** P < 0.001, paired t-test.