INFORMATION: INFORMATION ON TRANSPORTATION BY MEANS OF EXPRESSWAY TOLL AND PUBLIC
TRANSIT INFORMATION
September 2006
KUMAMOTO UNIVERSITY
A Thesis Submitted for the Degree of Doctor of Philosophy
YALCIN ALVER
Graduate School of Science and Technology Kumamoto University
Kumamoto, Japan
ABSTRACT
Welfare development during industrial era caused a huge need for mobility.
Thus, increases in the number of vehicles have been followed by the construction of new road infrastructure. However, as the rate of growth in car ownership especially in big cities was so fast that supply of new road infrastructure fell behind. The capacities of existing road network become very small. Thus, congestion problems occur and these problems affect people from many different perspectives. The social and environmental consequences of building new roads could be far more severe than the beneficial effects of motorists. Consequently, transportation research is focusing on using the available infrastructure more efficiently.
Nowadays, information is one of the most popular words. Right information at the right place at the right time becomes a very valuble source. Development in technology and the idea to use information in transportation have taken its place in transportation studies. In this dissertation, we have examined the effects of information on transportation with two case studies. In the first case study, expressway toll was considered as information for drivers in Kumamoto City, Japan. In the second case study, the effects of transit information and its service levels were investigated for the satisfaction of transit users. The main objective of the study is to identify the importance of information for the effective usage of transportation.
Traffic has become a big problem in Kumamoto (Japan) because of the large proportion of trucks in traffic. Thus, we have thought that converting some of the traffic from ordinary road to expressway, which passes through the city center, could help to solve this problem. First case study investigates travel behaviors and route choice decisions of production and freight companies in Kumamoto Prefecture.
In Chapter 2, a route choice model was investigated with the information of discounted expressway toll. In this model, both Revealed Preference (RP) and Stated Preference (SP) data were combined and a combined RP/SP model was proposed for the estimation on route choice decisions of freight and production companies. Modeling was done in four steps and finally a combined RP/SP model was estimated in two different forms; linear and non-linear.
In the third chapter, Value of Time (VOT) was studied. As an important instrument to evaluate transportation projects, VOT was used to evaluate the proposed models. VOT had been considered as a constant value, however; some studies investigated the variation on VOT with different factors. In this dissertation, we have investigated the variation on VOT with different socioeconomic (SE) characteristics.
Considered SE characteristics are mainly company type. Then number of employee working in the company and the number of vehicles owned by the company were considered to identify the effects of company size. For this purpose, final route choice
model was estimated as a non-linear function in which three SE variables were introduced in four models. Results showed that VOT decreases with increasing travel time in estimated four models. Calculated values for freight and production companies are very different from each other. In addition, company size has an effect on VOT.
In the fourth chapter, two route choice experiments were discussed. These experiments were conducted to identify the effects of toll discount by applying 50%
discounted toll to expressway. The effects of the experiments were identified by discussing the surveys and traffic counts, which were done before and during the experiments. Finally, the ability of proposed model to estimate the actual route choice decisions of considered companies were tested. Results showed that proposed model could estimate the actual route choice decisions of companies under toll discounts 75%
in average. The estimation results for the second experiment were better, which covers longer part of the expressway than the first one.
Chapter 5 was prepared to discuss the second case study. In this chapter, effects of transit information and its service levels in Izmir City, Turkey were investigated. As the third biggest city in Turkey, Izmir City has a large public transit network.
Metropolitan municipality spends great effort and funds to provide more efficient public transit service by introducing new transit services. Information could be used as a tool to improve the service level with less cost. In this case study, we have investigated the characteristics of transit and non-transit users. Transit information types and their service levels, which were considered by transit users, were identified in three different models by using ordered probit modeling. Firstly, model is estimated for all transit users. Then considering the differences among transit modes, two different models were estimated. First model for subway and boat users (segment 1), which have high service quality, and second for bus and dolmus modes (segment 2) which have poor service quality. There are some differences between the considered information types with its service levels among segments.
Significant information categories for all transit users are; frequency of the service, fare information, number of transfers needed, operating hours of service, information about walking distance to/from the station and waiting times at the stations.
Results showed that some socioeconomic factors effect the satisfaction level of the transit users such as; income, education level and having a car. Satisfaction levels for considered two mode segments are different from each other. Especially, the probability for the not satisfied answer for the hypothetical scenario is different.
Probability of dissatisfaction for bus and dolmus users is higher.
This dissertation investigates the effects of information on transportation with two different case studies in two different countries. Results of the both case studies proved that information has a significant effect for the effective usage of current
ACKNOWLEDGEMENTS
I am deeply indebted to Professor Shoshi Mizokami for his encouragement, advice, and research support throughout my Ph.D. research at Kumamoto University. This dissertation is part of the research carried out through his vision throughout last three years. Without his trenchant critiques, the probing questions and the remarkable patience, this thesis would not have materialized. I have learned so many things from him. His patience and kindness have been invaluable to me. Professor Mizokami's observations and comments helped me to establish the overall direction of the research and to move forward with investigation in depth. I am very grateful for his acceptance of me into his laboratory and for giving me the invaluable opportunity to fulfill my Ph.D. study. Thank you very much Professor Mizokami, for your time, effort, support, encouragement and inspiration over the last three years.
I would like to express my very special gratitude to the dissertation committee members, Prof. Kobayashi Ichiro, Prof. Kakimoto Ryuji and Prof. Yano Takashi for their great and kindly assistance, valuable discussions, fruitful comments and suggestions about this dissertation.
I am indebted to my many colleagues for providing a stimulating and fun environment in which to learn and grow. I am especially grateful to Dr. Michelle Parumog and Mr. Hashiuchi. Dr. Parumog always helped me to understand discrete choice models and many other subjects about transportation planning. Mr. Hashiuchi answered my all questions all the time when I was trying to encode Japanese questionnaires. He helped me a lot to arrange the data. A special thanks goes to many other colleagues currently or formerly working in Prof. Mizokami's laboratory for their friendliness and encouragement in carrying out our work in the laboratory and my life in Japan. I do not want to forget my tutors Mr. Baba and Mr. Morisaki who always helped me a lot to make me comfortable in Kumamoto.
I express my deepest appreciation to Prof. Nalan Kabay of Ege University, for introducing me this great opportunity to study in Kumamoto University. I greatly acknowledge Kumamoto University for supporting me the last three years to finance my school life.
I am blessed with my wonderful family. Distance cannot keep my parents; Rabia and Fikret and my brother, Yucel from showing their love and support. I would like to thank my family for the support they provided me through my entire life. I cannot express how much I appreciate their love, support and tremendous sacrifices throughout my life.
Words cannot express my gratitude to my wife, Ninel Alver, who always supported me.
She believed in me more than I believed myself. Her love always motivated me in my study life. She was with me when I needed her. Thank you for your love and inexhaustible support.
Finally, I would like to dedicate my dissertation to four gorgeous people in my life;
my parents Rabia and Fikret, my brother Yucel and my lovely wife Ninel.
TABLE OF CONTENTS
Abstract I
Acknowledgements Ill
Table of Contents V
List of Figures IX
List of Tables XI
List of Abbreviations XIII
Chapter 1 Introduction 3
1.1 Background 3
1.2 Applied methodologies to the case studies 5
1.3 Objectives ofthe study 9
1.4 Outline of dissertation 10
Chapter 2 A Combined RP/SP Route Choice Model with Information of
Expressway Toll-Case Study 1 15
2.1 Introduction 15
2.2 Conducted surveys 16
2.2.1 Route choice survey 16
2.3 Modeling methodology 22
2.3.1 Background for estimation approach 23
2.4 Model structure 26
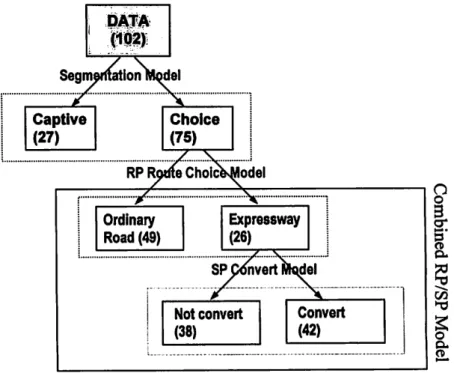
2.4.1 Segmentation model 27
2.4.2 Route choice model with RP data 27
2.4.3 Conversion model with SP data 28
2.4.4 Combined RP/SP model 29
2.5 Modeling results 36
2.5.1 Segmentation model results 36
2.5.2 Results of route choice model with RP data 37 2.5.3 Results of conversion model with SP data 37
2.5.4 Combined RP/SP model results 38
2.5.5 Comparison of estimated models 38
2.5.6 Non-linear combined RP/SP model results 40
2.6 Conclusion 41
Chapter 3 Value of Time: Evaluation of the Estimated Models and
Variation on Value of Time 45
3.1 Introduction 45
3.2 Background 45
3.3 Value of time for the evaluation of the estimated models 47
3.4 VOT Distribution in Mixed Logit Estimation 53
3.5 Conclusion 55
Chapter 4 Route Choice Experiments and Verification of the Estimated Models.59
4.1 Introduction 59
4.2 Route choice experiments 60
4.2.1 Questionnaires delivered to expressway users 62
4.2.2 Questionnaires delivered to others 65
4.3 Verification of pre-estimated models 66
4.3.1 Aggregated based comparison 67
4.3.2 Disaggregated comparison 68
4.4 Transferability of pre-estimated model to pooled data conditions 69
4.4.1 Pooled data 69
4.4.2 Transferability 70
4.5 Conclusion 73
Chapter 5 Investigating the Effects of Public Transit Information and
Its Service Levels 79
5.1 Introduction 79
5.2 Transit information systems 80
5.2.1 Pre-trip information systems 81
5.2.2 Wayside information systems 82
5.2.3 In-vehicle transit information 82
5.3 Previous studies 83
5.4.1 General information 84
5.4.2 Transit information 85
5.5 Conducted survey 86
5.5.1 First part: commute and socioeconomic characteristics 86 5.5.2 Second part: transit characteristics and chosen information types 87
5.6 Significant findings of the survey 91
5.6.1 Characteristics of transit and non-transit users 91 5.6.2 Characteristics of non-transit user who will consider transit and not...93 5.6.3 Considered information sources to get transit information 95
5.7 Modeling methodology 96
5.7.1 Background 96
5.7.2 Modeling the survey data 98
5.8 Estimated results 99
5.8.1 Subway and boat users 104
5.8.2 Bus and dolmus users 105
5.9 Conclusion 106
Chapter 6 Conclusions Ill
References 117
Appendix 125
LIST OF FIGURES
Figure 2.1 Study area 17
Figure 2.2 Business trip directions of companies 18
Figure 2.3 Factors which effect drivers' route choice decisions 19
Figure 2.4 Decision of companies during congestion 19
Figure 2.5 Expressway usage rates of companies 20
Figure 2.6 Stated preference questions 22
Figure 2.7 Ordinary road users' willingness to pay bids for expressway toll 23
Figure 2.8 Steps of the estimation 26
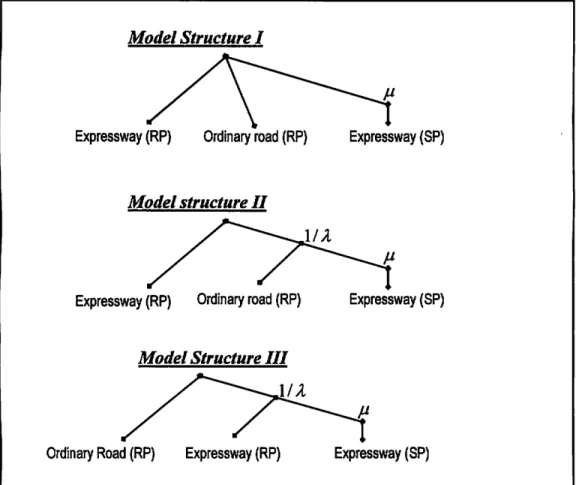
Figure 2.9 Estimated route choices with RP data for companies 28 Figure 2.10 Estimated combined RP/SP model structures 33
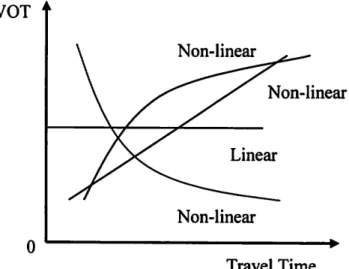
Figure 3.1 Possible variation drawings for VOT 49
Figure 3.2 VOT curves for company types in combined RP/SP non-linear model 1 ...52 Figure 3.3 VOT curves for different company types and number of total vehicles 52
Figure 3.4 VOT distributions 55
Figure 4.1 Interchanges and distances between them in route choice experiments 60 Figure 4.2 Comparison of traffic volume for RCE 1 and 2 61
Figure 4.3 A sample postcard shaped questionnaire 62
Figure 4.4 Company types and route choices before the RCEs 64 Figure 4.5 Comparison of increase rates of traffic volume during RCEs with
estimated results 67
Figure 5.1 Map of Turkey 84
Figure 5.2 Location of metropolitan city area with municipalities 85 Figure 5.3 Distribution of the age groups in all samples 86 Figure 5.4 Distribution of the answers for car ownership in the data 87 Figure 5.5 Distribution of the survey results depending on mode choice 88 Figure 5.6 Socioeconomic characters and their distribution among mode choices 92 Figure 5.7 Socioeconomic characters and their distribution among non-transit
users 94
LIST OF TABLES
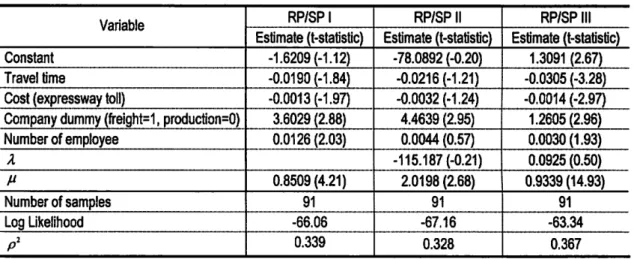
Table 1.1 Average toll rates on various projects JPY/km 9 Table 2.1 Comparison of estimated combined RP/SP model structures 34
Table 2.2 Results of segmentation model 37
Table 2.3 Results of estimated models with all variables 39 Table 2.4 Results of estimated non-linear models (second step) 40
Table 3.1 Calculated VOTs in each model (JPY/min.) 50
Table 3.2 VOT used in Japan to evaluate projects 53
Table 3.3 Results of estimated mixed nested logit model 54 Table 4.1 Sample characteristics of postcard shaped survey for RCE 1 and RCE 2....63
Table 4.2 Sample characteristics of surveys delivered to freight and production
companies 65
Table 4.3 Hit ratios of pre-estimated model in linear and non-linear forms 68 Table 4.4 Hit ratios of pre-estimated model for freight and production companies 69 Table 4.5 Estimation results for pre-estimated and pooled data 70
Table 4.6 Chi-squared values for the pooled data 72
Table 4.7 Results of asymptotic t-test 73
Table 5.1 Different distribution methods of transit information 81 Table 5.2 Distribution of some socioeconomic variables for transit and non-transit
users 92
Table 5.3 Distribution of some socioeconomic variables for non-transit users 94 Table 5.4 Accepted information sources to reach transit information 95 Table 5.5 Results of the estimated model for transit users with all variables 100 Table 5.6 Estimated model results with significant variables for transit users 101 Table 5.7 Results of the estimated model for subway and boat users 104 Table 5.8 Results of the estimated model for bus and dolmus users 105 Table 5.9 Significant information types and service levels 107 Table 5.10 Probabilities in the ordered probit model 108
LIST OF ABBREVIATIONS
APTS Advanced Public Transit Information Systems ATIS Advanced Transit (Traveler) Information Systems ETC Electronic Toll Collection
EW Expressway
GEV Generalized Extreme Value IC Interchange
IIA Independence from Irrelevant Alternatives IID Independent and Identically Distributed JPY Japanese Yen
LCD Liquid Crystal Display LOS Level of Service LRT Light Rail Transit MNL Multinomial Logit
NMNL Nested Multinomial Logit MMNL Mixed Multinomial Logit OR Ordinary Road
RCE Route Choice Experiment RP Revealed Preference SP Stated Preference
TDM Transit Demand Management TIS Transit Information Systems SE Socioeconomic
VOT Value of Time
VTC Value of Time as a Commodity VTR Value of Time as a Resource VTS Value of Time Savings
VTTS Value of Travel Time Savings
YKR Yeni Kurus (Turkish smallest money unit) YTL Yeni Lira (Turkish money unit)
Introduction
1. INTRODUCTION
1.1 Background
Movement of people and/or goods has an important part in nowadays life. In the beginning of 1900s with industrialization, movement of goods and people had started to increase rapidly. In order to engage some activities such as leisure, going to school or work, and shopping, people need transportation. In addition, raw materials are carried to factories and consumption goods are delivered to shops. All these activities need a complex transportation network.
Transportation takes places in three different modes. The history of two of them is very old; sea and land transportation. The development in technology and science added air transportation as the third alternative. Considered transportation mode in this study is land transportation. Land transportation was done on foot or with some animals such as horses, thus, transportation infrastructure was not necessary. However, the introduction of steam power brought the development of trains and railways.
Afterwards the introduction of diesel engines and then automobiles had changed this situation. The mobility and practical usage of vehicles forced the governments to introduce large road networks. However, it was not until the 1950s that the price of the car became affordable for many households. Since then, the rate of growth in car ownership has been immense (Emmernik, 1997).
Welfare development during industrial era caused a huge need for mobility.
Thus, increases in the number of vehicles have been followed by the construction of new road infrastructure. However, as the rate of growth in car ownership especially in big cities was so fast that supply of new road infrastructure fell behind. The capacities of existing road network become very small. Thus, congestion problems occur and these problems affect people from many different perspectives. The solution seems not complicated and easy. Adding new road networks or improving old ones could solve the problem. Conversely, the solution is more complex then it seems. The main reasons that make this problem so complex are:
I. Governments and local municipalities could not afford to introduce new road infrastructure. It is very costly and such problems as immigration to cities from rural areas and rapid increase in motorization cause a huge need for such infrastructure.
II. The current condense structure of most developed cities do not allow a physical room for expanding current roads because there is no land to introduce infrastructure.
III. Land is a scarce resource in urban areas. It can be used more effectively for other purposes.
IV. New infrastructure is adding new pages to environmental problem lists.
The recent studies show that there is another solution for this problem which is not as costly as introducing new infrastructures. The social and environmental consequences of building new roads could be far more severe than the beneficial effects of motorists (Mogridge, 1990). Consequently, transportation research is focusing on using the available infrastructure more efficiently (Horn et al., 1995, Rienstra et al.,
1996).
Funding transportation infrastructures has a big portion in government budgets.
In addition, maintenance such as repair and service cost needs a special budget every year. Road infrastructures also cause direct and indirect environmental problems.
Disturbing the environment and natural life is one of the biggest damage caused by new roads. On the other hand, in a completely transport-dependent society, the overriding role of transport in the nation's economic and social development is to continue the levels of service that have contributed to the economic progress up to date.
Transportation policies need to be aimed directly at supporting national and community goals. National goals that can be substantially aided by transportation include increasing industrial productivity, promoting energy efficiency, facilitating trade, upgrading the cities, protecting the environment, guiding urban growth, and exploiting the opportunities conferred by the global economy. In short, transportation is one of the locomotives of economy. Without transportation, economic development cannot go further thus governments spent great effort to solve such problems. These goals must also consider environmental and social impacts and techniques used to decrease those impacts.
As the discussed problems above suggest that effective usage of available infrastructure is one of the most suitable and realistic ways to solve such problems.
This study is focused on importance of information and information systems for the effective usage of available infrastructure and transportation items.
a) Information on transportation
The definition of information is very large; it has many meanings depending on context, but is as a rule closely related to such concepts as meaning, knowledge, instruction, communication, representation, and mental stimulus. The word
"information" is used many times nowadays; every body is looking for some information for something. The internet search on the word information finds around 13 billion results.
The increasing education level of the human being makes him information dependent. In daily life, we are looking for information for everything such as political or economic information, information about weather, information about the sales in the
our lives, we search for information as well. Since time spent for transportation become longer and costly, people have been focused on their trip decision more carefully.
Information for transportation takes an important role on the trip decision process of travelers. People consider information on transportation more then before.
Some factors made information important and valuable for transportation such as:
• With the increasing education level, people would like to be informed more for everything which affects their lives.
• Busy city lives makes travel timesaving more valuable, because time spent for travel is increasing with congested conditions.
• Increased economic welfare increases the comfort level of people thus; they are looking for comfort in their trips.
• Development of technology allows people to reach a wide range of information from everywhere and every time.
• In addition, increasing travel costs force people to reduce their travel costs.
In this study, we have focused on how the trip behaviors are affected by information related with transportation. Two different case studies were conducted with two different aims to investigate the effects of information on travelers' (decision makers) decision process.
In the first case study, information about expressway toll was investigated on the route choice decisions of freight and production companies in Kumamoto City, Japan. In this case study, expressway toll is considered as an important information for the considered companies. We have investigated that if the toll would be decreased 50%, would it have an effect on the route choice decisions of freight and production companies.
In the second case study, the affects of transit (public transit) information and its service levels were investigated on the satisfaction of the transit users from the current service conditions. This study focused on the transit information and its service levels.
The satisfaction levels of the transit users were investigated by considering the different service levels of available transit.
1.2 Applied methodologies to the case studies
Investigating the effects of information on both route choices of the companies in Kumamoto City and effects of transit information and its service levels in Izmir City some concepts and methodologies were considered.
a) Revealed and stated preference data and combining both data
In most cases, Revealed Preference (RP) data are used in route choice analysis.
RP data are choices made under real situations. For instance, actual route choice decision from one destination to another with information about attributes of each alternative route can be classified as RP data. It is based on actual market behavior and may not directly predict responses to new or improved alternative attributes. More so, employing RP survey require higher costs due to large number of sample needed and often not enough information is available for the group of options due to the problems of correlation of attributes or small variability (Ortuzar, 1998).
Stated Preference (SP) data are commonly used when alternatives are not yet present. It can measure not-yet existing travel modes, or how people take actions in adopting new policies (toll pricing, introduction of new mode or road). Introduction of SP data based alternatives may avoid costly actual implementation and provide important sensitivity analysis before actual policy implementation, because new alternatives in transport policy are often highly visible and would require a lot of time and cost. Generally, there is no opportunity to evaluate actual responses for a policy implementation through the collection of RP data. Stated preference experiments help to collect data about situations which are not present at the moment. Thus, SP data has been used intensively in recent transport research.
Both RP and SP data types have their own advantages and disadvantages. The point is some of the disadvantages of RP data are the advantages of SP data. Some researchers in different fields recognized this idea and they tried to combine these two data types. In the field of marketing and transportation some studies were conducted to combine two data types to estimate more efficient models (Ben Akiva, Morikawa, 1990;
Swait and Louviere, 1993; Bradley and Daly, 1997). Simultaneously, these methods were used in the field of environment (Cameron, 1992; Adamowiccz, Louviere, and Williams, 1994). The combination of RP and SP data seeks to exploit the contrasting strengths of the various approaches while minimizing their weakness.
b) Discrete choice models
A discrete choice model is an econometric model in which the actors are presumed to have made a choice from a discrete set. Discrete choice models describe the choices of individuals among a set of alternatives. The definition of individuals covers individual decision makers or a group of decision makers. Discrete choice models are broadly used for the analysis of individual choice behavior. Some of the recent examples of applications to predict changes in demand and market shares are;
choice of travel mode, new product pricing, and choices of any other consumer products.
The choice set of alternatives needs to exhibit three characteristics to fit with a discrete choice framework. First, the alternatives must be mutually exclusive from the decision maker's perspective. Each alternative must be exclusive in the alternative set and the decision maker must choose only one alternative. Second, the set of alternatives must cover all possible alternatives that can be chosen by decision maker. The last one is the number of alternatives must be limited in discrete choice models.
Discrete choice models have been used for many years in many different fields.
Transportation related first studies were binary choice of travel mode (Warner, 1962;
Lisco, 1967, Stoper, 1969). Stoper and Lisco (1970) studied policy sensitive models for predictions of the market share. After 1970s, discrete choice models were studied in many fields in transportation. Some examples are the choice of mode for travel to work (Atherton and Ben-Akiva, 1975; Daly and Zachary, 1979).
c) Road-pricing
Since the development in automobiles with the development of mobility for both goods and people, there have been some problems in transportation networks depending on congestion. With the increasing road networks and car ownership road transport will continue to service a major share of both passenger and goods market. As the symbol of the freedom and mobility, automobiles will serve to people at least for the next decades.
Increased use of automobiles caused many problems, congestion in urban areas is one of the most negative effects and brings some others such as noise, accidents, emissions so on. To tackle this, charging for the individual use of the road is an increasing solution. Charging could appear in many forms. It may be indirectly related to road use, as is the case with annual license fees or gasoline tax. Generally, the term road pricing is used for direct charging rather than indirect charging.
Road pricing means that motorists pay directly for driving on a particular roadway or in a particular area. Road pricing has two main objectives:
I. Funding transportation programs: Road pricing is used as an efficient revenue generation method for transportation projects.
II. Congestion management: Road pricing can be used to reduce peak-period traffic for efficient usage of transportation network. In addition, it helps to solve other transportation related problems such as emissions, accidents, etc.
Seven road-pricing categories can be counted. Some provide revenues, some reduce peak-period congestion, some reduce total traffic impacts (congestion, pollution, accident risks, road and parking facility costs, etc.), and some help achieve a combination of objectives these categories are (TDM Encyclopedia):
1) Road tolls: Such as fixed rates for expressways or bridges.
2) Congestion pricing: A fee that is higher under congested conditions than uncongested conditions.
3) Cordon fees: Fees charged for driving in a particular area.
4) Hot lanes: A high-occupant-vehicle lane that accommodates a limited number of lower-occupant vehicles for a fee.
5) Distance-based fees: A vehicle use fee based on how many miles a vehicle is driven.
6) Pay-As-You-Drive insurance: Prorates premiums by mileage so vehicle insurance becomes a variable cost.
7) Road space rationing: Revenue-neutral credits used to ration peak-period roadway capacity.
One of the most common categories used in the world for the listed objectives is road tolls. For many years, governments then governments and private companies have been funding highway and bridge improvements by the funds collected by tolls. Such tolls are a fee-for-service, with revenues dedicated to roadway project costs. This is considered more equitable and economically efficient than other roadway improvement funding options which cause non-users to help pay for improvements.
As discussed above, increasing demands due to development sprawl and the high costs of investments in infrastructure building forced governments to increase tax collections to allow for appropriate funds for financing infrastructure projects. In Japan, the 1956 Law Concerning Special Measures for Highway Construction was legislated to introduce toll road system to compel costs on expressway users to finance infrastructure investments.
Road pricing as a toll used for revenue generation and congestion management, not all the time hit all the targets. As an example, a fixed road toll may do little to reduce congestion if alternative routes and modes are poor, but it may provide significant congestion reductions if transportation alternatives are relatively attractive, and thus, a modest fee will cause a relatively large mode shift.
In Japan, the alternative ordinary roads to tolled expressway is poor and always crowded. In addition, road tolls in Japan are very high compared to other countries.
Refers to Table 1.1.
High toll rates and poor alternative ordinary roads force us to consider the available toll rates for more efficient transportation in Japan.
Table 1.1 Average toll rates on various Country (project)
Malaysia (North-South Expressway) China (Guanzhou-Shenzhen Superhighway) Colombia (Buga-Tulua Highway)
USA(Sr-91)
Mexico (Mexico City-Toluca Toll Road) Japan (Kyushu Expressway)
projects JPY/km Toll(JPY/km)
3.4 5.6 11.2 2.3-17.9'
22.4 25.8
* varies depending on time
d) Transit information systems
Transit Information Systems (TIS) is the application of Advanced Traveler Information Systems (ATIS) into Public Transit. ATIS is the common name of technologies that provides traveler with information about travel options, times, delays and/or congestion. ATIS provides information both for transit users and car users. The application of such information into public transit concept is called TIS. The aim of TIS is providing the right transit information, at the right place, at the right time to the available and/or possible transit users. The challenge is defining the right information from both an operator's and a user's perspective and delivering that information where it can be used in a timely fashion.
Transit information systems provide passengers with information on one or more modes of transportation service to assist decision maker. This assistance can be before the trip (pre-trip) or while already traveling (en-route). En-route transit information can help the users to make their decisions about their trips on the way or at the stops/stations (wayside) or while they are traveling on the train/bus (in-vehicle).
Basically, information can be provided to the trip maker anywhere starting from his/her decision process at home to reaching the final destination.
Transit information systems can provide real-time (dynamic) information and/or static information (schedules, fares, etc.). Development of technology brings development in transit information systems. Many technologic devices are used for this purpose. Nowadays there is a huge set of technologies and media available to distribute transit information systems such as; TV, internet cell phones etc. In addition, traditional techniques are still in charge and effective to deliver transit information as; newspapers, radio, printed schedules.
1.3 Objectives of the study
Information technologies and information itself are one of the promising solutions for more effective usage of current transportation systems with less cost. The
main objective of this study is to investigate the effects of information for more effective usage of available infrastructure and transportation systems.
In the first case study, effects of expressway toll discounts on route choice decisions of freight and production companies were investigated. For this purpose, revealed and stated preference data types were combined in a model and effectiveness of the combined RP/SP route choice model was tested with information of discounted toll. In addition, the variations on value of time with three different socioeconomic characters were investigated. Proposed combined RP/SP models' estimation reliability and applicability to real conditions were tested by using data collected from route choice experiments.
In the second case study, firstly, differences in the characteristics of transit and non-transit users were investigated in Izmir City. The main objective of the study is to identify important transit information which effects the satisfaction level of transit users with their service levels. In addition, socioeconomic factors, which affect this satisfaction level, were clarified. Finally, transit users were divided into two mode segments; better service quality with more information and less service quality with less information. There are some significant differences between the segments thus, considered information types and their service levels were investigated separately for these segments.
1.4 Outline of dissertation
This dissertation consists of six chapters. In Chapter 1, the history of transportation problems and the role of information to solve these problems are discussed. Then, the concepts and methodologies used in the case studies and the objectives of the study are presented.
In Chapter 2, a route choice model with information of discounted expressway toll was proposed for freight and production companies. In this route choice model both revealed and stated preference data were combined. Final model was proposed in linear and nonlinear forms.
In Chapter 3, a brief review was done about value of time concept. Then, value of time for the estimated models in the first case study was calculated. The variation on the value of time is investigated by considering three socioeconomic characteristics in four models.
In Chapter 4, two route choice experiments and findings from these experiments were introduced. Later on, these experiments were used to verify the proposed model structure for route choice. Reliability of estimated route choice decisions of freight and production companies were tested with these experiments. Finally, data used in the pre- survey and data from route choice experiments were combined in three pooled data sets.
Transferability of the proposed model to the actual conditions were tested with these pooled data sets.
In Chapter 5, effects of transit information systems on the satisfaction of transit users were investigated. Differences between the transit and non-transit users were presented. Most important transit information types and their service levels were identified for transit users. In addition, which information sources are considered to get transit information was investigated. Finally, transit users were divided into two segments depending on the service quality of transit mode which they were using.
Considered information types and their service levels were investigated separately for these segments.
Brief conclusion is given at the end of each chapter. All the results obtained from five chapters are summarized in Chapter 6. Importance of the study and proposals for future works are cordially stated.
A Combined RP/SP Route Choice Model with Information of
Expressway Toll-Case Study 1
2. A COMBINED RP/SP ROUTE CHOICE MODEL WITH INFORMATION OF EXPRESSWAY TOLL-CASE STUDY 1
2.1 Introduction
Kumamoto is the third biggest city in Kyushu Island with a population of 656,096 and number of vehicles of around 289,000. Because of traffic accidents, traffic congestion and air pollution due to vehicle emissions, traffic becomes a big problem in Kumamoto City. In order to solve this problem, the Local Government of Kumamoto Prefecture decided to carry out a social experiment which intends to convert ordinary road traffic to expressway through toll pricing.
Expressways, as a part of road network, should normally ensure public benefits by decongesting local road networks and provide more reliable travel time without any fee. However, increasing demands due to development sprawl and the high costs of infrastructure investments forced governments to impose tax collections to allow for appropriate funds to finance infrastructure projects. In Japan, the 1956 Law Concerning Special Measures for Highway Construction was legislated to introduce toll road system to compel costs on expressway users to finance infrastructure investments. Toll pricing policies must provide equilibrium between people's welfare and financing requirements of infrastructure investments.
The target respondents in this study are mainly freight and production companies within Kumamoto Prefecture. These companies' vehicles are usually trucks that cause more traffic problems than the private cars. However, they do not use expressway because of budget constrains. For this reason, route choice decisions and travel behaviors of freight and production companies are investigated in this study.
Analysis of expressway demand should be done based on users' and potential users' behavior. Discrete choice analysis of road users' route preference between expressway and ordinary road options are effective methods of observing choices based on alternative attributes and road users' inherent socioeconomic characteristics. In most cases, revealed preference data are used in route choice analysis. RP data are choices made under real situations. For instance, actual route choice decision from one destination to another with information of attributes of each alternative route can be classified as RP data. It is based on actual market behavior and may not directly predict responses to new or improved alternative attributes. More so, employing RP survey require higher costs due to large number of sample needed and correlation of attributes or small variability (Ortuzar and Iacobelli, 1998). Stated preference data or choices in hypothetical situations can respond to improving alternative set. SP data are commonly used when alternatives are not yet present. Introduction of SP data based alternatives may avoid costly actual implementation and provide important sensitivity analysis before actual policy implementation. Combining RP and SP data to take advantage of
prominent feature of each data type is another approach currently employed in discrete choice analysis (Ben-Akiva and Morikawa, 1990; Bradley and Daly; 1997). In this study, a modeling approach to combine these two types of data is investigated.
Data used in this study consist of route choices between ordinary road and tolled expressway. In addition, to study demand sensitivity with respect to toll, SP survey was done to determine shifting tendency of ordinary road users provided decrease in toll. Finally, RP and SP data were combined in a model. The main objectives of the study are:
• to provide the effective usage of expressway by toll pricing policy,
• to identify route choice behavior of freight and production companies separately,
• to test the effectiveness of combined route choice model by using RP and SP data, with information of discounted expressway toll.
2.2 Conducted surveys
During the study three main survey attempts were done. First one was a route choice survey which was conducted to freight and production companies. Afterwards, two route choice experiments were conducted on Kyushu Expressway. These experiments are very valuable to evaluate the situation before the actual policy implementation. Verification of the estimated models was done with these experiments.
However, these results are not discussed in this chapter, the specifications and results of these two experiments will be discussed in Chapter 4. The route choice survey will be discussed in detail in this chapter.
2.2.1 Route choice survey
A mailed route choice survey was conducted to freight and production companies within Kumamoto Prefecture. The aim of the survey is to collect data for the future toll policy's decisions to convert traffic from ordinary road to expressway. In the survey, route choice decisions and conversion characteristics of freight and production companies were investigated under different discounted toll levels. A total of 150 questionnaires were delivered, 50 to production and 100 to freight companies. Finally, 32 of them from production and 39 from freight companies were collected. The response rates are 64% and 39% for production and freight companies, respectively.
Survey was conducted from 25th November to 5th December, 2003.
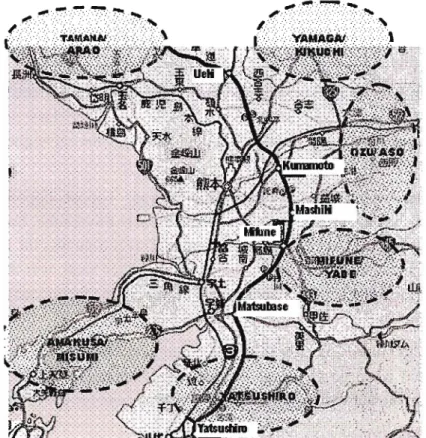
Questionnaires in the survey have three main parts; socioeconomic characteristics and general attitudes, revealed preference data and stated preference data. In the survey design, the area is divided into six zones under three directions; north, east and south inside the prefecture:
• North direction - Tamana/Arao and Yamaga/Kikuchi,
• East direction - Ozu/Aso and Mifune/Yabe,
• South direction - Yatsushiro and Amakusa/Misumi.
The location of the zones and interchanges on the Kyushu expressway are indicated in Figure 2.1.
Two different kinds of questionnaires were prepared for freight and production companies. The questionnaires are similar except some small details. In the questionnaires for production companies, questions about the route choice were asked in two different sheets for cars and trucks. Thus, route choice decisions of trucks and cars were obtained separately. The answers given for the trucks were considered for both company types.
a) Socioeconomic characteristics and general attitudes
Questionnaires start with drawing name, address and telephone number of companies. Then, number and types of vehicles and number of employees working in
I YUUfiJV 1
i
Figure 2.1 Study area.
the company were asked to identify the socioeconomic characteristics of the company.
In addition, companies were asked how many of the vehicles have Electronic Toll Collection (ETC) equipment.
When the companies were asked of usual trip or destination directions in their business trips, it is found that the biggest portion of the freight companies' trips is inside the prefecture (43.5%) while the biggest chunk of production companies' trips is within Kyushu Island (41.2%). Figure 2.2 refers.
Business trips of Production Com.
41.20% 29.40%
29.40%
Business trips of Freight Com.
33.80% 43-50%
22.70%
D Inside Kumamoto Pref.
■ Out of Kyushu D Inside Kyushu
Figure 2.2 Business trip directions of companies.
Route choice decisions on daily business trips were found to be mainly that of the driver most of the time (74%). When the companies who usually use ordinary roads were asked "Why you do not use expressway instead of ordinary roads?", most of the production companies (45.5%) answered "Using expressway does not shorten our travel time". The common answer of freight companies for the same question was high expressway cost with 42.9%.
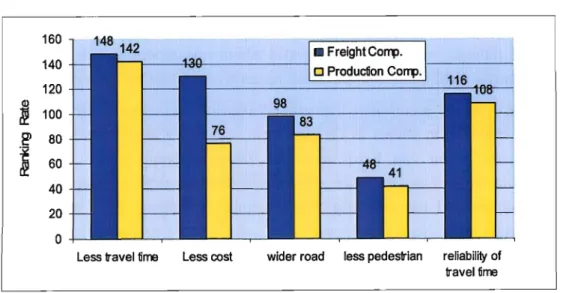
Companies were asked to rank five factors, 1-most important to 5-less important, affecting route choice decisions which include travel time, travel cost, wider roads, less pedestrian, and reliability of travel time. Travel time was the most important factor for both companies. Reliability of time, on the other hand, was the second most important factor for the production companies; however, this factor was cost for freight companies. Results of this evaluation are indicated in Figure 2.3.
Freight and production companies were likewise asked if they would change the route usually used when heavy congestion occurs. Responses are presented in Figure 2.4. The most common answer is that drivers sometimes change their route.
b) Revealed preference data
The second part of the questionnaire was designed to collect RP data. RP data are mainly used in route choice analysis. RP data are choices made under real situations. For instance, actual route decision from a certain place to one destination
148 ■ Freight Cortp.
a Production Comp.
116 -res-
Less travel fime Less cost wider road less pedestrian reliability of travel Sme
Figure 2.3 Factors which effect drivers' route choice decisions.
■ I use exp. And do not change it D I use ord. road but
I seldom change D I sometimes
convert to exp.
■ I sometimes change myusall ord. road
■ I sometimes change to suburb roads.
■ others Freight Comp. Production Comp.
Figure 2.4 Decision of companies during congestion.
with attributes of alternative routes can be classified as RP data. It is based on actual market behavior and may not directly predict responses to new or improved alternative attributes. More so, employing RP survey require higher costs due to large number of sample needed and often not enough information is available for the group of options due to the problems of correlation of attributes or small variability (Ortuzar, 1998).
RP data includes only existing alternatives and require defining the choice set and calculating level of service information for the non-chosen options. Moreover, variables such as cost and time are often correlated. Further, it has been demonstrated that RP data are not measured with a high level of precision, model structures and functional forms which would be appropriate with a fully disaggregate data set may not be selected leading to unknown bias in forecasting (Daly and Ortuzar, 1990).
In the RP part of the questionnaire, first, a background page was shown which
were asked to draw actual routes taken for various destination routes. Each company was asked to indicate on the map three routes which was chosen and shown depending on the company's location. Travel direction zones are different for each company.
As an example, a company located at Yatsushiro area was asked to indicate the routes when traveling to clients in Tamana/Arao, Yamaga/Kikuchi and Ozu/Aso areas.
Thus, each respondent can have maximum three different routes. Based on the indicated route on the map, attributes of route chosen and most appropriate alternative route were considered for each trip. For example, if ordinary road was chosen, an alternative route which uses expressway was created and travel attributes as distance, travel time and toll were calculated. Distances are calculated on the map and travel times are calculated with the help of HI 1 national census of travel time in Japan roads, normal travel times were used, not the peak hours.
The actual routes of companies according to road type depending on the route mapped are indicated in Figure 2.5. It is obvious that freight companies are mostly ordinary road users, but, it is opposite for production companies.
\\7.5°A
2.5°/
3.0°/
$2.5°/
1)7.6°/
production
comp
Freight All users
comp.
■ ex p. way Dord. road
Figure 2.5 Expressway usage rates of companies.
c) Stated preference data
Stated preference methods are used to estimate the demand for new policy implementations or introduction of a new road or mode. Policy implementation or introduction of a new road is presented by the help of hypothetical scenarios. Basically, SP approach is based on answers to hypothetical choice situations. This method has attracted increasing attention in transport studies since the end of 1970s, especially, in travel behavior research. The term stated preference is used within transport studies to refer a wide class of methods based on study of individuals in hypothetical contexts consisting of one or more alternatives that are typically defined in terms of
combinations of levels of attributes. Thus, SP methods basically differ from RP methods as RP depend on the observation of actual market outcomes. SP data or choices in hypothetical situations can respond to improving alternative set. In addition, SP design has some advantages such as; controlling statistical problems as multi- collinearity and the lack of variance in explanatory variables and the increased possibility of including subjective or qualitative factors as explanatory variables (Hensher, 1994; Kroes and Sheldon, 1988).
SP data are commonly used when alternatives are not yet present. It can measure not-yet existing travel modes, or how people take actions in adopting new policies (toll pricing, introduction of new mode or road). Introduction of SP data based alternatives may avoid costly actual implementation and provide important sensitivity analysis before actual policy implementation, because, new alternatives in transport policy are often highly visible and would require a lot of time and cost. Generally, there is not an opportunity to evaluate actual responses for a policy implementation through the collection of RP data.
There has been increasing popularity of SP methods towards greater use of disaggregate data and analysis procedures. In addition, applied focus of much SP work has also meant that transport researchers have enjoyed the benefit of much larger and more representative samples than have been available in many other fields of study with the advantage of using SP data.
SP data, designed to overcome most RP problems, allow researchers to have good quality information (the design is under the analyst's control) and better surveys can be designed since many observations can be obtained from each respondent (Ortuzar, 1998). However, consideration of hypothetical situations cause some biases such as; fatigue, reporting bias and non-reporting bias. SP data can be used to identify three main purposes; estimation of travel behavior under new policy implementation, valuation of attributes, derivation of preferred transport packages. In this study, it was used for the first purpose, estimation of route choice decisions under discounted expressway toll.
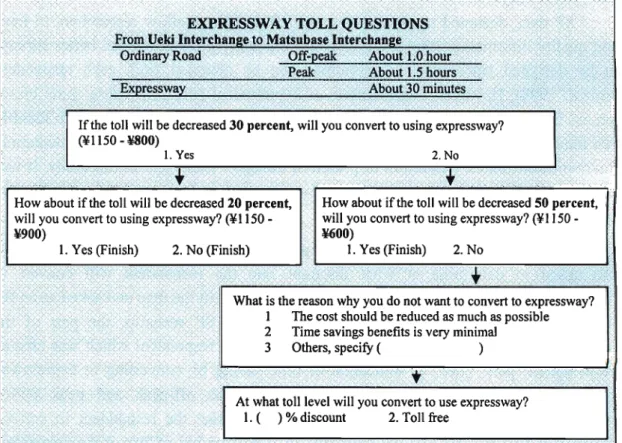
Third part of the questionnaire was prepared for SP questions. These questions were asked to determine at what discount rate the respondent will convert to expressway from ordinary road. For each route indicated in the map and asked as an RP data, an SP scenario was added afterwards. In the SP scenario, the part of the alternative expressway route was shown initially to the respondent which was created due to the RP part. Then, an indication of time saving by converting to expressway along with the actual toll was shown including the off-peak and peak period timesavings. A bidding of discount rate that will attract the respondent to convert follows. The first bid is a 30% discount rate. A follow up bid of 20% if the respondent
question on eliciting reason for no-no response was added along with the minimum acceptable discount rate of respondent for conversion.
SP question was designed in such a way that, as an example, a freight company in Tamana/Arao area and traveling to Yatsushiro area has a corresponding most likely part of the expressway that will be driven and used in the SP design as shown in Figure 2.6.
In encoding the SP data, minimum accepted discount rate was used. Using this data, a binary variable that take a value one, if the respondent is willing to convert at a certain discount rate and the zero, if the respondent wants the removal of toll or expressway does not match with the trip direction or finds small time saving benefits in converting to expressway was likewise formed from the data.
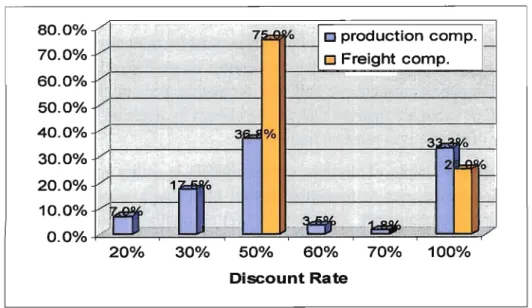
Minimum willingness to pay bids of ordinary road users for the expressway toll are indicated in Figure 2.7 separately for freight and production companies.
2.3 Modeling methodology
Estimation of discrete route choice generally consists of RP data, or individual choices made given attributes or level of service of alternative routes and inherent socioeconomic characteristics. These types of data are suitable for eliciting preferences over new or proposed alternative. SP and RP data each have their own advantages and
EXPRESSWAY TOLL QUESTIONS
■::■■■■:■: From Ueki Interchange to Matsubase Interchange
Ordinary Road Off-peak About 1.0 hour Peak About 1.5 hours
Expressway About 30 minutes
If the toll will be decreased 30 percent, will you convert to using expressway?
(¥1150 -¥800)
l.Yes 2. No
,,;.: i
-: How about if the toll will be decreased 20 percent, will you convert to using expressway? (¥1150 -
¥900)
1. Yes (Finish) 2. No (Finish)
.-;;■:-..:■;- - ■■■,.■" ■;'■
1
How about if the toll will be decreased 50 percent, will you convert to using expressway? (¥1150-
¥600)
l.Yes (Finish) 2. No
What is the reason why you do not want to convert to expressway?
1 The cost should be reduced as much as possible 2 Time savings benefits is very minimal
3 Others, specify ( )
t
At what toll level will you convert to use expressway?
1. ( ) % discount 2. Toll free
Figure 2.6 Stated preference questions.